. 2021 Jan 1;5(1):36-56.
doi: 10.7150/ntno.50185. eCollection 2021.

Macrophage imaging and subset analysis using single-cell RNA sequencing

Affiliations

Macrophage imaging and subset analysis using single-cell RNA sequencing

Sean Arlauckas et al. Nanotheranostics. .

Abstract

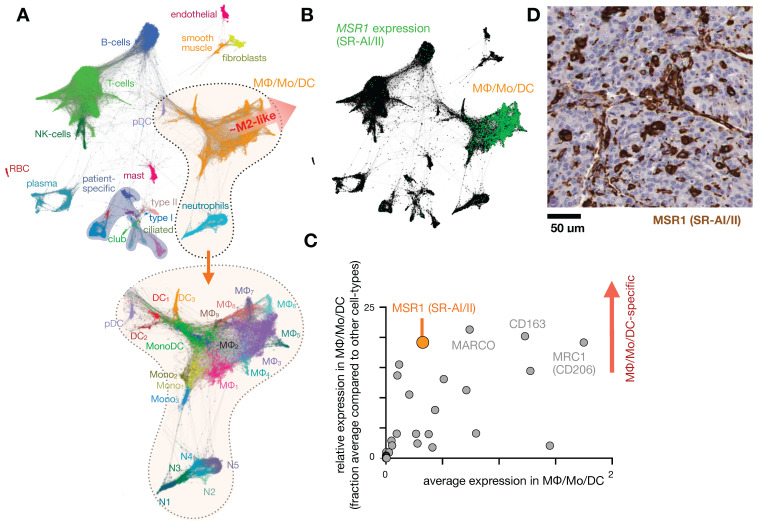
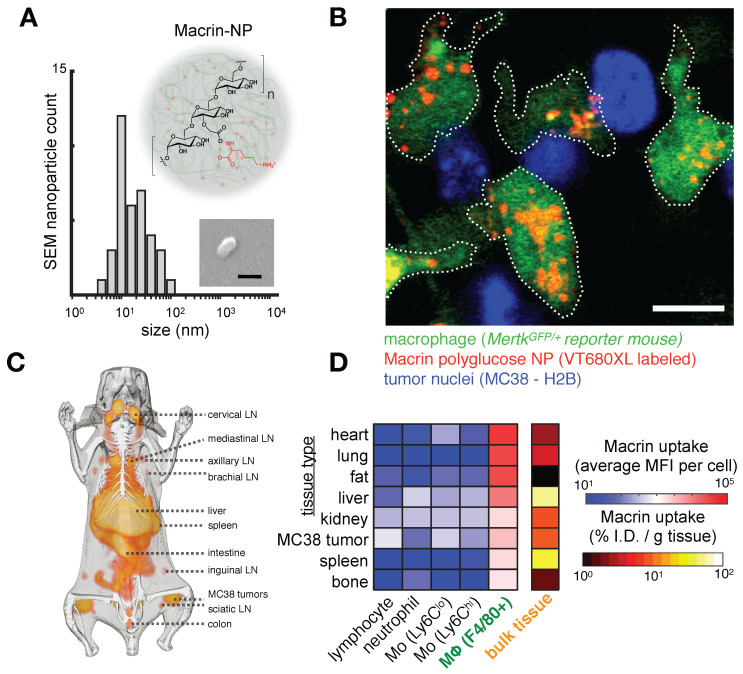
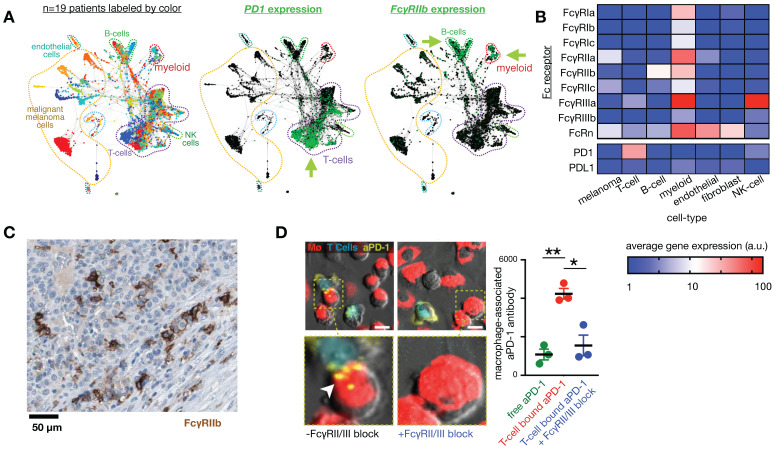
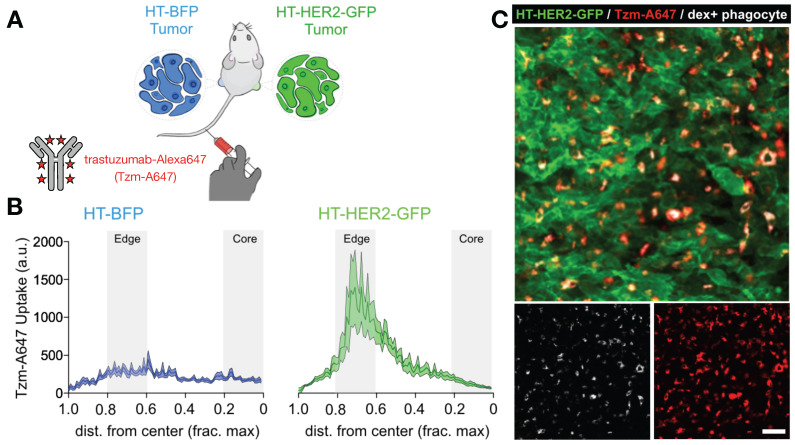
Macrophages have been associated with drug response and resistance in diverse settings, thus raising the possibility of using macrophage imaging as a companion diagnostic to inform personalized patient treatment strategies. Nanoparticle-based contrast agents are especially promising because they efficiently deliver fluorescent, magnetic, and/or radionuclide labels by leveraging the intrinsic capacity of macrophages to accumulate nanomaterials in their role as professional phagocytes. Unfortunately, current clinical imaging modalities are limited in their ability to quantify broad molecular programs that may explain (a) which particular cell subsets a given imaging agent is actually labeling, and (b) what mechanistic role those cells play in promoting drug response or resistance. Highly multiplexed single-cell approaches including single-cell RNA sequencing (scRNAseq) have emerged as resources to help answer these questions. In this review, we query recently published scRNAseq datasets to support companion macrophage imaging, with particular focus on using dextran-based nanoparticles to predict the action of anti-cancer nanotherapies and monoclonal antibodies.


Conflict of interest statement

Competing Interests: The authors have declared that no competing interest exists.

Figures

Figure 1
Figure 1
Expression of scavenger receptors in lung tumors. A) Single-cell RNAseq was pooled from 7 patients with lung cancer and automatically clustered according to gene expression profile (and thus cell-type) using the SPRING algorithm. Each data point represents a single-cell. At bottom, magnification of the MΦ/monocyte/DC cluster can be further categorized into polarization subtypes. From GSE127465 and SPRING analysis in . B) Corresponding to A, expression of the scavenger receptor type a (SR-AI/II, also known as MΦ scavenger receptor 1, MSR1) is shown in green. C) From data in A, a panel of 30 scavenger receptors is plotted as a function of average (x-axis) and relatively selective (y-axis) expression in the MΦ/Mo/DC cluster. D) Immunohistochemistry of MSR1 in a biopsied lung adenocarcinoma, showing staining consistent with myeloid expression (from the Human Protein Atlas v19.3 195).
Figure 2
Figure 2
The dextran-based nanoparticle Macrin accumulates selectively in MΦ in tumor and healthy tissue. A) Scanning electron microscopy of Macrin, a ~20 nm diameter crosslinked polyglucose nanoparticle that can be labeled with fluorescent probes or the radionuclide 64Cu. Scale bar, 20 nm. B) Confocal microscopy shows selective Macrin accumulation in tumor associated MΦ, in tumors growing in the MertkGFP/+ reporter mouse model, which contains GFP+ MΦ. Scale bar, 10 μm. C) Positron emission tomography / X-ray computed tomography (PET/CT) of 64Cu-labeled Macrin in mice bearing MC38 tumor allografts. D) Using the same allograft model, fluorescent Macrin was analyzed for uptake on a per-cell basis by flow cytometry. In all tissues, Macrin accumulation was highest in MΦ, and total organ uptake correlated with MΦ density in tissues rather than uptake on a per-cell basis. All adapted with permission from , copyright 2018.
Figure 3
Figure 3
Fc receptors are highly expressed in myeloid cells and can impact the cellular biodistribution of an anti-PD1 therapeutic antibody. A) Single-cell RNAseq data from >4,500 cells of melanoma biopsies was clustered according to gene-expression (and thus cell-type), and expression of PD1 and FcγR2b are shown by green color. In this patient cohort, expression of the target of nivolumab, an IgG4 anti-PD1 antibody, is primarily found in T-cells, while its inhibitory Fc receptor FcγR2b is primarily found in B-cells and myeloid cells, including MΦ. Figure adapted with permission from using scRNAseq data GSE72056 , copyright 2020. B) Average expression values corresponding to single-cell data in A. C) Immunohistochemistry of a melanoma metastasis to the pancreas shows high FcγR2b expression in cells consistent with infiltrating myeloid cells (from the Human Protein Atlas v19.3 195). D) 30 minute time-lapse microscopy of co-culture using PD1+ T-cells, MΦ, and anti-PD1 antibody shows transfer of antibody to MΦ from T-cells that were pre-treated with the antibody, in a FcγR2/3 dependent manner. Scale bar 10 μm. Adapted with permission from , copyright 2017.
Figure 4
Figure 4
Matched HER2+ and HER2- xenografts show target-dependent and -independent antibody uptake into tumor associated phagocytes. A) Contralateral xenografts were grown either with transgenic expression of a HER2-GFP fusion protein (HT-HER2-GFP), or with blue fluorescent protein lacking HER2 as a control (HT-BFP). Fluorescently labeled anti-HER2 antibody trastuzumab (Tzm-AlexaFluor647) was injected intravenously and tissue was collected the following day. B-C) Quantification (B) and corresponding representative confocal microscopy (C) revealed that trastuzumab accumulated in both tumor-types, but at higher levels in the HER2+ tumors. However, by 24 h most antibody was in phagocytes including MΦ, rather than on HER2+ tumor cells. Scale bar, 50 μm. Adapted with permission from , copyright 2020.
Figure 5
Figure 5
Immune checkpoint blockade shifts TAM polarization and spatial infiltration. A-B) Intravital microscopy was used to assess allografts of the MC38 cancer cell line growing in a genetic reporter mouse model where yellow fluorescent protein was driven by arginase 1 (Arg1) promoter activity. Images before and 3 days after anti-PD1 antibody treatment show decreased Arg1 expression. Scale bar, 100 μm. C) The SPRING algorithm was used to cluster scRNAseq using the same allograft model into immune cell-types, revealing Arg1 expression (green) primarily in TAM subsets labeled Arg1a and Arg1b. D) Violin plots from scRNAseq data show both Arg1a and Arg1b subsets express high levels of Fcgr2b compared to other immune subsets. Adapted with permission from , copyright 2018.
Figure 6
Figure 6
Targeting the efferocytosis receptor MERTK to image MΦ. A) As in Fig. 1, scRNAseq was pooled from 7 patients with lung cancer and MERTK expression is shown in green. Some patients show MERTK+ cancer cells, and MERTK is expressed across multiple MΦ subsets. From GSE127465 and SPRING analysis in . B) Example immunohistochemistry from a lung adenocarcinoma biopsy shows MERTK staining consistent with expression in stromal / myeloid cells rather than malignant cells (from the Human Protein Atlas v19.3 195). C) The MERTK kinase inhibitor UNC-2025 was modified with the near-infrared silicon rhodamine COOH (SiR) to yield the fluorescent probe MERi-SiR, shown in a docking simulation bound to MERTK. D) Confocal microscopy of CT26 allograft tumors in the MertkGFP/+ knock-in reporter mouse shows co-localization in GFP expression (which reports on Mertk expression) with uptake of MERi-SiR. Scale bar, 50 μm. C-D adapted with permission from , copyright 2017.
Figure 7
Figure 7
Probing solute carrier family proteins. A) As in Fig. 1, scRNAseq was pooled from 7 patients with lung cancer, and expression of 406 solute carrier family (SLC) genes were plotted as a function of average expression (x-axis) and selectivity of expression within the lung (y-axis), among cells in the MΦ/Mo/DC cluster. From GSE127465 and SPRING analysis in . B) The fluorescent probe CDg16 was identified in a high-throughput screen as selectively accumulating in activated MΦ, and CRISPR screening revealed SLC18B1-mediated uptake . C) CDg16 was used to image MΦ-rich plaques in the aortas of atherosclerotic ApoE-knockout mice. Excised vessels are annotated with the root of the aorta arch (RAA), the right brachiocephalic artery (RtB), the thoracic aorta (TA), and the abdominal aorta (AA). C, adapted with permission from , copyright 2019.
Figure 8
Figure 8
MΦ expression and imaging of ADME-relevant enzymes and transporters. A) As in Fig. 1, single-cell RNAseq was pooled from 7 patients with lung cancer, and expression of 288 high-priority genes related to drug PK (www.PharmaADME.org) were plotted as a function of average expression (x-axis) and selectivity of expression within the lung (y-axis), among cells in the MΦ/Mo/DC cluster. From GSE127465 and SPRING analysis in . B) Corresponding to A and Fig. 1, data were clustered according to cell-type, and expression of CES1 (hCE1) is shown in green. Arrows highlight high-expressing populations. C) Immunohistochemistry of CES1 in biopsied healthy and malignant lung tissue, showing representative examples of staining consistent with high expression in alveolar MΦ (left), high tumor-cell expression (middle), and high phagocyte or stromal expression (right). From the Human Protein Atlas v19.3 . D) Example CES1-activatable prodrugs, and CES1-neutralized substances, which may be metabolized by phagocytes in the lung. Gray boxes mark site of carboxylesterase cleavage. E) Probes have been developed to report carboxylesterase activity, with relative CES1 versus CES2 specificity noted. CES-mediated cleavage yields a functional bioluminescence substrate (top left 196), creates a red-shift in fluorescence following single-photon (bottom left 197) or two-photon fluorescence excitation (top right 198), and turns on fluorescence, as with fluorescein diacetate which is used with purified enzyme or as a readout of cell viability (bottom right).
Figure 9
Figure 9
Mapping carboxylesterase expression using the Human Cell Landscape. A) Clustering of scRNAseq data from the human cell landscape project shows >700,000 individual cells colored according to their tissue of origin. Epithelial cells from the intestine (primarily EpCAM+ cells including from the colon, rectum, jejunum, and duodenum) and myeloid cells from the lung (primarily CD68+ CD206+ cells, referred to here as lung MΦ) are highlighted. B) CES1 is found expressed in the cluster of cells that includes high levels of lung MΦ, and is relatively absent in intestinal epithelium. C) Expression of CD206 is high in the cluster of CES1+ cells identified as lung MΦ, but is not restricted to that population. D) CES2 is highly expressed in the intestinal epithelium compared to lung MΦ. See CellXGene and https://db.cngb.org/HCL/ for software to generate plots, described in .
Figure 10
Figure 10
Clinical kinase inhibitors influence tumor associated MΦ to improve nanotherapy delivery. A) scRNAseq from BRAF-mutant melanoma biopsies tabulated ligand-receptor communication between malignant melanoma cells (“mel”) and MΦ across >1100 known ligand-receptor pairs; top receptor tyrosine kinase (RTK) pathways are shown. B) Gene set enrichment analysis of a genomic CRISPR screen shows that genetic silencing of MAPK/ERK pathway components — including RAS, RAF, and ERK proteins — leads to enhanced uptake of nanoparticles in MΦ. Genes were ranked according to the effect their CRISPR-mediated silencing had on nanoparticle uptake. MAPK/ERK components were enriched in increasing uptake. C) A nanoformulation encapsulates the multi-kinase inhibitor foretinib into micelles composed of poly(ε-caprolactone)-block-methoxy poly(ethylene glycol) (PCL-b-mPEG) and poly(lactic-co-glycolic) acid (PLGA), producing “NanoFore.” Key drug targets are boldfaced in A. D) NanoFore accumulates in tumor associated MΦ within melanoma allografts, as measured by confocal microscopy. Macrin (dextran-NP; see Fig. 2) was used to label MΦ. Scale bar, 50 μm. E-F) As predicted by the CRISPR screen in B, inhibition of MAPK/ERK activity with clinically-used BRAF inhibitor (dabrafenib) and MEK1/2 inhibitor (trametinib) “D/T” led to enrichment of MΦ in tumors (see ref. 11), and a roughly 2x increase in NanoFore uptake in MΦ on a per-cell basis, as measured by flow cytometry. For all, adapted with permission from , copyright 2020, and with data from .

References

    1. Pollard JW. Trophic Macrophages in Development and Disease. Nat Rev Immunol. 2009;9:259–270. - PMC - PubMed
    1. Ngambenjawong C, Gustafson HH, Pun SH. Progress in Tumor-Associated Macrophage (TAM)-Targeted Therapeutics. Adv Drug Deliv Rev. 2017;114:206–221. - PMC - PubMed
    1. Drummond DC, Noble CO, Guo Z, Hong K, Park JW, Kirpotin DB. et al. Development of a Highly Active Nanoliposomal Irinotecan Using a Novel Intraliposomal Stabilization Strategy. Cancer Res. 2006;66:3271–3277. - PubMed
    1. Maeda H, Wu J, Sawa T, Matsumura Y, Hori K. Tumor Vascular Permeability and the EPR Effect in Macromolecular Therapeutics: A Review. J Control Release. 2000;65:271–284. - PubMed
    1. Shi J, Kantoff PW, Wooster R, Farokhzad OC. Cancer Nanomedicine: Progress, Challenges and Opportunities. Nat Rev Cancer. 2017;17:20–37. - PMC - PubMed

Publication types