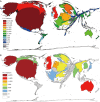
Mammography: density equalizing mapping of the global research architecture
- PMID: 33392018
- PMCID: PMC7719914
- DOI: 10.21037/qims-19-774
Mammography: density equalizing mapping of the global research architecture
Abstract
Background: Since mammography belongs to the most important preventive techniques in modern medicine, this study maps the related worldwide research output, which encompasses quantitative and qualitative aspects of the scientific activity and socio-economic features.
Methods: The New Quality and Quantity Indices in Science (NewQIS) computing platform identified all mammography-specific articles in the Web of Science within two time periods, from 1900 to 2014 (P1) and from 2015 to 2020 (P2), a combination of density-equalizing mapping projections (DEMP) and socio-economic benchmarking was applied for analysis.
Results: A total of 13,629 articles were retrieved. 8,744 articles were identified in P1 and 4,885 in P2. More than 100 articles were published annually since the 1980s. Regarding productivity and collaborative efforts, the United States was the leading nation in both evaluation periods. In our socioeconomic analysis, it was also ranked at the first place in P1 [72.68 mammography-related publications per GDP/capita (RGDP)]. The US was followed by the UK and Germany in P1 and by UK and India in P2. When population sizes were related to mammography research activities, Scandinavian countries and the Netherlands showed the highest research activity in P1 (e.g., Sweden: 31.89 publications per 1 million inhabitants). Gender analysis illustrated a relative dominance of female researchers in most countries with the exception of Japan.
Conclusions: The global mammography research activity over the last century is paralleled by strong international collaborative efforts and follows largely economic figures and prevalence rates but displays distinct differences in comparison to the research landscape of other biomedical entities.
Keywords: Density equalizing map; mammography; spatiotemporal analysis.
2021 Quantitative Imaging in Medicine and Surgery. All rights reserved.
Conflict of interest statement
Conflicts of Interest: All authors have completed the ICMJE uniform disclosure form (available at http://dx.doi.org/10.21037/qims-19-774). The authors have no conflicts of interest to declare.
Figures


References
-
- Ferlay J SI, Ervik M, Dikshit R, Eser S, Mathers C, Rebelo M, Parkin DM, Forman D, Bray, F. GLOBOCAN 2012 v1.0, Cancer Incidence and Mortality Worldwide. IARC Cancer Base, 2012. - PubMed
-
- Forman D, Bray F, Brewster DH, Gombe Mbalawa C, Kohler B, Piñeros M, Steliarova-Foucher E, Swaminathan R, Ferlay J. Cancer Incidence in Five Continents, Vol. X. IARC Scientific Publication, 2014. - PubMed
LinkOut - more resources
Full Text Sources
Other Literature Sources
