. 2020 Dec 17:10:595266.
doi: 10.3389/fcimb.2020.595266. eCollection 2020.

Enteropathogenic Escherichia coli Infection Induces Diarrhea, Intestinal Damage, Metabolic Alterations, and Increased Intestinal Permeability in a Murine Model

Affiliations

Enteropathogenic Escherichia coli Infection Induces Diarrhea, Intestinal Damage, Metabolic Alterations, and Increased Intestinal Permeability in a Murine Model

Solanka E Ledwaba et al. Front Cell Infect Microbiol. .

Abstract

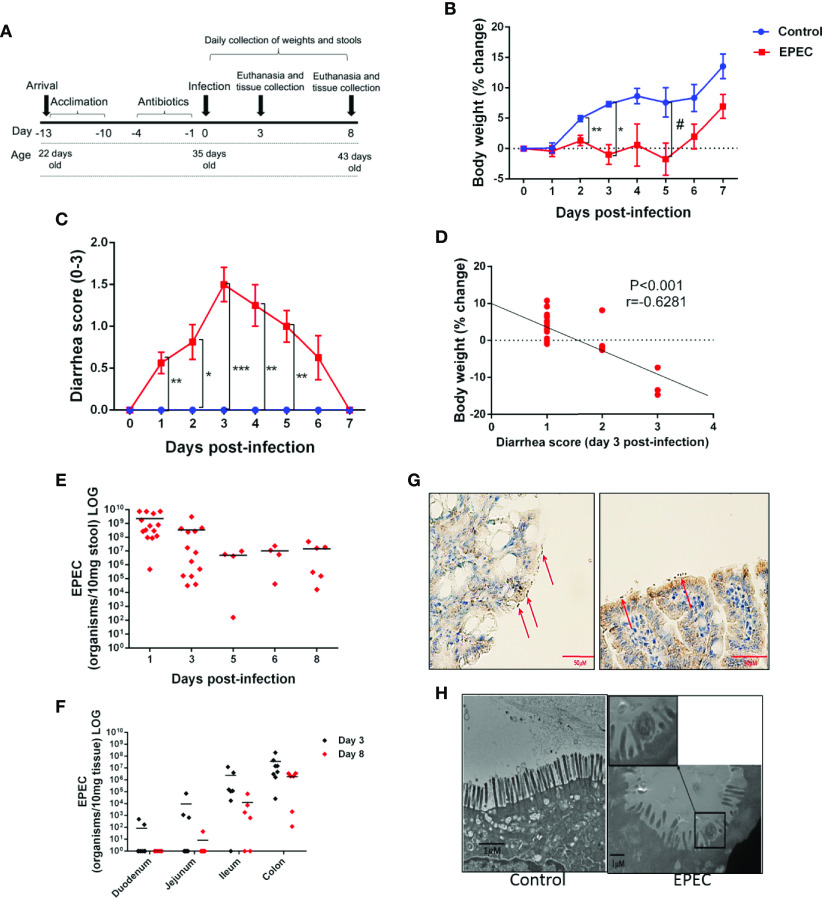
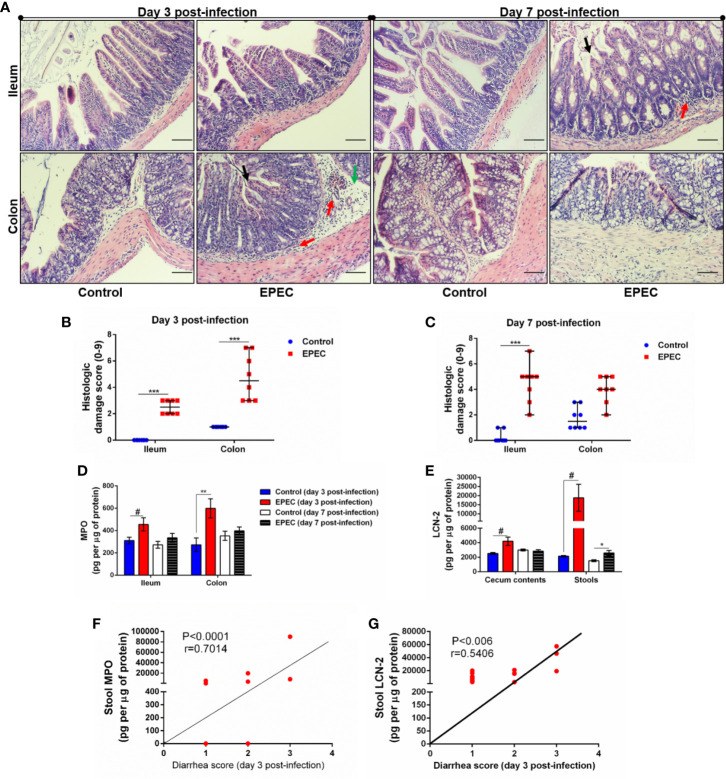
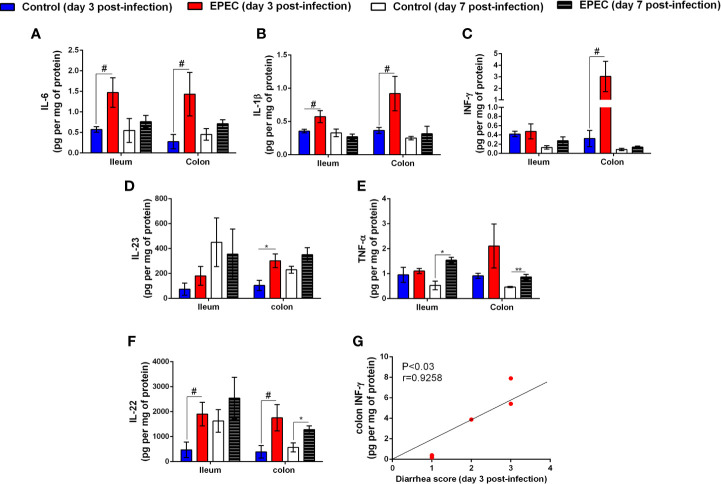
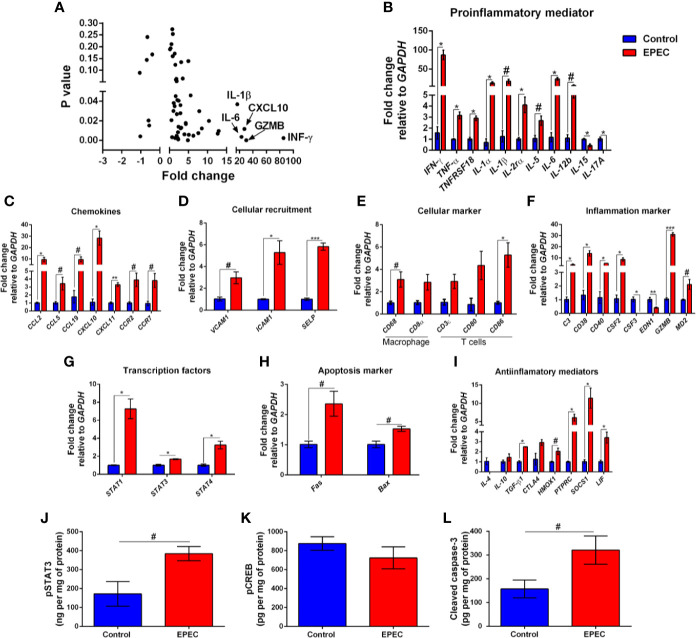
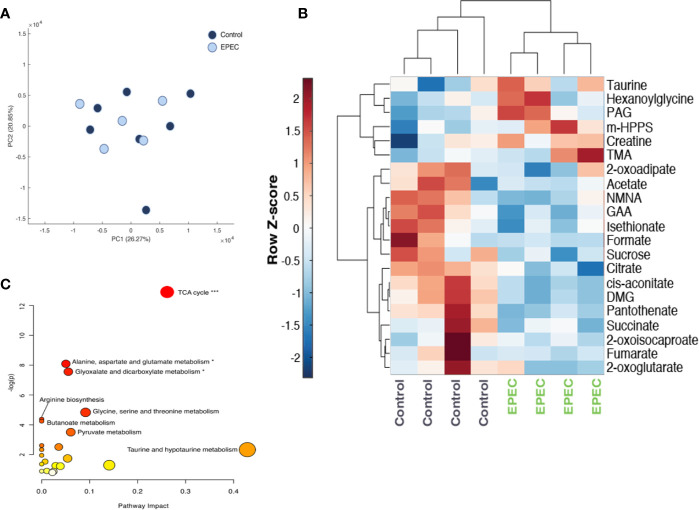
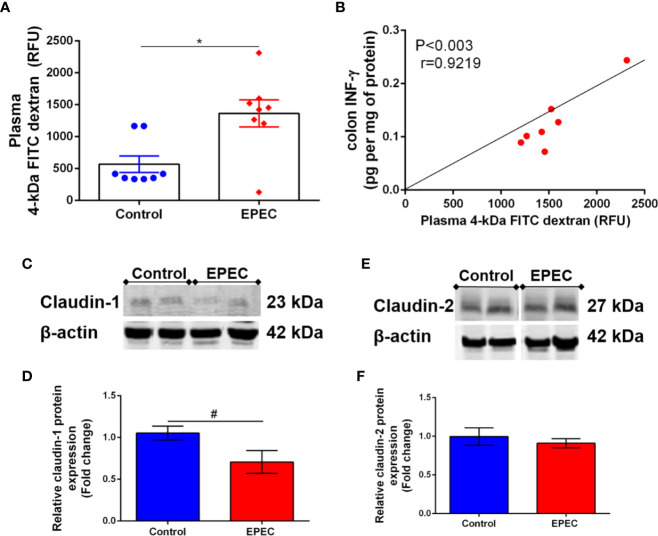
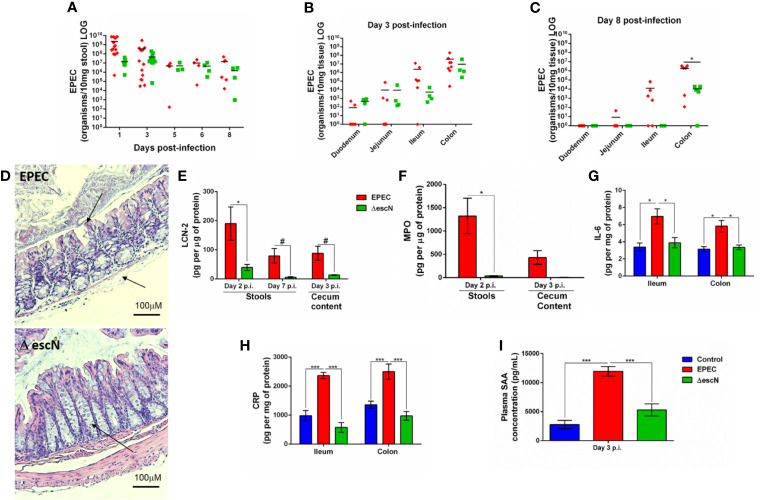
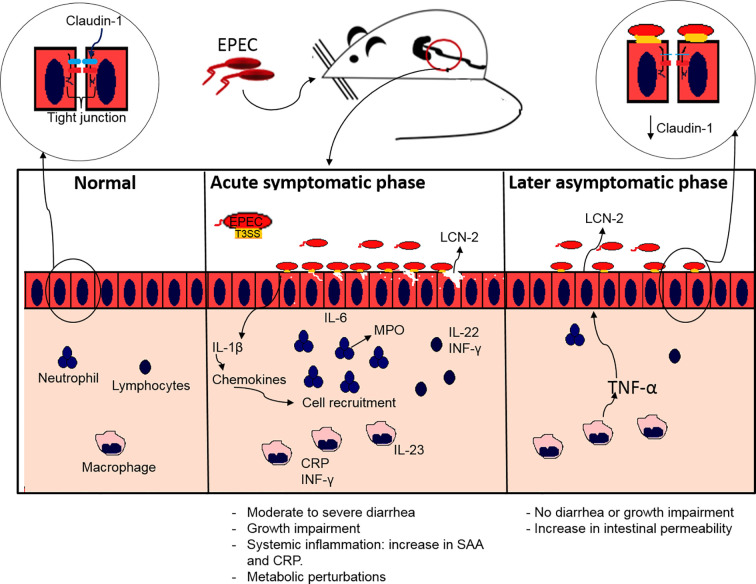
Enteropathogenic E. coli (EPEC) are recognized as one of the leading bacterial causes of infantile diarrhea worldwide. Weaned C57BL/6 mice pretreated with antibiotics were challenged orally with wild-type EPEC or escN mutant (lacking type 3 secretion system) to determine colonization, inflammatory responses and clinical outcomes during infection. Antibiotic disruption of intestinal microbiota enabled efficient colonization by wild-type EPEC resulting in growth impairment and diarrhea. Increase in inflammatory biomarkers, chemokines, cellular recruitment and pro-inflammatory cytokines were observed in intestinal tissues. Metabolomic changes were also observed in EPEC infected mice with changes in tricarboxylic acid (TCA) cycle intermediates, increased creatine excretion and shifts in gut microbial metabolite levels. In addition, by 7 days after infection, although weights were recovering, EPEC-infected mice had increased intestinal permeability and decreased colonic claudin-1 levels. The escN mutant colonized the mice with no weight loss or increased inflammatory biomarkers, showing the importance of the T3SS in EPEC virulence in this model. In conclusion, a murine infection model treated with antibiotics has been developed to mimic clinical outcomes seen in children with EPEC infection and to examine potential roles of selected virulence traits. This model can help in further understanding mechanisms involved in the pathogenesis of EPEC infections and potential outcomes and thus assist in the development of potential preventive or therapeutic interventions.

Keywords: antibiotics; diarrhea; enteropathogenic Escherichia coli; enteropathy; inflammation; murine model.


Conflict of interest statement

The authors declare that the research was conducted in the absence of any commercial or financial relationships that could be construed as a potential conflict of interest.

Figures

Figure 1
Figure 1
EPEC infection impairs weight gain, induces diarrhea and colon colonization in C57BL/6 mice. (A) Experimental timeline of EPEC infection model. Weaned C57BL/6 mice pretreated with antibiotic cocktail were orally infected with EPEC (1010 CFU). (B) Change in body weight of C57BL/6 mice infected with EPEC (EPEC) or uninfected (Control) (n=12/group). Line graphs represents mean ± SEM. **p< 0.009, *p<0.001 and #p< 0.04 using multiple Student’s t-test. (C) Diarrhea score of EPEC and control mice. Line graphs represent median ± SEM. *p<0.01, **p<0.006 and ***p<0.0001 using Kruskal-Wallis test followed by Dunn’s test. (D) Significant negative correlation between diarrhea score and change in body weight at day 3 p.i (Spearman rank test). (E). Quantification of EPEC shedding in stools. (F) Quantification of EPEC tissue burden in the intestinal tissues (duodenum, jejunum, ileum and colon) at days 3 and 8 p.i. (G) Immunohistochemistry staining of intimin (red arrows), in ileal tissue of EPEC infected mice at day 3 p.i. (H) TEM at day 3 p.i., showing disruption of the microvilli of mice infected with EPEC.
Figure 2
Figure 2
EPEC infection model induces acute colonic damage and inflammation followed by a positive correlation between diarrhea and inflammation markers in stools. (A) Representative H&E stains of ileal and colonic tissue collected from control and EPEC infected mice at days 3 and 7 p.i. Scale bars, 100 μm. (B, C) Histologic damage score based on epithelial damage (black arrow), mucosal edema (green arrow) and inflammatory cell infiltrate (red arrow) in the ileal and colonic tissue of uninfected (control group) and EPEC-infected (EPEC group) (B) mice at day 3 and (C) mice at day 7 p.i. Bars represent median ± SEM (n=8). ***p<0.0001 using Kruskal-Wallis test followed by Dunn’s test. (D) MPO levels measured in intestinal tissue lysates (ileum and colon) collected at days 3 and 7 p.i. (E) LCN-2 levels measured in the cecal and stool lysates collected at days 3 and 7 p.i. Bars represent mean ± SEM (n=8). #p<0.05, *p<0.03 and **p<0.007 using multiple Student’s t-test. (F) Significant positive correlation between diarrhea score and MPO levels in stools of EPEC-infected mice at day 3 p.i (Spearman rank test). (G) Significant positive correlation between diarrhea score and LCN-2 levels in stools of EPEC-infected mice at day 3 p.i (Spearman rank test).
Figure 3
Figure 3
EPEC infection increases pro-inflammatory mediators, and diarrhea scores correlates positively with INF-γ and KC levels in colonic tissues of EPEC infected mice. (A) Levels of IL-6, (B) IL-1β, (C) INF-γ, (D) IL-23, (E) TNF-α, and (F) IL-22 in the ileal and colonic tissues of control and EPEC infected mice at days 3 and 7 p.i. were measured by ELISA. Bars represent mean ± SEM (n=8). #p<0.05, *p<0.01 and **p<0.001 using multiple Student’s t-test. (G) Significant positive correlation between diarrhea score and INF-γ levels in colonic tissues of EPEC infected mice at day 3 p.i (Spearman rank test).
Figure 4
Figure 4
EPEC-infected mice with soft or unformed stools exhibit higher expression of mRNA for pro-inflammatory mediators, chemokines, and other inflammatory markers. (A) mRNA expression fold changes (on the x axis) and the corresponding p-values (on the y axis). Gene names are labeled next to highlighted significant results. Taqman qPCR analysis of (B) pro-inflammatory, (C) chemokines, (D) cellular recruitment, (E) cellular marker, (F) inflammation marker, (G) transcription factors, (H) apoptosis marker, and (I) anti-inflammatory genes in the colonic tissues of control and EPEC-infected mice with moderate (score=2) or severe (score=3) diarrhea scores at day 3 p.i. (A–I) Expression levels were normalized with GAPDH, as an internal housekeeping gene. Bars represent mean ± SEM (n=3). #p<0.05, *p<0.01, **p<0.001 and ***p<0.0001 using multiple Student’s t-test. Levels of (J) pSTAT3, (K) pCREB and (L) cleaved caspase-3 in colonic tissue lysates of control and EPEC-infected mice at day 3 p.i. measured using ELISA. Bars represent mean ± SEM (n=8). #p<0.05 using Student’s t-test.
Figure 5
Figure 5
Metabolomic analysis of urinary specimens collected from age-matched, control, and EPEC infected mice. (A) Principal component analysis (PCA) scores plot at day 1 p.i. showing no difference in the metabolic profiles of between infected and uninfected mice (control n=7, EPEC n=5). (B) Unsupervised hierarchical clustering and heat-map of urinary metabolites from control and EPEC-infected mice at day 3 p.i (n=4). Each row represents a metabolite and each column represents a mouse sample. The row Z-score (scaled expression value) of each metabolite is plotted in red-blue color. The red color indicates metabolites, which are high in abundance and blue indicates metabolites low in abundance. DMG, dimethylglycine; GAA, guanidinoacetic acid; m-HPPS, m-hydroxyphenylpropionylsulfate; NMNA, N-methyl-nicotinic acid; PAG, phenylacetylglycine; TMA, trimethylamine. (C) Pathway analysis plot created using MetaboAnalyst 4.0 showing metabolic pathway alterations induced by EPEC. Each pathway is represented as a circle. Darker colors indicate more significant changes of metabolites annotated on the corresponding pathway. The x-axis represents the pathway impact value computed from pathway topological analysis, and the y-axis is the-log of the p-value obtained from pathway enrichment analysis. The pathways that were most significantly changed are characterized by both a high-log(p) value and high impact value (top right region). FDR adjusted p-values, *p<0.05, ***p<0.0001.
Figure 6
Figure 6
EPEC infection model increases intestinal permeability and decreases claudin-1 expression in colon of mice. (A) Intestinal permeability was determined in the plasma of control and EPEC-infected mice at day 7 p.i. using FITC dextran assay. Each point represents a mouse. Lines represent mean ± SEM (n=8). *p < 0.006 using Student’s t-test. (B) Significant positive correlation between diarrhea score and INF-γ levels in colon tissues of EPEC-infected mice at day 7 p.i (Spearman rank test). (C). Representative western blots of levels of claudin-1 and β-actin in colonic tissues of control and EPEC-infected mice at day 7 p.i. (D) Quantification of western blot bands of claudin-1 and β-actin. Bars represent mean ± SEM (n=3). #p < 0.03 using Student’s t-test. (E) Representative western blots of levels of claudin-2 and β-actin in colonic tissues of control and EPEC-infected mice at day 7 p.i. (F) Quantification of western blot bands of Claudin-2 and β-actin. Bars represent mean ± SEM (n=3).
Figure 7
Figure 7
Inactivation of escN in EPEC decreases colonization in colon and reduces intestinal and systemic inflammation promoted by EPEC infection in mice. (A) Quantification of EPEC shedding in stools of WT EPEC (EPEC) or ΔescN EPEC infected mice. (B, C) Quantification of EPEC tissue burden in intestinal tissues (duodenum, jejunum, ileum and colon) at day 3 and 8 p.i. Bars represent mean ± SEM. *p < 0.01 using multiple Student’s t-test. (D) Representative H&E stains of colon from WT EPEC (EPEC) or ΔescN infected mice at day 3 p.i. Scale bars, 100 μm. (E) LCN-2 levels measured in stools (days 2 and 7 p.i.) and cecal contents (day 3 p.i.) of WT EPEC (EPEC) or ΔescN infected mice. (F) MPO levels measured in stools (day 2 p.i.) and cecal contents (day 3 p.i.). (G) IL-6 levels measured in the ileal and colonic tissue lysates at day 3 p.i. using ELISA (H) CRP levels measured in the ileal and colonic tissue lysates of uninfected (control, in blue), WT EPEC (in red) or ΔescN EPEC (in green) infected mice at day 3 p.i (I). Concentration of SAA in plasma at day 3 p.i. was determined using ELISA. Bars represent mean ± SEM (n=8). #p < 0.05, *p < 0.01 and ***p < 0.0001 using multiple Student’s t-test (E, F) or One-way ANOVA followed by Turkey´s test (G–I).
Figure 8
Figure 8
Proposed model of EPEC infection antibiotic pretreated mice displaying acute symptomatic and late asymptomatic phase. During acute symptomatic phase, colonization by EPEC leads to growth impairment, accompanied with moderate to severe diarrhea. Adherence of EPEC on the intestinal epithelial cells leads to increased IL-1β, which in turn stimulates chemokines synthesis, and consequently recruitment of neutrophils, macrophages and lymphocytes, resulting in increased release of MPO by neutrophils and LCN-2 by epithelial cells, as well as pro-inflammatory (IL-6, IL-23, INF-γ) and IL-22 cytokines indicating intestinal inflammation. A further increase in CRP and SAA indicates acute systemic inflammation. During the later asymptomatic phase an increase in LCN-2 inflammatory biomarker and an increase in TNF-α leads to increased intestinal permeability affecting the tight junction integrity by decreasing claudin-1 with no signs of diarrhea and growth impairment.

Similar articles

Cited by

References

    1. Abe C. M., Trabulsi L. R., Blanco J., Blanco M., Dahbi G., Blanco J. E., et al. (2009). Virulence features of atypical enteropathogenic Escherichia coli identified by the eae+ EAF-negative stx– genetic profile. Diagn. Microbiol. Infect. Dis. 64 (4), 357–365. 10.1016/j.diagmicrobio.2009.03.025 - DOI - PubMed
    1. Aden K., Rehman A., Falk-Paulsen M., Secher T., Kuiper J., Tran F., et al. (2016). Epithelial IL-23R signaling licenses protective IL-22 responses in intestinal inflammation. Cell Rep. 16 (8), 2208–2218. 10.1016/j.celrep.2016.07.054 - DOI - PMC - PubMed
    1. Alteri C. J., Mobley H. L. (2012). Escherichia coli physiology and metabolism dictates adaptation to diverse host microenvironments. Curr. Opin. Microbiol. 15 (1), 3–9. 10.1016/j.mib.2011.12.004 - DOI - PMC - PubMed
    1. Andrade A., Pardo J. P., Espinosa N., Pérez-Hernández G., González-Pedrajo B. (2007). Enzymatic characterization of the enteropathogenic Escherichia coli type III secretion ATPase EscN. Arch. Biochem. Biophys. 468 (1), 121–127. 10.1016/j.abb.2007.09.020 - DOI - PubMed
    1. Aychek T., Mildner A., Yona S., Kim K. W., Lampl N., Reich-Zeliger S., et al. (2015). IL-23-mediated mononuclear phagocyte crosstalk protects mice from Citrobacter rodentium-induced colon immunopathology. Nat. Commun. 6, 6525. 10.1038/ncomms7525 - DOI - PMC - PubMed

Publication types

Substances