. 2020 Dec 17:8:573647.
doi: 10.3389/fbioe.2020.573647. eCollection 2020.

Does Blast Exposure to the Torso Cause a Blood Surge to the Brain?

Affiliations

Does Blast Exposure to the Torso Cause a Blood Surge to the Brain?

Jose E Rubio et al. Front Bioeng Biotechnol. .

Abstract

The interaction of explosion-induced blast waves with the torso is suspected to contribute to brain injury. In this indirect mechanism, the wave-torso interaction is assumed to generate a blood surge, which ultimately reaches and damages the brain. However, this hypothesis has not been comprehensively and systematically investigated, and the potential role, if any, of the indirect mechanism in causing brain injury remains unclear. In this interdisciplinary study, we performed experiments and developed mathematical models to address this knowledge gap. First, we conducted blast-wave exposures of Sprague-Dawley rats in a shock tube at incident overpressures of 70 and 130 kPa, where we measured carotid-artery and brain pressures while limiting exposure to the torso. Then, we developed three-dimensional (3-D) fluid-structure interaction (FSI) models of the neck and cerebral vasculature and, using the measured carotid-artery pressures, performed simulations to predict mass flow rates and wall shear stresses in the cerebral vasculature. Finally, we developed a 3-D finite element (FE) model of the brain and used the FSI-computed vasculature pressures to drive the FE model to quantify the blast-exposure effects in the brain tissue. The measurements from the torso-only exposure experiments revealed marginal increases in the peak carotid-artery overpressures (from 13.1 to 28.9 kPa). Yet, relative to the blast-free, normotensive condition, the FSI simulations for the blast exposures predicted increases in the peak mass flow rate of up to 255% at the base of the brain and increases in the wall shear stress of up to 289% on the cerebral vasculature. In contrast, our simulations suggest that the effect of the indirect mechanism on the brain-tissue-strain response is negligible (<1%). In summary, our analyses show that the indirect mechanism causes a sudden and abundant stream of blood to rapidly propagate from the torso through the neck to the cerebral vasculature. This blood surge causes a considerable increase in the wall shear stresses in the brain vasculature network, which may lead to functional and structural effects on the cerebral veins and arteries, ultimately leading to vascular pathology. In contrast, our findings do not support the notion of strain-induced brain-tissue damage due to the indirect mechanism.

Keywords: blast overpressure; fluid-structure interaction; indirect mechanism; shock tube; traumatic brain injury.


Conflict of interest statement

The authors declare that the research was conducted in the absence of any commercial or financial relationships that could be construed as a potential conflict of interest.

Figures

FIGURE 1
FIGURE 1
Schematic representation of the animal setup inside the shock tube designed to isolate the brain from the blast wave and assess the effect of the indirect mechanism of blast injury. We conducted all experiments with the rat in a vertical orientation, with its ventral surface facing the incident blast wave. We considered a torso-only blast-exposure configuration, wherein we isolated the head of the rat from the blast wave by keeping it outside of the shock tube and securing it to a metal fixture using Velcro straps. To minimize the motion of the animal during blast exposure, we secured the torso of the animal to a holder using a thin cotton cloth and Velcro straps. For all experiments, we measured the incident, intracranial, and carotid-artery pressures at the locations shown in the schematic.
FIGURE 2
FIGURE 2
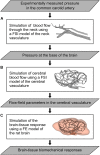
Flowchart of the computational models and simulations performed to characterize the indirect mechanism of blast injury in a rat. (A) Fluid-structure interaction (FSI) model of the neck vasculature developed to simulate the blood flow through the neck and to characterize the pressure propagation in the neck vessels (i.e., from the common carotid artery to the internal carotid artery) for a torso-only blast condition. (B) FSI model of the cerebral vasculature developed to simulate the cerebral blood flow and to characterize the flow-field parameters (e.g., the mass flow rate, pressure, velocity, and wall shear stress) in the cerebral vessels for torso-only blast and blast-free (i.e., normotensive) conditions. (C) Finite element (FE) model of the rat brain developed to predict brain-tissue biomechanical responses (e.g., the strain) resulting from a torso-only exposure.
FIGURE 3
FIGURE 3
Boundary conditions for the fluid-structure interaction (FSI) simulations of the neck and cerebral blood flow in a rat. (A) Boundary conditions defined in the finite element (FE) and computational fluid dynamics (CFD) models of the neck vasculature (left panel) and cerebral vasculature (right panel) and used in their corresponding FSI simulations. (B) Temporal pressure profiles used as inlet boundary conditions for torso-only blast (left and center panels) and blast-free [right panel (Cosson et al., 2007)] conditions. BA, basilar artery; CCA, common carotid artery; CoW, circle of Willis; ECA, external carotid artery; ICA, internal carotid artery; JV, jugular vein; VA, vertebral artery.
FIGURE 4
FIGURE 4
Temporal profiles of the incident, intracranial, and carotid-artery pressures for the torso-only blast-exposure experiments at incident blast overpressures of (A) 70 kPa and (B) 130 kPa. The solid lines and shaded areas represent the mean (n = 8) and one standard deviation, respectively. (Because the standard deviations are small, they may not be visible).
FIGURE 5
FIGURE 5
Comparison of the volumetric flow rate in different vessels of the cerebral vasculature of a rat predicted by the fluid-structure interaction model for the blast-free, normotensive condition with experimental data (Schierling et al., 2009). The solid circles and error bars represent the mean (n = 10) and two standard errors of the mean, respectively, averaged over one cardiac cycle. The asterisks indicate model predictions. ACA, anterior cerebral artery; BA, basilar artery; ICA, internal carotid artery; PCA, posterior cerebral artery.
FIGURE 6
FIGURE 6
Differences in the peak wall shear stress in the cerebral vasculature of a rat brain between the blast-free, normotensive condition and the torso-only blast conditions. For each pair of conditions, we computed their differences by first determining the peak wall shear stress for each condition at each shell element of the cerebral vasculature (over one cardiac cycle for the blast-free condition and over the blast-exposure simulation time for the torso-only conditions), and then subtracted them. A, anterior; L, left; P, posterior; R, right.
FIGURE 7
FIGURE 7
Differences in the peak maximum principal strain in the brain tissue of a rat between the blast-free, normotensive condition and the torso-only blast conditions. The differences maps are for the coronal plane at the anterior, middle, and posterior regions of the rat brain. For each pair of conditions, we computed their differences by first determining the maximum strain for each condition at each tetrahedral element of the rat brain (over one cardiac cycle for the blast-free condition and over the blast-exposure simulation time for the torso-only conditions), and the subtracted them.

References

    1. Alay E., Skotak M., Misistia A., Chandra N. (2018). Dynamic loads on human and animal surrogates at different test locations in compressed-gas-driven shock tubes. Shock Waves 28 51–62. 10.1007/s00193-017-0762-4 - DOI
    1. Ambrosi D., Quarteroni A., Rozza G. (2012). Modeling of Physiological Flows. Milan: Springer.
    1. Aoki T., Nishimura M., Matsuoka T., Yamamoto K., Furuyashiki T., Kataoka H., et al. (2011). PGE(2) -EP(2) signalling in endothelium is activated by haemodynamic stress and induces cerebral aneurysm through an amplifying loop via NF-κB. Br. J. Pharmacol. 163 1237–1249. 10.1111/j.1476-5381.2011.01358.x - DOI - PMC - PubMed
    1. Assari S., Laksari K., Barbe M., Darvish K. (2013). “Cerebral blood pressure rise during blast exposure in a rat model of blast-induced traumatic brain injury,” in Proceedings of the ASME 2013 International Mechanical Engineering Congress and Exposition, (V03AT03A016) (San Diego, CA: ).
    1. Bain A. C., Meaney D. F. (2000). Tissue-level thresholds for axonal damage in an experimental model of central nervous system white matter injury. J. Biomech. Eng. 122 615–622. 10.1115/1.1324667 - DOI - PubMed