

Semi-automated PIRADS scoring via mpMRI analysis
- PMID: 33392358
- PMCID: PMC7769753
- DOI: 10.1117/1.JMI.7.6.064501
Semi-automated PIRADS scoring via mpMRI analysis
Abstract
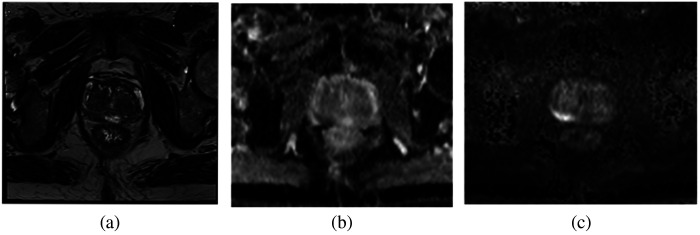
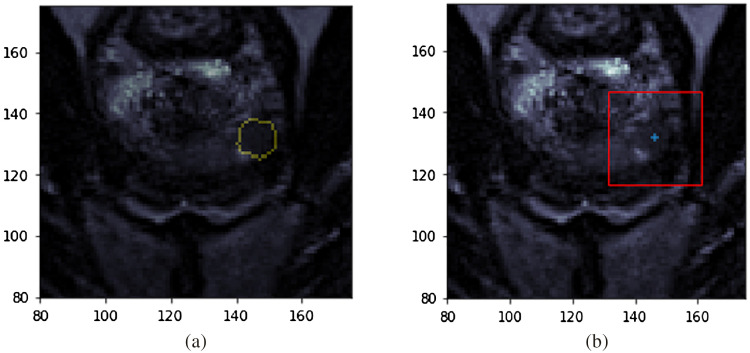
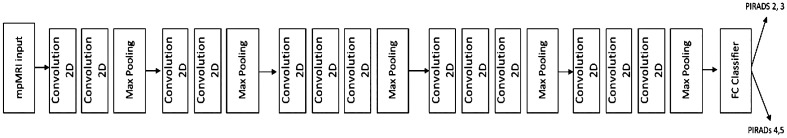
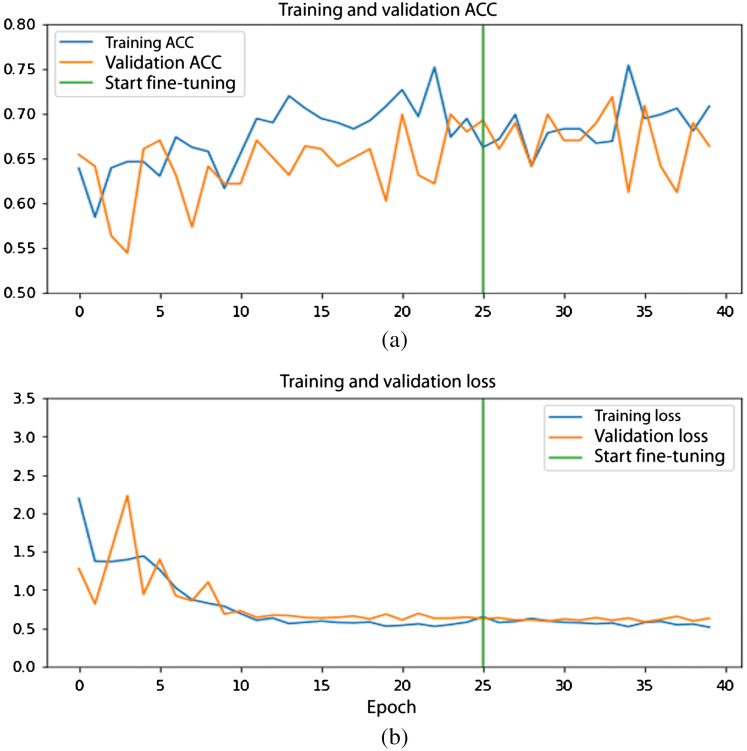
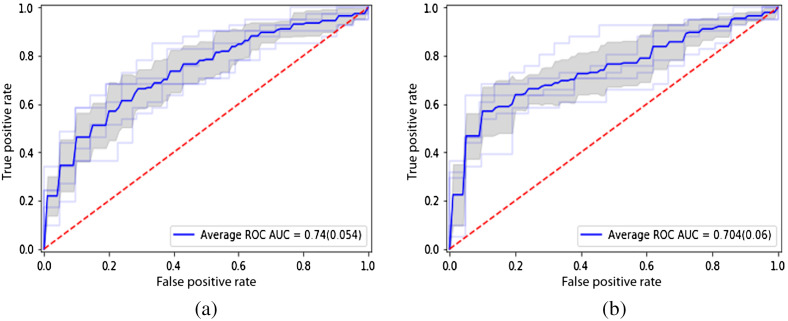
Purpose: Prostate cancer (PCa) is the most common solid organ cancer and second leading cause of death in men. Multiparametric magnetic resonance imaging (mpMRI) enables detection of the most aggressive, clinically significant PCa (csPCa) tumors that require further treatment. A suspicious region of interest (ROI) detected on mpMRI is now assigned a Prostate Imaging-Reporting and Data System (PIRADS) score to standardize interpretation of mpMRI for PCa detection. However, there is significant inter-reader variability among radiologists in PIRADS score assignment and a minimal input semi-automated artificial intelligence (AI) system is proposed to harmonize PIRADS scores with mpMRI data. Approach: The proposed deep learning model (the seed point model) uses a simulated single-click seed point as input to annotate the lesion on mpMRI. This approach is in contrast to typical medical AI-based approaches that require annotation of the complete lesion. The mpMRI data from 617 patients used in this study were prospectively collected at a major tertiary U.S. medical center. The model was trained and validated to classify whether an mpMRI image had a lesion with a PIRADS score greater than or equal to PIRADS 4. Results: The model yielded an average receiver-operator characteristic (ROC) area under the curve (ROC-AUC) of 0.704 over a 10-fold cross-validation, which is significantly higher than the previously published benchmark. Conclusions: The proposed model could aid in PIRADS scoring of mpMRI, providing second reads to promote quality as well as offering expertise in environments that lack a radiologist with training in prostate mpMRI interpretation. The model could help identify tumors with a higher PIRADS for better clinical management and treatment of PCa patients at an early stage.
Keywords: Prostate Imaging-Reporting and Data System; deep learning; medical image analysis; multiparametric magnetic resonance imaging; prostate cancer.
© 2020 Society of Photo-Optical Instrumentation Engineers (SPIE).
Figures
References
-
- Walsh P., “Guide to surviving prostrate cancer,” 4th ed., Grand Central Life and Style; (2018).
