. 2020;5(1):100.
doi: 10.1007/s41109-020-00344-5. Epub 2020 Dec 29.

Network model and analysis of the spread of Covid-19 with social distancing

Affiliations

Network model and analysis of the spread of Covid-19 with social distancing

Parul Maheshwari et al. Appl Netw Sci. 2020.

Abstract

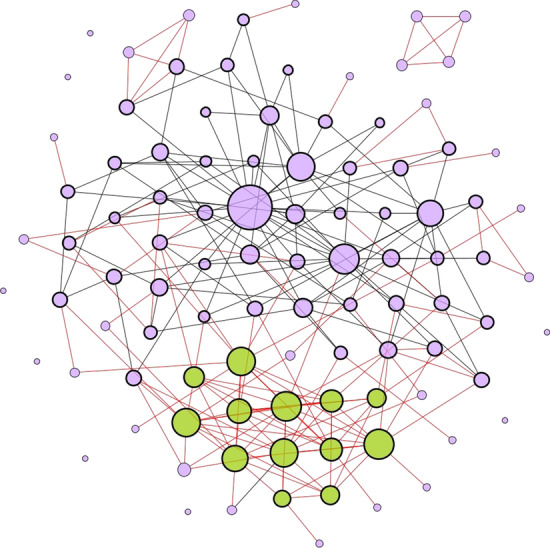
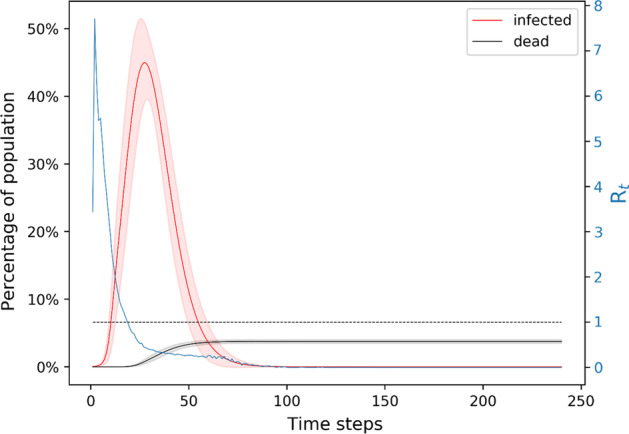
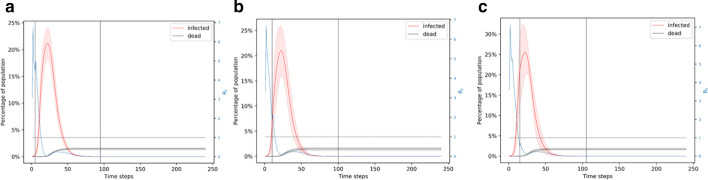
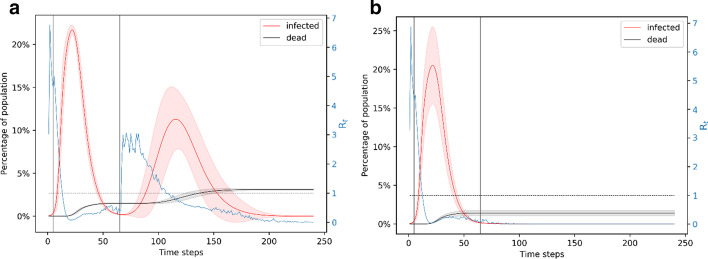
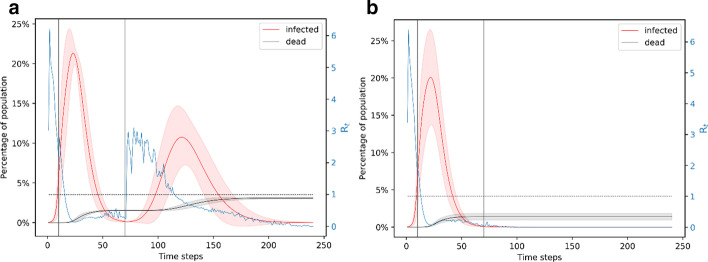
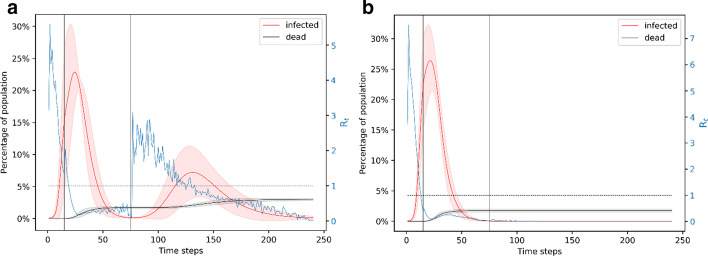
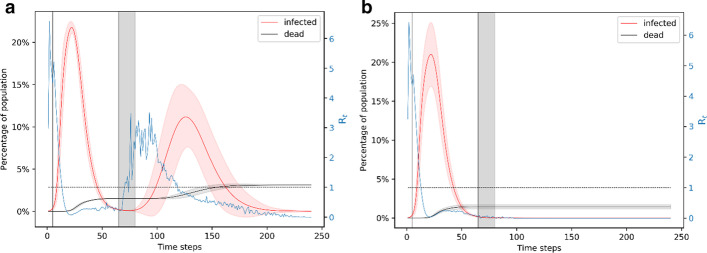
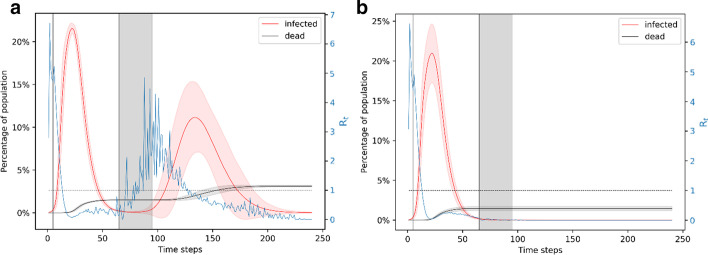
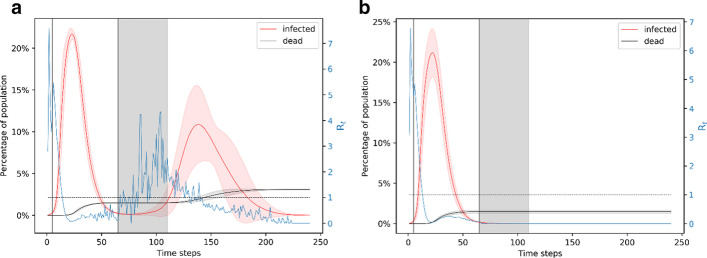
The first mitigation response to the Covid-19 pandemic was to limit person-to-person interaction as much as possible. This was implemented by the temporary closing of many workplaces and people were required to follow social distancing. Networks are a great way to represent interactions among people and the temporary severing of these interactions. Here, we present a network model of human-human interactions that could be mediators of disease spread. The nodes of this network are individuals and different types of edges denote family cliques, workplace interactions, interactions arising from essential needs, and social interactions. Each individual can be in one of four states: susceptible, infected, immune, and dead. The network and the disease parameters are informed by the existing literature on Covid-19. Using this model, we simulate the spread of an infectious disease in the presence of various mitigation scenarios. For example, lockdown is implemented by deleting edges that denote non-essential interactions. We validate the simulation results with the real data by matching the basic and effective reproduction numbers during different phases of the spread. We also simulate different possibilities of the slow lifting of the lockdown by varying the transmission rate as facilities are slowly opened but people follow prevention measures like wearing masks etc. We make predictions on the probability and intensity of a second wave of infection in each of these scenarios.

Keywords: COVID-19; Epidemic spreading; Network science; Reproduction number; SIR model; Social network.


Conflict of interest statement

Competing interestsThe authors declare that they have no conflict of interest.

Figures

Fig. 1
Fig. 1
Illustration of the result of the network generation method on a population of 100 individuals. The edges represent interactions within families, workplaces, and social interaction. The red color edges are the ones that are preserved in the lockdown while the black color edges are deleted. The 4-cliques with red edges, as well as a fraction of 3-cliques with red edges represent families. Node size denotes the degree of the node with isolated nodes having the smallest size; this illustrates that the network contains high-degree hubs. The nodes that have a thick border denote the people who are working. Nodes in green color denote essential workers. The cluster of green nodes shows a high interaction among essential workers
Fig. 2
Fig. 2
The degree distribution of a network generated with 10,000 nodes shows two peaks representing the combination of workplace interactions. The first peak at k ~ 6 is due to the scale-free network of non-essential workplace interactions and the second peak at k ~ 25 is coming from the random network of essential workplace interaction. The high-degree tail represents the hubs, i.e., the individuals who have many interactions, who could therefore act as super-spreaders if infected
Fig. 3
Fig. 3
Unmitigated spread of the disease in the network model. The plot shows for each time step the number of nodes in the network that are infected in red color and the number of nodes that are dead in black color. The reproduction number is shown in blue with the scale shown on the right y-axis. The x-axis gives the timesteps. The shaded area around the line plots is marked by the standard deviation obtained by running the simulation ~ 1000 times. The disease completes its course in ~ 80 days, infecting about 70% of the population
Fig. 4
Fig. 4
Simulation of the 90-day lockdown cases. a Lockdown is from day 5 to day 95. b Lockdown is from day 10 to day 100. c Lockdown is from day 15 to day 105. A 90-day lockdown prevents a second wave of infection. Comparing panels A and C, we note that a later lockdown leads to a higher peak and more deaths. In all the cases, the peak in the number of infections is foreshadowed by a peak in the reproduction number
Fig. 5
Fig. 5
Simulation of the 60-day lockdown from day 5 to day 65. a Representation of the ~ 40% of simulation results where there is a second wave of infection when the lockdown is from day 5 to day 65. The effective reproduction number increases dramatically after the end of the lockdown, foreshadowing the second peak of the infection. b Representation of the ~ 24% simulation results where there is no second wave of infection for the lockdown period of day 5 to day 65. The effective reproduction number stays below 1 after the lockdown is lifted
Fig. 6
Fig. 6
Simulation of the 60-day lockdown from day 10 to day 70. a Representation of the ~ 33% of simulations that have a second wave of infection for the day 10 to day 70 lockdown. Similar to the day 5 to day 65 lockdown scenario, there is a dramatic peak in the reproduction number after the lockdown is lifted on day 70, foreshadowing a second wave of infection. b Representation of the ~ 39% of simulations that have only one wave of infection for the day 10 to day 70 lockdown
Fig. 7
Fig. 7
Simulation of the 60-day lockdown from day 15 to day 75. a Representation of the ~ 16% of simulations that have two waves of infection for the day 15 to day 75 lockdown. The peak in the reproduction number after day 75 foreshadows a second wave of infection. Comparing with Figs. 5 and 6, we note that the second wave of infection is less intense when the lockdown starts later. b Representation of the ~ 58% of simulations that have only one wave of infection for the day 15 to day 75 lockdown
Fig. 8
Fig. 8
Simulation of the case of a 15-day phasing out of the lockdown. A. Representation of the ~ 19% of simulation results that have a second wave of infection if the lockdown is from day 5 to day 65 and complete normalcy resumes on day 80. The effective reproduction number starts to increase during the phasing out of the mitigation measures. B. Representation of the ~ 43% of simulation results that have only one wave of infection if the lockdown is from day 5 to day 65 and complete normalcy resumes on day 80. Comparing with Fig. 5, we note that a gradual phasing-out of the lockdown reduces the chances of a second wave of infection
Fig. 9
Fig. 9
Simulation of the case of phasing out of lockdown for 30 days. a Representation of the ~ 6% of simulation results that have a second wave of infection for the lockdown from day 5 to day 65 and complete normalcy resumes on day 95. b Representation of the ~ 57% of simulation results that have only one wave of infection for the lockdown from day 5 to day 65 and complete normalcy resumes on day 95. An increase in the duration of the phasing out period from 15 (see Fig. 8) to 30 leads to a significant reduction in the probability of a second wave of infection
Fig. 10
Fig. 10
Simulation of the case of phasing out of lockdown for 45 days. a Representation of the ~ 3% of simulation results that have a second wave of infection for the lockdown from day 5 to day 65 and complete normalcy resumes on day 110. b Representation of the ~ 59% of simulation results that have only one wave of infection for the lockdown from day 5 to day 65 and complete normalcy resumes on day 110. The 45-day phasing-out period after the lockdown is lifted makes a second wave of infection very unlikely

Similar articles

Cited by

References

    1. Aleta A et al (2020) Modeling the impact of social distancing, testing, contact tracing and household quarantine on second-wave scenarios of the COVID-19 epidemic. medRxiv - PMC - PubMed
    1. Barabási A-L, Albert R. Emergence of scaling in random networks. Science. 1999;286(5439):509–512. doi: 10.1126/science.286.5439.509. - DOI - PubMed
    1. Block P, et al. Social network-based distancing strategies to flatten the COVID-19 curve in a post-lockdown world. Nat Hum Behav. 2020;2020:1–9. - PubMed
    1. Chen Y-C et al (2020) A time-dependent SIR model for COVID-19 with undetectable infected persons. Preprint arXiv:2003.00122 - PMC - PubMed
    1. Chinazzi M, et al. The effect of travel restrictions on the spread of the 2019 novel coronavirus (COVID-19) outbreak. Science. 2020;368(6489):395–400. doi: 10.1126/science.aba9757. - DOI - PMC - PubMed

LinkOut - more resources