. 2020 Nov;1(3):258-273.
doi: 10.1158/2643-3230.BCD-20-0132. Epub 2020 Sep 15.

Revealing the impact of structural variants in multiple myeloma

Affiliations

Revealing the impact of structural variants in multiple myeloma

Even H Rustad et al. Blood Cancer Discov. 2020 Nov.

Abstract

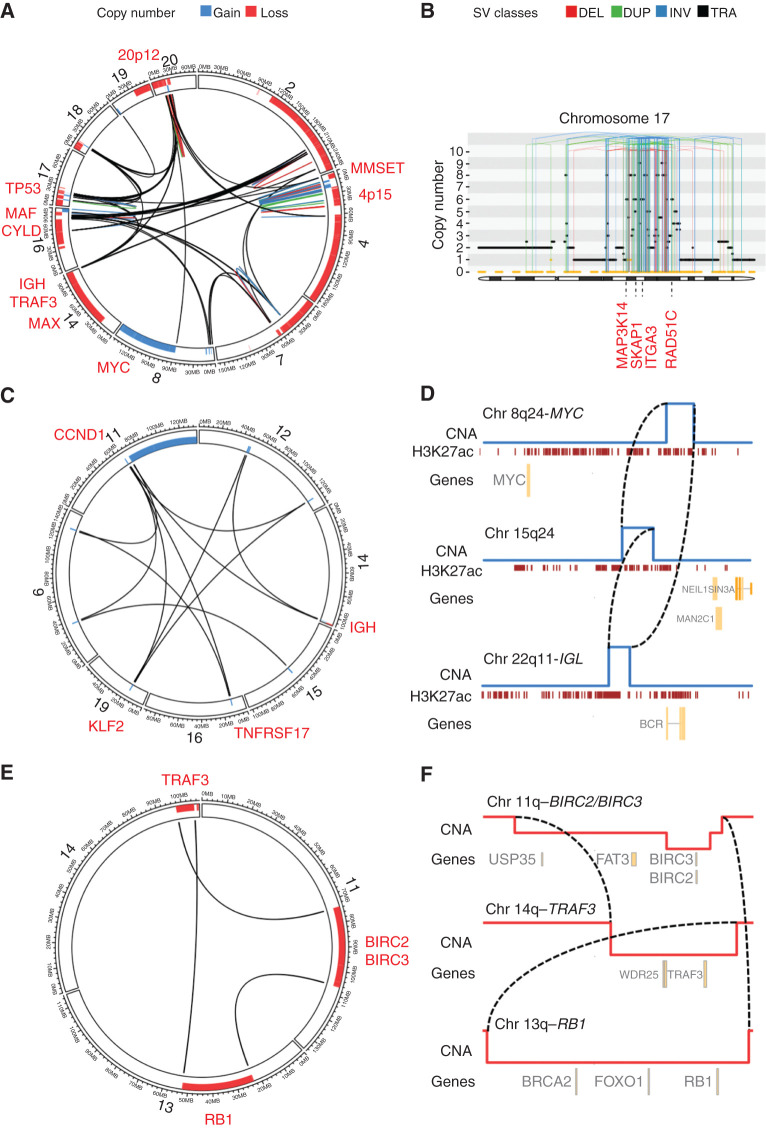
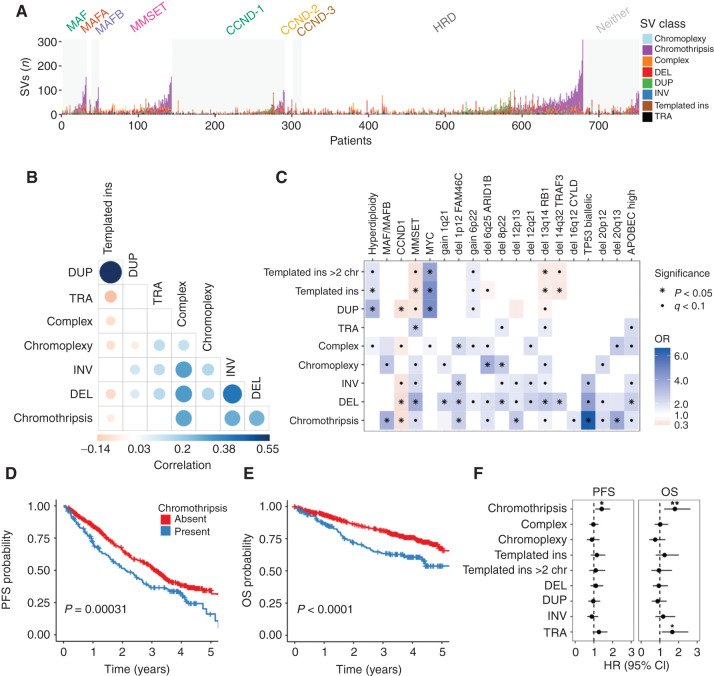
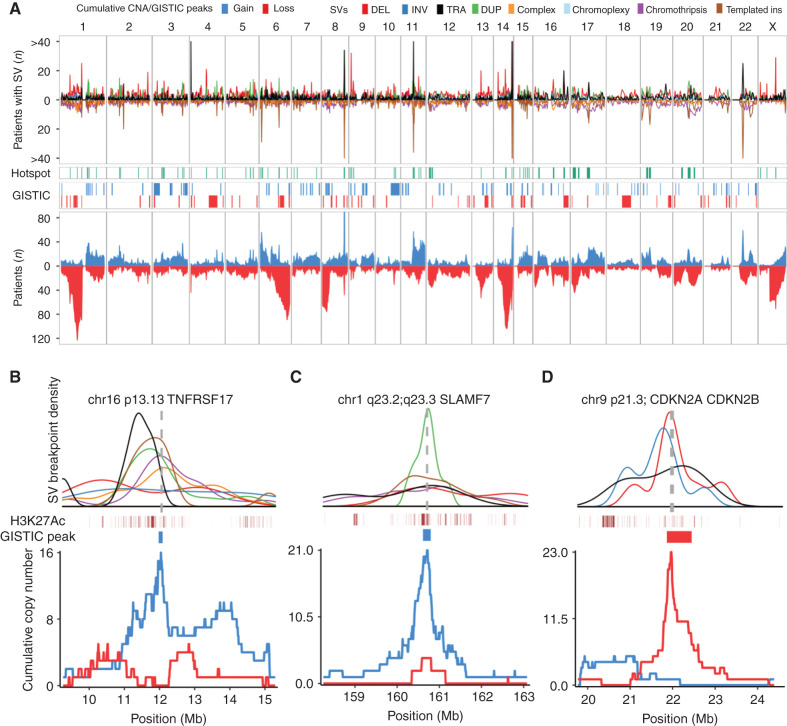
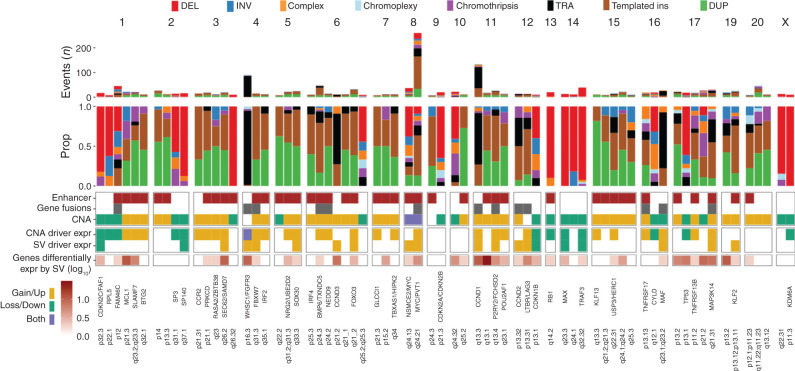
The landscape of structural variants (SVs) in multiple myeloma remains poorly understood. Here, we performed comprehensive analysis of SVs in a large cohort of 752 multiple myeloma patients by low coverage long-insert whole genome sequencing. We identified 68 SV hotspots involving 17 new candidate driver genes, including the therapeutic targets BCMA (TNFRSF17), SLAMF and MCL1. Catastrophic complex rearrangements termed chromothripsis were present in 24% of patients and independently associated with poor clinical outcomes. Templated insertions were the second most frequent complex event (19%), mostly involved in super-enhancer hijacking and activation of oncogenes such as CCND1 and MYC. Importantly, in 31% of patients two or more seemingly independent putative driver events were caused by a single structural event, demonstrating that the complex genomic landscape of multiple myeloma can be acquired through few key events during tumor evolutionary history. Overall, this study reveals the critical role of SVs in multiple myeloma pathogenesis.

Keywords: chromoplexy; chromothripsis; hotspots; multiple myeloma; structural variants; templated insertion.


Conflict of interest statement

Conflict of interest statement No conflict of interests to declare.

Figures

Figure 1.
Figure 1.
Complex SV classes in multiple myeloma. A, Chromothripsis involving IGH and nine recurrent drivers across 10 different chromosomes (sample MMRF_1890_1_BM). B, Chromothripsis causing high-level focal gains on chromosome 17 (sample MMRF_2330_1_BM). The horizontal black line indicates total copy number; the dashed orange line indicates minor copy number. Vertical lines represent SV breakpoints, color-coded by SV class. Selected overexpressed genes (Z-score >2) are annotated in red, including the established multiple myeloma driver gene MAP3K14 and RAD51C, an oncogene commonly amplified in breast cancer (ref. ; six copies). C, Templated insertion involving seven different chromosomes, causing a canonical IGH-CCND1 translocation and involving at least two additional drivers in the same event (i.e., KLF2 and TNFRSF17; sample MMRF_1677_1_BM). D, Simpler templated insertion cycle (brown lines), involving IGL, MYC, and a hotspot on chromosome 15q24 (sample MMRF_1550_1_BM). Copy-number profile shown in blue, with active enhancers below in brown (H3K27Ac). E, Chromoplexy involving chromosomes 11, 13, and 14, simultaneously causing deletion of key tumor suppressor genes on each chromosome (sample MMRF_2194_1_BM). F, Zooming in on the translocations and associated large deletions, which make up the chromoplexy event depicted as a Circos plot in C; (sample MMRF_2194_1_BM). The Circos plots in panels A, C, and E each show the SV breakpoints of a single complex SV (colored lines; legend above panels), with bars around the plot circumference indicating copy-number changes (red, loss; blue, gain).
Figure 2.
Figure 2.
Distribution and clinical impact of SVs in multiple myeloma. A, Stacked bars show the genome-wide burden of each SV class (color) in each patient (x-axis), grouped by primary molecular subgroup. B, Pairwise associations between the number of SVs of each class across patients in the CoMMpass cohort (n = 752). Color and size of points are determined by the magnitude of positive (blue) and negative (red) Spearman correlation coefficients, plotted only where q < 0.1. C, Association between SV classes and molecular features in the CoMMpass cohort (n = 752). OR for each pair of variables was estimated by Fisher exact test. Statistical significance is indicated by black dots (FDR < 0.1) and asterisks (Bonferroni–Holm adjusted P values < 0.05). For all templated insertions, templated insertions involving >2 chromosomes, chromothripsis, chromoplexy, and unspecified complex events, we compared patients with 0 versus 1 or more events. The remaining SVs were considered by their simple class (i.e., DUP, DEL, TRA, and INV), comparing the 4th quartile SV burden with the lower three quartiles. Kaplan–Meier plots for PFS (D) and OS (E) in patients with and without chromothripsis (shown in blue and red, respectively). F, HR for PFS and OS by SV type, estimated using multivariate Cox regression. Line indicates 95% CI from multivariate Cox regression models, with statistically significant features indicated by asterisks (*, P < 0.05; **, P < 0.01). The multivariate models included all SV variables (as defined above) as well the following clinical and molecular features: age, sex, Eastern Cooperative Oncology Group (ECOG) status, International Staging System (ISS) stage, induction regimen, gain 1q21, del FAM46C, del TRAF3, TP53 status, del RB1, high APOBEC mutational burden, hyperdiploidy, and canonical translocations involving CCND1, MMSET, MAF, MAFA, MAFB, and MYC (Supplementary Fig. S2).
Figure 3.
Figure 3.
SVs associated with recurrent translocations, copy-number changes, and altered gene expression. A, Relative contribution (y-axis) of simple and complex SV classes to canonical translocations (TRA) involving IGH as well as translocations of MYC with canonical and noncanonical partners (x-axis). “Non-IG” includes MYC translocations that do not involve IGH, IGL, or IGK. B, Gene expression of canonical and noncanonical partners of translocations involving IGH (left), either light chain gene locus (center), or MYC (right). Each point represents a sample, colored by the translocation class involved or absence of a translocation (gray). Boxplots shows the median and IQR of expression across all patients, with whiskers extending to 1.5 * IQR. The templated insertion of IGH and MAF with low expression was part of a multichromosomal event involving and causing the overexpression of CCND1. TPM, trancripts per million. C, Structural basis of established multiple myeloma CNA drivers, showing the relative contribution of whole-arm events and CNAs associated with a specific SV. Intrachromosomal events without a clear causal SV were classified as “unknown” (7% of CNAs overall). D, Impact of copy number and SV involvement on normalized gene expression values (Z-scores), estimated by multivariate linear regression. Estimates with 95% CI for each parameter are shown. Pooled analysis was performed for all expressed genes on autosomes across all patients, excluding structural events involving immunoglobulin loci.
Figure 4.
Figure 4.
Genome-wide distribution of structural variation breakpoints and hotspots. A, Top, genome-wide density of SV breakpoints shown separately for each class (legend above figure); simple classes are above the x-axis and complex classes below. Middle, distribution of SV hotspots (green) and recurrent copy-number changes (red/blue) identified by the GISTIC algorithm. Bottom, all copy number-changes caused by SV breakpoints, showing cumulative plots for gains (blue) and losses (red). B–D, Zooming in on three SV hotspots and showing the breakpoint density of relevant SV classes (colors indicated in legend above A) around the hotspot; active enhancers (H3K27Ac) and supporting GISTIC peaks (middle); and cumulative copy number (bottom). The SV density plots are annotated with the location of key driver genes as vertical gray dashed lines. B, Gain-of-function hotspot centered on TNFRSF17 (BCMA), dominated by highly clustered templated insertions, associated with focal copy-number gain of TNFRSF17. C, Gain-of-function hotspot involving four genes in the Signaling Lymphocyte Activation Molecule (SLAM) family of immunomodulatory receptors, including the gene encoding the mAb target SLAMF7. D, Deletion hotspot associated with copy-number loss centered on the cyclin dependent kinase inhibitors CDKN2A/CDKN2B.
Figure 5.
Figure 5.
Summary of SV hotspots. Summary of all 68 SV hotspots, showing (from the top) absolute and relative contribution of SV classes within 100 kb of the hotspot; involvement of active enhancers in multiple myeloma, and presence of putative driver gene fusions and copy-number changes; differential expression of putative driver genes by copy-number changes and/or SV involvement by linear regression; total number of genes in each hotspot differentially expressed by SV involvement (FDR < 0.1) after adjustment for copy-number changes; and known and candidate driver genes.
Figure 6.
Figure 6.
Templated insertions and chromothripsis exemplify highly clustered versus scattered breakpoint patterns. A, Distribution of templated insertions (top) and chromothripsis (bottom) across the genome, with each displaying SV breakpoint density above the x-axis and SV-associated cumulative copy-number changes below. Results from templated insertion and chromothripsis-specific hotspot analysis drawn as black bars at y = 20. Hotspots from the main hotspot analysis that contained six or more templated insertions are drawn in green. Key putative driver genes involved by hotspots are annotated. Numbers are annotated where peaks extend outside of the plotting area. B, The probability that a given SV breakpoint belonging to each class will fall within a hotspot region, expressed as ORs with 95% CI from logistic regression analysis where single deletions were used as the reference level. C, The proportion of focal gains (<3 Mb) associated with each SV class, divided by the number of copies acquired relative to the baseline (x-axis). D, The probability that focal gains displayed in C contain a multiple myeloma super-enhancer, expressed as OR with 95% CI from a logistic regression model adjusted for copy number. Asterisks in B and D indicate statistical significance (**, P < 10−8; *, P < 0.01).
Figure 7.
Figure 7.
Two or more putative driver alterations caused by a single SV. Putative driver alterations recurrently involved by multi-driver events (involved in 5 or more patients). A, Number of multidriver events involving each gene colored by the SV class responsible. B, Heatmap showing the number of times each pair of putative drivers co-occurs. Co-occurrence was defined by at least two drivers on different chromosomal copy-number segments caused by the same event. Axis legends are colored according to the gain-of-function (blue) or loss-of-function (red) status of each driver.

Comment in

References

    1. Hadi K, Yao X, Behr JM, Deshpande A, Xanthopoulakis C, Rosiene J, et al. Novel patterns of complex structural variation revealed across thousands of cancer genome graphs. Cell 2020;183:P197–210.e32. - PMC - PubMed
    1. Mitchell TJ, Turajlic S, Rowan A, Nicol D, Farmery JHR, O'Brien T, et al. Timing the landmark events in the evolution of clear cell renal cell cancer: TRACERx renal. Cell 2018;173:611–23.e17. - PMC - PubMed
    1. Glodzik D, Purdie C, Rye IH, Simpson PT, Staaf J, Span PN, et al. Mutational mechanisms of amplifications revealed by analysis of clustered rearrangements in breast cancers. Ann Oncol 2018;29:2223–31. - PMC - PubMed
    1. Li Y, Roberts ND, Wala JA, Shapira O, Schumacher SE, Kumar K, et al. Patterns of somatic structural variation in human cancer genomes. Nature 2020;578:112–21. - PMC - PubMed
    1. Lee JJ, Park S, Park H, Kim S, Lee J, Lee J, et al. Tracing oncogene rearrangements in the mutational history of lung adenocarcinoma. Cell 2019;177:1842–57. - PubMed

Publication types