Observational Study
. 2021 Mar;112(3):1235-1250.
doi: 10.1111/cas.14792. Epub 2021 Jan 22.

BACH2-mediated FOS confers cytarabine resistance via stromal microenvironment alterations in pediatric ALL

Affiliations
Observational Study

BACH2-mediated FOS confers cytarabine resistance via stromal microenvironment alterations in pediatric ALL

Han Zhang et al. Cancer Sci. 2021 Mar.

Abstract

Acute lymphoblastic leukemia (ALL) is an aggressive hematological cancer that mainly affects children. Relapse and chemoresistance result in treatment failure, underlining the need for improved therapies. BTB and CNC homology 2 (BACH2) is a lymphoid-specific transcription repressor recognized as a tumor suppressor in lymphomas, but little is known about its function and regulatory network in pediatric ALL (p-ALL). Herein, we found aberrant BACH2 expression at new diagnosis not only facilitated risk stratification of p-ALL but also served as a sensitive predictor of early treatment response and clinical outcome. Silencing BACH2 in ALL cells increased cell proliferation and accelerated cell cycle progression. BACH2 blockade also promoted cell adhesion to bone marrow stromal cells and conferred cytarabine (Ara-C)-resistant properties to leukemia cells by altering stromal microenvironment. Strikingly, we identified FOS, a transcriptional activator competing with BACH2, as a novel downstream target repressed by BACH2. Blocking FOS by chemical compounds enhanced the effect of Ara-C treatment in both primary p-ALL cells and pre-B-ALL-driven leukemia xenografts and prolonged the survival of tumor-bearing mice. These data highlight an interconnected network of BACH2-FOS, disruption of which could render current chemotherapies more effective and offer a promising therapeutic strategy to overcome Ara-C resistance in p-ALL.

Keywords: BACH2; acute lymphoblastic leukemia; bone marrow microenvironment; childhood; cytarabine.


Conflict of interest statement

The authors declare no conflict of interest.

Figures

FIGURE 1
FIGURE 1
Expression feature of BACH2 levels in pediatric acute lymphoblastic leukemia (p‐ALL) from microarray data. A, BACH2 mRNA levels were downregulated in bone marrow (BM) cells from p‐ALL at new diagnosis (ND) (n = 284) compared with CD19+CD10+ BM cells from healthy donors (n = 4). B, BM cells from T cell ALL (T‐ALL) (n = 46) contained lower levels of BACH2 than BM cells from B cell ALL (B‐ALL) at ND (n = 238). C, BM cells from B‐ALL with BCR‐ABL1 fusion gene at ND (n = 16) contained lower levels of BACH2 compared with those from B‐ALL without BCR‐ABL1 fusion gene (n = 222). D, BM cells from TCF3‐PBX1 + B‐ALL at ND (n = 22) contained higher BACH2 levels than those from B‐ALL without TCF3‐PBX1 fusion gene (n = 216). E, Comparison of BACH2 levels in BM among different subtypes. B‐ALL patients with lower BACH2 levels in BM became minimal residual disease positive (MRD+) at d19 from diagnosis (F) and remained MRD+ at day 46 (G). H, Inverse correlation between %MRD and BACH2 levels in BM from relapse (RE) samples at d36 (M1 patients). Data are shown as the mean ± SEM
FIGURE 2
FIGURE 2
Decreased BACH2 levels are associated with clinical outcome in pediatric acute lymphoblastic leukemia (p‐ALL). A, BACH2 mRNA levels were lower in p‐ALL samples at new diagnosis (ND) (n = 12) compared with samples from patients with immune thrombocytopenic purpura (ITP) (n = 2). Each condition was run in triplicate with the values normalized to GAPDH. Data are shown as the mean ± SEM. B, Leukemic cells in T cell ALL (T‐ALL) and B/T cell mixed‐phenotype acute leukemia (B/T MPAL) (n = 2) contained lower levels of BACH2 than those in B cell ALL (B‐ALL) (n = 10). Data are shown as the mean ± SEM. C, BACH2 levels in T‐ALL and B/T MPAL. D, BACH2 levels in B‐ALL. The red asterisk indicates patient #12 (Pt #12) with the lowest levels of BACH2. E, Immunoblots of BACH2 in different subtypes of p‐ALL with one ITP sample as a negative control. GAPDH was used as a loading control. BM, bone marrow
FIGURE 3
FIGURE 3
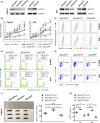
Silencing BACH2 increases cell proliferation and accelerates cell cycle progression. A, The knockdown and overexpressed efficiency of BACH2 (BACH2KD and BACH2OE) in Nalm‐6 (left) and Reh (right) cells were validated using immunoblots respectively with a nonsilencing shRNA plasmid (BACH2Con) as a negative control. GAPDH was used as a loading control. B, Viable cells were counted in manipulated Nalm‐6 and Reh cells. C, Manipulated acute lymphoblastic leukemia (ALL) cells were stained with PKH26 fluorescent dye which was analyzed using flow cytometry (FCM). Representative FCM analyses at 0, 2, 4, and 6 are shown. D, Representative cell‐cycle distribution of manipulated Nalm‐6 and Reh cells. E, Representative intracellular pulse staining of BrdU in manipulated Nalm‐6 and Reh cells. F, BACH2KD‐2, BACH2OE, or BACH2Con Nalm‐6 cells were intravenously injected into mice (n = 3). Xenografts were humanely sacrificed 7 d post transplantation, and the spleens (SPs) were isolated and photographed against a ruler (left). The sizes of the SPs in each group were measured (right). Data are shown as the mean ± SEM. NS, not significant; *P < .05 (vs control group). G, Human CD19+ (hCD19+) cells were isolated from SP and bone marrow (BM) using anti‐hCD19‐MicroBeads, and the % of hCD19+ cells in each organ was calculated. Data are presented as the mean ± SEM. *P < .05; **P < .01 (vs control xenografts)
FIGURE 4
FIGURE 4
Decreased BACH2 expression confers chemo‐resistant properties to pediatric acute lymphoblastic leukemia (p‐ALL). A, Children with ALL from the prednisolone‐resistant group (n = 27) had lower BACH2 levels than those from the prednisolone‐sensitive group (n = 66). B, Children with B cell ALL (B‐ALL) in the prednisolone‐resistant group (n = 20) had lower BACH2 levels than those in the prednisolone‐sensitive group (n = 55). C, Leukemia cell lines with lower BACH2 expression (n = 11) were more resistant to Ara‐C compared with those with higher BACH2 levels (n = 9). Data are shown as the mean ± SEM. D, Manipulated Nalm‐6 and Reh cells were treated with or without Ara‐C treatment, and cell survival was detected by staining cells with Annexin V/7‐AAD. Representative flow cytometry (FCM) analyses in Nalm‐6 cells are shown. E, The % population of apoptotic cells in each group is shown as the mean ± SD from two independent experiments. *P < .05; **P < .01; ***P < .001 (vs control group). w/, with; w/o, without
FIGURE 5
FIGURE 5
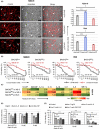
BACH2 silencing promotes cell adhesion and Ara‐C resistance by altering stromal microenvironment. A, Cells were stained with PKH26 prior to seeding onto a pre‐established monolayer of HS‐5 bone marrow stromal cells (BMSCs). Representative microscopic images of adherent manipulated Nalm‐6 cells are shown in a coculture setting. Scale bar, 50 μm. The arrows point to the representative leukemic cells adhered to BMSCs (left). PKH26 dye intensity in manipulated Nalm‐6 and Reh cells were normalized to the control cells. Data are shown as the mean ± SD from two independent experiments (right). B, Manipulated Nalm‐6 and Reh cells were cultured in complete RPMI1640 media or coculture media upon treatment of Ara‐C for 48 h. Cell viability was determined using MTT assays. IC50 values of Ara‐C for BACH2Con or BACH2KD‐2 cells are indicated, with red representing cells in coculture media (upper) and black representing cells in complete RPMI1640 media (lower). C, Relative mean fluorescent intensity (MFI) of multiple cytokines in coculture media. The fold change in expression compared with the lowest value is indicated by the color intensity, with green representing reduced expression and red representing elevated expression. w/, with. D, Primary BM cells from two p‐ALL patients (Pt #5 and Pt #8) or BACH2KD‐2 Nalm‐6 cells were stained with PKH26 prior to seeding onto a pre‐established monolayer of HS‐5 BMSCs. PKH26‐stained cells were allowed to adhere for 4 h with neutralizing antibodies of IL‐6 (0.5 μg/mL), IL‐8, or GM‐CSF (1 μg/mL). IgG1 antibody (1 μg/mL) was used as a negative control. PKH26 dye intensity of leukemic cells was normalized to those without neutralizing antibodies in each group. E, Primary cells or BACH2KD‐2 Nalm‐6 cells were treated with Ara‐C (20 nmol/L) for 48 h with neutralizing antibodies of IL‐6 (0.5 μg/mL), IL‐8, or GM‐CSF (1 μg/mL). IgG1 antibody (1 μg/mL) was used as a negative control. Cell viability was determined using MTT assays. Data are normalized to nontreated control cells and shown as the mean ± SD from three independent experiments. *P < .05; **P < .01; ***P < .001 (vs control group)
FIGURE 6
FIGURE 6
FOS is a downstream target repressed by BACH2 expression in pre‐B leukemic cells. A, Correlation analyses of BACH2 and FOS expression based on microarray data in B cell acute lymphoblastic leukemia (B‐ALL) at new diagnosis (ND) (n = 238). R value and P value are indicated. B, BACH2 and FOS mRNA levels in pediatric ALL (p‐ALL) samples including B‐ALL (n = 10), T cell ALL (T‐ALL) and B/T cell mixed‐phenotype acute leukemia (B/T MPAL) (n = 2) with two immune thrombocytopenic purpura (ITP) samples as negative controls. The fold change in expression compared with the BACH2 levels of one B‐ALL patient is indicated. Data are shown as the mean ± SEM. C, Immunoblots of FOS in different subtypes of p‐ALL with one ITP sample as a negative control. GAPDH was used as a loading control. D, Three putative MARE binding sites within FOS proximal promoter (MARE1), 5′ untranslated region (5′ UTR, MARE2), and Exon 1 (MARE3) along with truncated promoter constructs are indicated (left). 293T cells were transfected with truncated promoter plasmids, BACH2 expression plasmids, or control plasmids (pcDNA3.1). An empty pGL3‐basic plasmid was used as a negative control. The Renilla luciferase reporter pRL‐SV40 was used as an internal control for normalization. Luciferase activity was measured 48 h after transfection. Data are presented as the relative luciferase activity compared with the cells with pcDNA3.1 expression. Data are shown as the mean ± SD from three independent experiments. E, Peak analysis by an IGV software following CUT&Tag sequencing is indicated, with orange reads representing antibodies against control IgG and blue reads representing antibodies against BACH2. GRCh38 genome was used as a human reference genome. Peaks corresponding to MARE1, MARE2, and MARE3 are indicated (red arrows). F, DNA fragments (a‐e) in Nalm‐6 cells amplified by PCR following CUT&Tag assays are indicated (upper), and the relative intensity of each band is shown from two independent validations (lower). NS, not significant; *P < .05; **P < .01; ***P < .001. BM, bone marrow
FIGURE 7
FIGURE 7
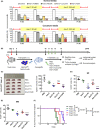
Chemical inhibition of FOS sensitizes leukemic cells to Ara‐C in primary samples and xenografts. A, Primary cells were cultured in complete RPMI1640 media (normal media, upper) or coculture media (lower) upon treatment of Ara‐C at a low dosage of 20 nmol/L or a high dosage of 200 nmol/L for 48 h in the presence of nordihydroguaiaretic acid (NDGA), curcumin, or both. DMSO was used as a negative control. Cell viability was determined using MTT assays. Data are normalized to nontreated control cells and shown as the mean ± SD from three independent experiments. *P < .05; **P < .01; ***P < .001 (vs Ara‐C + DMSO group). B, Experimental design for testing the efficacy of small molecule inhibitors of FOS (NDGA and curcumin) in vivo. C, Spleens (SPs) were isolated and photographed against a ruler (left). The sizes of SPs in each treatment group were measured (right). Data are shown as the mean ± SEM. NS, not significant; *P < .05; **P < .01 (vs Ara‐C group). N, NDGA; C, curcumin. hCD19+ cells were isolated from SP (D) and bone marrow (BM) (E) using anti‐hCD19‐MicroBeads, and the % of hCD19+ cells in each organ was calculated. Data are shown as the mean ± SEM. NS, not significant; *P < .05; **P < .01 (vs Ara‐C group). F, Survival curve of xenograft mice treated with PBS (black), Ara‐C alone (green), or Ara‐C in combination with NDGA (Ara‐C+N, blue), curcumin (Ara‐C+C, red), or both (Ara‐C+both, purple)

Similar articles

Cited by

References

    1. Muto A, Tashiro S, Nakajima O, et al. The transcriptional programme of antibody class switching involves the repressor Bach2. Nature. 2004;429(6991):566‐571. - PubMed
    1. Huang C, Geng H, Boss I, Wang L, Melnick A. Cooperative transcriptional repression by BCL6 and BACH2 in germinal center B‐cell differentiation. Blood. 2014;123(7):1012‐1020. - PMC - PubMed
    1. Itoh‐Nakadai A, Matsumoto M, Kato H, et al. A Bach2‐Cebp gene regulatory network for the commitment of multipotent hematopoietic progenitors. Cell Rep. 2017;18(10):2401‐2414. - PubMed
    1. Itoh‐Nakadai A, Hikota R, Muto A, et al. The transcription repressors Bach2 and Bach1 promote B cell development by repressing the myeloid program. Nat Immunol. 2014;15(12):1171‐1180. - PubMed
    1. Swaminathan S, Huang C, Geng H, et al. BACH2 mediates negative selection and p53‐dependent tumor suppression at the pre‐B cell receptor checkpoint. Nat Med. 2013;19(8):1014‐1022. - PMC - PubMed

Publication types

MeSH terms

Substances