. 2021 Jan;20(1):e13285.
doi: 10.1111/acel.13285. Epub 2021 Jan 3.

Interleukin-6 neutralization ameliorates symptoms in prematurely aged mice

Affiliations

Interleukin-6 neutralization ameliorates symptoms in prematurely aged mice

Stefano Squarzoni et al. Aging Cell. 2021 Jan.

Abstract

Hutchinson-Gilford progeria syndrome (HGPS) causes premature aging in children, with adipose tissue, skin and bone deterioration, and cardiovascular impairment. In HGPS cells and mouse models, high levels of interleukin-6, an inflammatory cytokine linked to aging processes, have been detected. Here, we show that inhibition of interleukin-6 activity by tocilizumab, a neutralizing antibody raised against interleukin-6 receptors, counteracts progeroid features in both HGPS fibroblasts and LmnaG609G/G609G progeroid mice. Tocilizumab treatment limits the accumulation of progerin, the toxic protein produced in HGPS cells, rescues nuclear envelope and chromatin abnormalities, and attenuates the hyperactivated DNA damage response. In vivo administration of tocilizumab reduces aortic lesions and adipose tissue dystrophy, delays the onset of lipodystrophy and kyphosis, avoids motor impairment, and preserves a good quality of life in progeroid mice. This work identifies tocilizumab as a valuable tool in HGPS therapy and, speculatively, in the treatment of a variety of aging-related disorders.

Keywords: accelerated aging; ageing; anti-aging; cellular senescence; cytokines; inflammation; laminopathies; nuclear lamina.


Conflict of interest statement

None declared.

Figures

FIGURE 1
FIGURE 1
IL6 levels and activity are increased in HGPS cells. (a) IL6 secretion in culture media of normal human dermal fibroblasts (Control) or HGPS fibroblasts (HGPS) after 48 h in cell culture. IL6 levels were measured by ELISA. (b) IL6 secretion in culture media of HEK293 non‐transfected (NT) or transiently transfected with plasmids carrying WT‐LMNA (LA‐WT) or Δ50‐LMNA(LA‐Δ50) and kept in culture for 48 h after transfection. IL6 levels were measured by ELISA. (c) qRT‐PCR analysis of IL6 expression in control (Control) and HGPS fibroblasts (HGPS). (d) Activity of IL6 promoter in control (Control) and HGPS fibroblasts (HGPS) measured by a luciferase reporter assay. An IL6 luciferase mutant (IL6 Luc‐mut) was also expressed in normal and HGPS fibroblasts as a negative control. (e) Activity of NF‐kB promoter in control (Control) and HGPS fibroblasts (HGPS) measured by a luciferase reporter assay. (f) Immunofluorescence labeling of phosphorylated STAT3 in control (Control) and HGPS fibroblasts (HGPS). Mean fluorescence intensity values (MFI) are reported in the graph as arbitrary units (a.u.). Scale bar, 10 µm Three biological replicates were used in all analyses (panels a, b, d, e, f), except in qRT‐PCR (panel c, six biological replicates). Data are reported as means ± SEM. Statistically significant differences are indicated (*p < 0.05, **p < 0.01, ***p < 0.001)
FIGURE 2
FIGURE 2
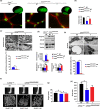
Tocilizumab reduces IL‐6 dependent STAT3 and γ‐H2AX activation and counteracts cellular senescence. (a) Western blot analysis of STAT3 phosphorylated on Tyrosine 705 (P‐STAT3 Y705) or Serine 727 (P‐STAT3 S727), STAT3, in untreated or tocilizumab‐treated HGPS fibroblasts (T). Tocilizumab dosage (µg/ml culture medium) is indicated in the upper row. In the graphs and all the following panels: NT, 0 µg/ml tocilizumab; T, 100 µg/ml tocilizumab. (b)Western blot analysis of γ‐H2AX in HGPS fibroblasts and (c) in normal human dermal fibroblasts subjected to conditioning with control fibroblasts (ctrl) or HGPS fibroblast medium (HGPS). β‐tubulin and β‐actin bands are shown as protein‐loading controls.(d) Senescence‐associated beta‐Galactosidase staining (SA‐βGal) of normal human dermal fibroblasts co‐cultured with control (ctrl) or HGPS fibroblasts (HGPS)left untreated (NT) or treated with tocilizumab (T).The percentage of SA‐βGal‐positive cells is reported in the graph. (e) Western blot analysis of p21 in HGPS fibroblasts. (f) Immunofluorescence analysis of Lamin A/C in HGPS fibroblasts untreated (NT) and treated (T) with tocilizumab. DAPI staining of DNA (blue) allows detection of facultative heterochromatin areas (arrowheads), which correspond to inactive X chromosome and appear duplicated in the untreated HGPS fibroblasts, but not in tocilizumab‐treated cells. Scale bar, 10 µm. Contour ratio of nuclei determined in HGPS fibroblasts left untreated (NT) or treated (T) with tocilizumab is reported in the graph. (g) Immunofluorescence analysis of progerin in HGPS fibroblasts untreated (NT) or treated with tocilizumab (T). Progerin MFI in HGPS nuclei is reported in the graph in arbitrary units (a.u.). (h) Western blot analysis of Progerin and Lamin A/C in HGPS fibroblasts left untreated (NT) or treated (T) with tocilizumab. Emerin bands are shown as protein‐loading controls. Densitometry of immunoblotted protein bands is reported in the upper graph. Lamin A to progerin ratio (calculated on mean densitometric values of each sample) is shown in the lower graph. Three biological replicates were used in all analyses. In panels (a, b, c, e, h), densitometry of immunoblotted protein bands is plotted in the graphs in arbitrary units (a.u.). Data are reported as means ± SEM. Statistically significant differences are indicated (*p < 0.05, **p < 0.01). 100 µg/ml tocilizumab were applied in all experiments
FIGURE 3
FIGURE 3
Effects of tocilizumab in muscle, tendons and bone of LmnaG609G /G609G mice. (a) Immunofluorescence staining of lamin A/C (green) in Lmna +/+ or LmnaG609G / G609Gmice (mean age 100 days), left untreated (NT) or treated (T) with tocilizumab. Muscle fibers are delineated by perlecan staining (red). Higher magnification of nuclei labeled by lamin A/C antibody is shown in the insets. Scale bars, 10 µm. (b) Contour ratio of muscle nuclei in tissue from three different Lmna +/+ or LmnaG609G / G609G vehicle‐treated (NT) or tocilizumab‐treated mice (T). The analysis was performed in 100 nuclei per sample observed by electron microscopy. (c) Transmission electron microscopy analysis of skeletal muscle nuclei from vehicle‐treated (NT) or tocilizumab‐treated LmnaG609G / G609Gmice (T). Scale bars, 1 µm. (d) Western blot analysis of progerin, Ankrd2 and emerin in muscle from Lmna +/+ or LmnaG609G / G609G mice, vehicle‐treated (NT) or treated with tocilizumab (T). Tubulin was used as a loading control. Densitometry of immunoblotted protein bands is plotted in the graphs in arbitrary units (a.u.). (e) Transmission electron microscopy analysis of tendons from LmnaG609G /G609G mice subjected to vehicle (NT) or tocilizumab (T). Cell nuclei of LmnaG609G /G609G mouse tendons show vesicles in the perinuclear space (NT, round vesicles), which are not observed in tocilizumab‐treated mice. Heterochromatin areas appear also disorganized in progeroid mouse tendon nuclei, while recovery of heterochromatin at the nuclear periphery is observed in tocilizumab‐treated LmnaG609G /G609G mouse tissue. The analysis was performed in 50 nuclei per sample. Scale bars, 1 µm. (f) microCT scans of femur from Lmna +/+, untreated LmnaG609G / G609G (NT) or tocilizumab‐treated LmnaG609G / G609G mice. Mean values of relative bone volumes (bone volume/tissue volume (BV/TV)) of the corresponding samples are indicated under each picture. (g) Mean femur biomechanical length (length) and (h) trabecular thickness values (Tb.th) measured in groups of three Lmna +/+, untreated LmnaG609G / G609G (NT) or tocilizumab‐treated LmnaG609G / G609G mice (T). Three biological replicates were used in each experiment. Data are reported as means ± SEM. Statistically significant differences are indicated (*p < 0.05, **p < 0.01, ***p < 0.001). Mean age of mice (all males), 100 ± 6 days
FIGURE 4
FIGURE 4
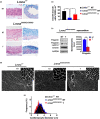
Tocilizumab reduces aorta lesions and cardiomyocyte hypertrophy in progeroid mice. (a) Aorta medium layer histochemical analysis in Lmna +/+ and LmnaG609G / G609G mice left untreated (NT) or treated with tocilizumab (T). Hematoxylin–eosin (left panels) and Alcian Blue staining (right panels) show loss of cellularity and myxoid degeneration (accumulation of acidic mucopolysaccharides) in aorta from vehicle‐treated LmnaG609G / G609Gmice (NT) and rescue with tocilizumab (T). (b) Mean number of smooth muscle cells detected in aorta sections is reported in the graph. (c) Western blot analysis of Progerin, Lamin C and Emerin in myocardium lysates from untreated (NT) or tocilizumab‐treated LmnaG609G / G609Gmice (T). GAPDH bands are shown as loading controls. Densitometry of immunoblotted protein bands is plotted in the graphs in arbitrary units (a.u.). (d) Myocardium sections from 13 months old Lmna +/+ or 3 months old LmnaG609G / G609G mice vehicle‐treated (NT) or treated with tocilizumab (T). Extracellular matrix surrounding cardiomyocytes was stained using an anti‐collagen VI antibody. Bar, 10 µm. (e) Graphs reporting diameter of cardiomyocytes in samples shown in (d). Three biological replicates were used. Data are reported as means ± SEM. Statistically significant differences are indicated (*p < 0.05, **p < 0.01)
FIGURE 5
FIGURE 5
Tocilizumab improves adipose tissue phenotype in progeroid mice. (a) Light microscopy observation of semithin sections of subcutaneous adipose tissue from Lmna +/+or LmnaG609G /+ vehicle‐treated (NT) or tocilizumab‐treated mice (T). Semithin sections were obtained from epon resin‐embedded tissue prepared for electron microscopy analysis. (b, c) Electron microscopy analysis of adipose tissue samples shown in (a). Arrows indicate fusing lipid vesicle. (d) Quantitative analysis of adipocyte size in adipose tissue samples shown in (a–c). A trend toward wild‐type size distribution in tocilizumab‐treated LmnaG609G /+mice is observed. (e) Oil red O staining of white pre‐adipocytes derived from Lmna +/+ or LmnaG609G /+ mouse subcutaneous fat. (f) Graph showing the distribution of lipid vesicle size. (g) Graph representing the percentage of differentiating pre‐adipocytes in cell cultures. Data are in arbitrary units (a.u.). Three biological replicates were used.Scale bars: (a), 100 µm; (b) 5 µm; (c), 1 µm, (e), 10 µm. Statistically significant differences are indicated (****p < 0.0001)
FIGURE 6
FIGURE 6
Tocilizumab improves progeroid phenotype and lifespan in progeroid mice. (a) Representative photographs of untreated (NT) and tocilizumab‐treated (T) LmnaG609G / G609G mice at 80 days of age. (b) Motility test of untreated (NT, n = 3, all males) and tocilizumab‐treated LmnaG609G / G609G mice (T, n = 3, all males). In the graph is reported the walking time (minutes) in a period of 30 min. Differences at 85 and 110 days are statistically significant (p < 0.01). (c) Age at kyphosis onset (days) of untreated (NT, n = 6, 3 females, 3 males) and tocilizumab‐treated (T, n = 7, 5 females, 2 males) LmnaG609G / G609G mice. Statistically significant difference is indicated (*p < 0.05). (d) Body weight variation (%) of untreated and tocilizumab‐treated LmnaG609G / G609G mice between 6 (6 w) and 12 weeks of age (12 w). Mean values measured in 5 mice per group (2 females, 3 males) are reported in the upper graph, weight referred to each animal (indicated as 1–10) is reported in the lower graphs (left bars, 6 weeks weight; right bars, 12 weeks weight). Statistically significant differences are indicated (**p < 0.01, ****p < 0.0001). (e) Kaplan–Meier survival plot showing the increase in life span of LmnaG609G / G609G mice treated with tocilizumab (n = 13, 7 females, 6 males) as compared with LmnaG609G / G609G untreated littermates (n = 18, 9 females, 9 males). p < 0.05, log‐rank/Mantel‐Cox test. (f) Kaplan–Meier survival plot showing the increase in life span of LmnaG609G /+ mice treated with tocilizumab (n = 16, 9 females, 7 males) as compared with LmnaG609G /+ untreated littermates (n = 20, 3 females, 17 males). p < 0.01, log‐rank/Mantel‐Cox test. The age at 50% survival (median survival) is indicated next to each graph (d, days)

Similar articles

Cited by

References

    1. Aguado, J. , Sola‐Carvajal, A. , Cancila, V. , Revêchon, G. , Ong, P. F. , Jones‐Weinert, C. W. , Wallén Arzt, E. , Lattanzi, G. , Dreesen, O. , Tripodo, C. , Rossiello, F. , Eriksson, M. , & d'Adda di Fagagna, F. (2019). Inhibition of DNA damage response at telomeres improves the detrimental phenotypes of Hutchinson‐Gilford Progeria Syndrome. Nature Communications, 10(1), 4990 10.1038/s41467-019-13018-3 - DOI - PMC - PubMed
    1. Antoniel, M. , Traina, F. , Merlini, L. , Andrenacci, D. , Tigani, D. , Santi, S. , Cenni, V. , Sabatelli, P. , Faldini, C. , & Squarzoni, S. (2020). Tendon extracellular matrix remodeling and defective cell polarization in the presence of collagen VI mutations. Cells, 9(2), 409 10.3390/cells9020409 - DOI - PMC - PubMed
    1. Araujo‐Vilar, D. , & Santini, F. (2019). Diagnosis and treatment of lipodystrophy: A step‐by‐step approach. Journal of Endocrinological Investigation, 42(1), 61–73. 10.1007/s40618-018-0887-z - DOI - PMC - PubMed
    1. Avnet, S. , Pallotta, R. , Perut, F. , Baldini, N. , Pittis, M. G. , Saponari, A. , Lucarelli, E. , Dozza, B. , Greggi, T. , Maraldi, N. M. , Capanni, C. , Mattioli, E. , Columbaro, M. , & Lattanzi, G. (2011). Osteoblasts from a mandibuloacral dysplasia patient induce human blood precursors to differentiate into active osteoclasts. Biochimica Et Biophysica Acta, 1812(7), 711–718. 10.1016/j.bbadis.2011.03.006 - DOI - PubMed
    1. Baran, P. , Hansen, S. , Waetzig, G. H. , Akbarzadeh, M. , Lamertz, L. , Huber, H. J. , Ahmadian, M. R. , Moll, J. M. , & Scheller, J. (2018). The balance of interleukin (IL)‐6, IL‐6.soluble IL‐6 receptor (sIL‐6R), and IL‐6.sIL‐6R.sgp130 complexes allows simultaneous classic and trans‐signaling. Journal of Biological Chemistry, 293(18), 6762–6775. 10.1074/jbc.RA117.001163 - DOI - PMC - PubMed

Publication types

LinkOut - more resources