. 2021 Jan 4;131(1):e140177.
doi: 10.1172/JCI140177.

Mitigating oxygen stress enhances aged mouse hematopoietic stem cell numbers and function

Affiliations

Mitigating oxygen stress enhances aged mouse hematopoietic stem cell numbers and function

Maegan L Capitano et al. J Clin Invest. .

Abstract

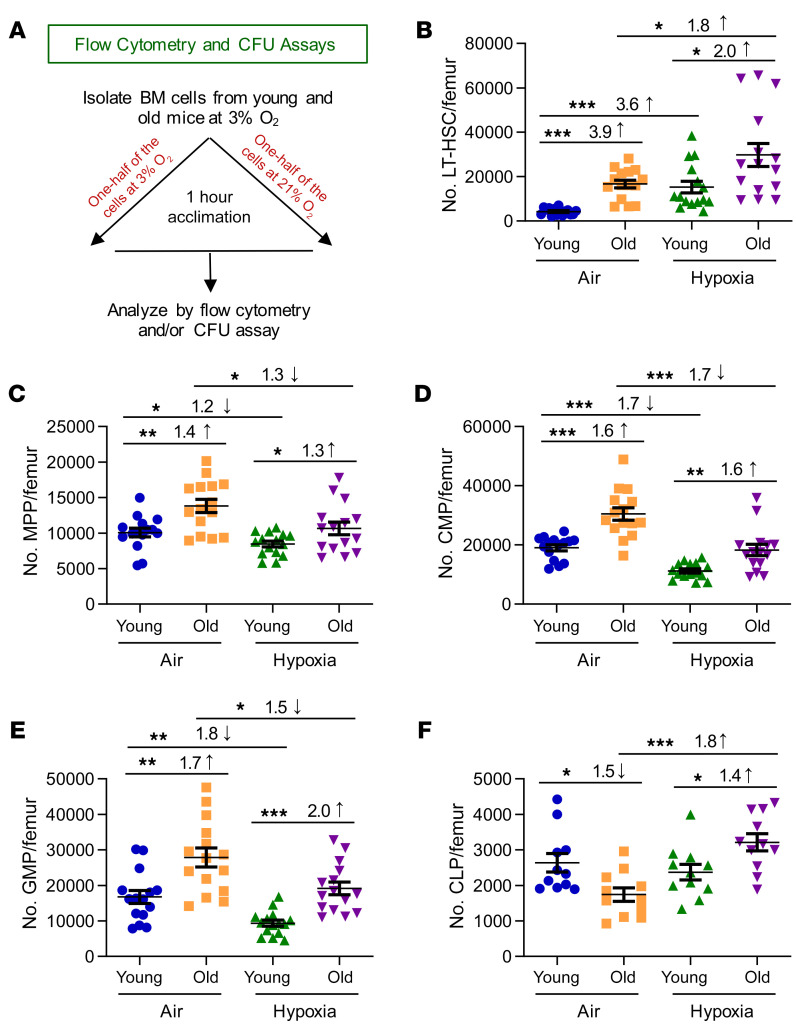
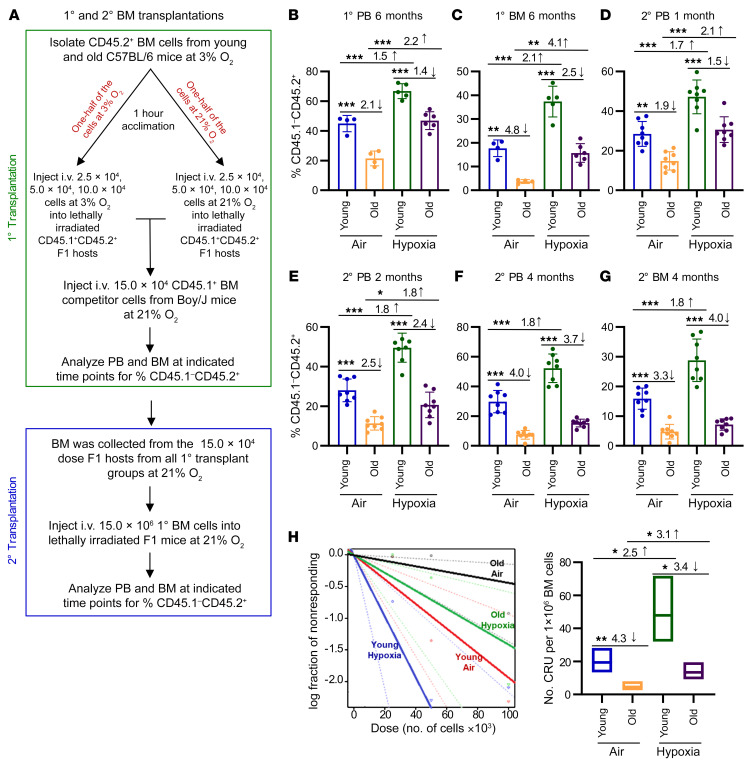
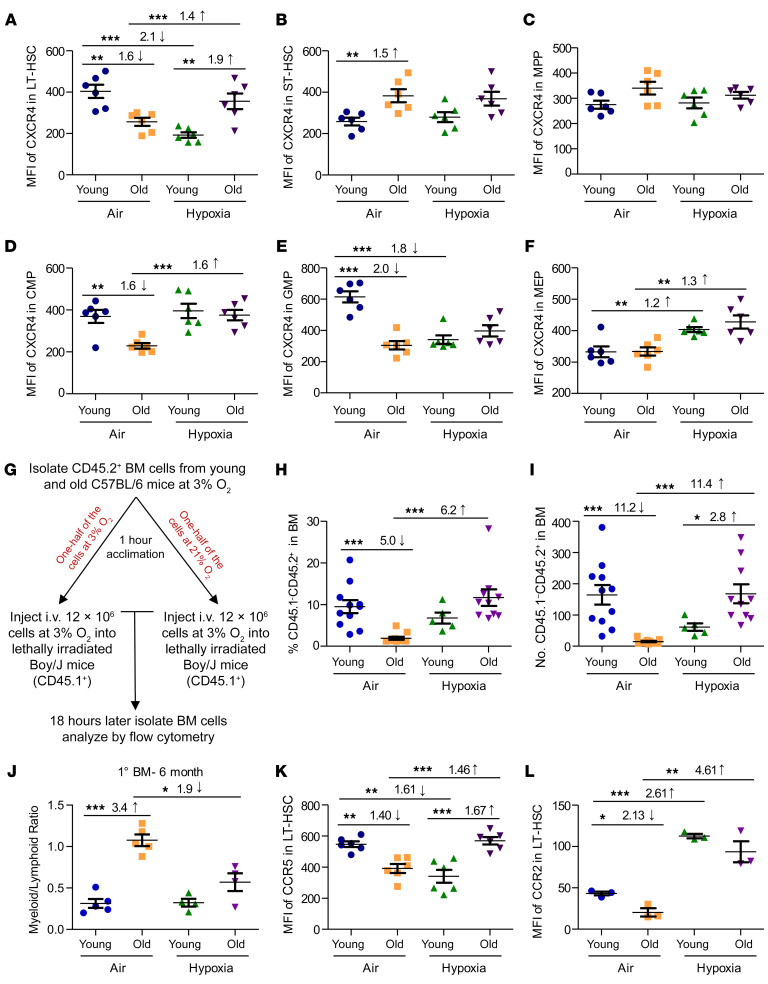
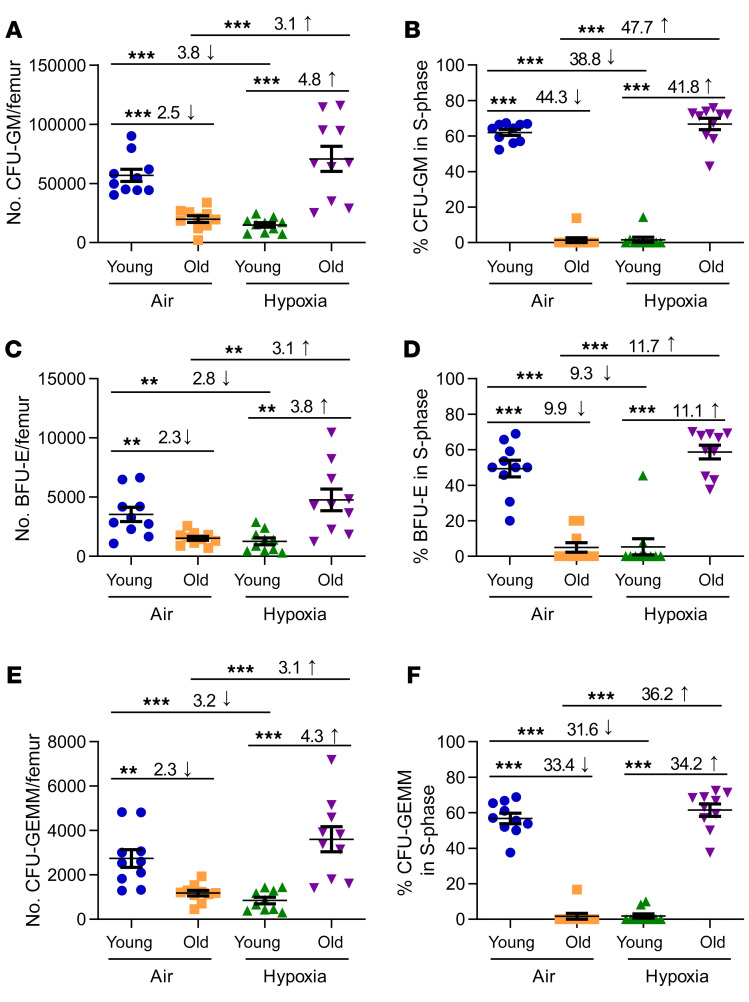
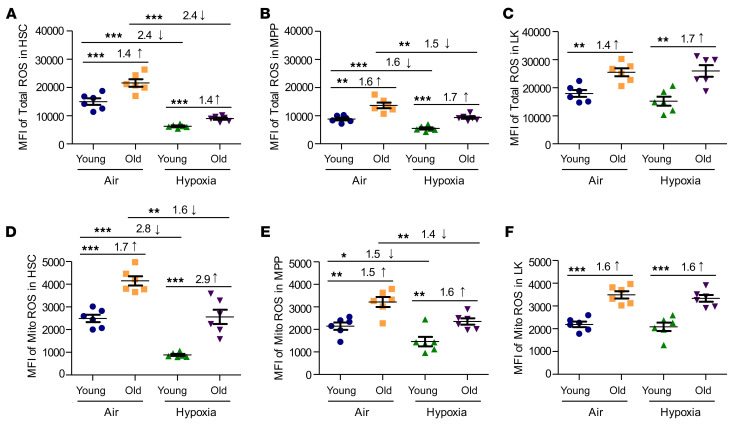
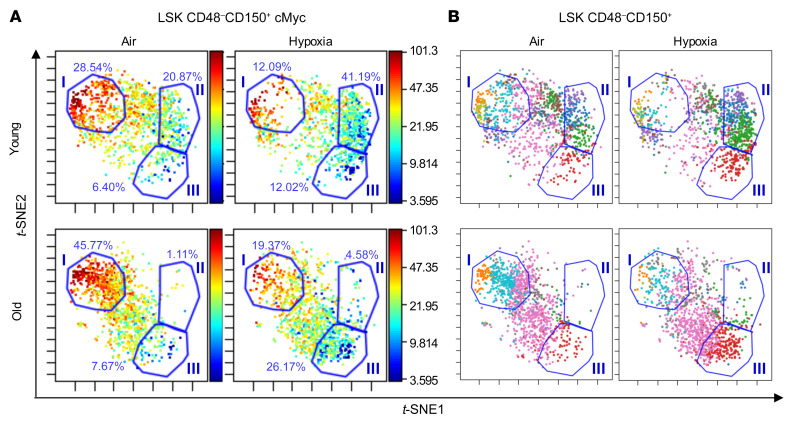
Bone marrow (BM) hematopoietic stem cells (HSCs) become dysfunctional during aging (i.e., they are increased in number but have an overall reduction in long-term repopulation potential and increased myeloid differentiation) compared with young HSCs, suggesting limited use of old donor BM cells for hematopoietic cell transplantation (HCT). BM cells reside in an in vivo hypoxic environment yet are evaluated after collection and processing in ambient air. We detected an increase in the number of both young and aged mouse BM HSCs collected and processed in 3% O2 compared with the number of young BM HSCs collected and processed in ambient air (~21% O2). Aged BM collected and processed under hypoxic conditions demonstrated enhanced engraftment capability during competitive transplantation analysis and contained more functional HSCs as determined by limiting dilution analysis. Importantly, the myeloid-to-lymphoid differentiation ratio of aged BM collected in 3% O2 was similar to that detected in young BM collected in ambient air or hypoxic conditions, consistent with the increased number of common lymphoid progenitors following collection under hypoxia. Enhanced functional activity and differentiation of old BM collected and processed in hypoxia correlated with reduced "stress" associated with ambient air BM collection and suggests that aged BM may be better and more efficiently used for HCT if collected and processed under hypoxia so that it is never exposed to ambient air O2.

Keywords: Aging; Bone marrow transplantation; Hematology; Hematopoietic stem cells; hypoxia.


Conflict of interest statement

Conflict of interest: The authors have declared that no conflict of interest exists.

Figures

Figure 1
Figure 1. Phenotyping of young and old C57BL/6 mouse BM HSCs and HPCs collected under hypoxia and processed under ambient air (21% O2) versus hypoxia (3% O2).
(A) In a hypoxic glove box (acclimated to 3% O2 for 18 hours), femurs from young (8- to -12-week-old) and old (20- to 28-month-old) male and female C57BL/6 mice were flushed in sterile PBS, counted, and split in half so that one half remained under hypoxia and the other half were removed from hypoxia and acclimated to ambient air for 1 hour. Nucleated cells were analyzed. (B) Number of LT-HSCs (LinSca-1+c-Kit+Flt3CD34) per femur. (C) Number of MPPs (LinSca-1+c-Kit+Flt3+CD34+) per femur. (D) Number of CMPs (LinSca-1c-Kit+FcγII/IIIRloCD34+) per femur. (E) Number of GMPs (LinSca-1c-Kit+FcγII/IIIRhiCD34+) per femur. (F) Number of CLPs (LinSca-1loc-KitloFlt3+IL-7R+) per femur. (BF) Data represent the mean ± SEM for 11–15 C57BL/6 mice from 3–4 experiments. *P < 0.05, **P < 0.01, and ***P < 0.001, by 1-way ANOVA with post hoc Tukey’s multiple-comparison test.
Figure 2
Figure 2. HSC engraftment efficiency of young and old C57BL/6 mice collected/processed under ambient air versus hypoxia as assessed by BM transplantation and limiting dilution analysis.
(A) Schematic of the experiment. Donor BM cells collected in ambient air versus hypoxia and competitor cells collected in 21% O2 were injected i.v. in either 3% O2 (hypoxia) or 21% O2 (ambient air) into 950 cGy–irradiated CD45.1+CD45.2+ F1 recipients (25,000, 50,000, and 100,000 donor cells, with 150,000 competitor cells). The percentages of donor cells (CD45.1CD45.2+) in PB (B) and BM (C) were determined from the 50,000-cell-dose group. Data represent the mean ± SEM for 4–6 recipient mice. (DG) Secondary transplantations of primary recipient BM collected under ambient air conditions. The percentages of donor cells in PB (DF) and BM (G) were determined. Data represent the mean ± SEM of 8 mice per group. (H) Left: Poisson statistical analysis from limiting dilution transplantation. Shapes represent the percentages of negative mice for each cell dose, solid lines indicate the best-fit linear model, and dotted lines represent 95% CIs. Right: Number of CRU in 1 × 10⁶ BM cells. Data represent the mean ± SEM for 4–6 F1 recipient mice. (See Supplemental Table 1 for more details.) *P < 0.05, **P < 0.01, and ***P < 0.001, by 1-way ANOVA with post hoc Tukey’s multiple-comparison test (BG). 1°, primary; 2°, secondary.
Figure 3
Figure 3. Chemokine receptor expression in young and old C57BL/6 mouse BM collected under hypoxia and processed under ambient air or hypoxic conditions.
Young and old C57BL/6 donor BM cells were collected and processed as in Figure 1A. CXCR4 expression on LT-HSCs (A), ST-HSCs (B), MPPs (C), CMPs (D), GMPs (E), and MEPs (F). Data represent the mean ± SEM for 6 C57BL/6 mice per group. (G) Experimental schema to determine the homing capacity of donor cells. (H) Percentage of CD45.1CD45.2+ cells in BM determined 18 hours after injection. (I) Number of CD45.1CD45.2+ (LSK CD150+) HSCs in BM determined 18 hours after injection. (H and I) Data represent the mean ± SEM of 10 femurs per group. (J) Myeloid (CD11b+)/lymphoid (CD3+ and B220+) ratio in BM 6 months after primary transplantation. Data represent the mean ± SEM for 4–6 F1 recipient mice. (K) CCR5 expression on LT-HSCs. Data represent the mean ± SEM for 6 C57BL/6 mice per group. (L) CCR2 expression on LT-HSCs. Data represent the mean ± SEM for 3 C57BL/6 mice per group. *P < 0.05, **P < 0.01, and ***P < 0.001, by 1-way ANOVA with post hoc Tukey’s multiple-comparison test.
Figure 4
Figure 4. Numbers of functional HPCs from young and old C57BL/6 mouse BM collected under hypoxia and processed under ambient air or hypoxic conditions.
BM cells were collected and processed as in Figure 1A. Nucleated BM cells were used in an HPC CFU assay stimulated in vitro with EPO, SCF, PWMSCM, and hemin (A, C, and E) and cultured at 5% O2, with the percentage of HPCs in S-phase defined by a high specific activity tritiated thymidine kill assay (B, D, and F). The numbers of CFU-GM (A and B), BFU-E (C and D), and CFU-GEMM (E and F) were calculated per femur. Data represent the SEM for 10 C57BL/6 mice from 3–4 experiments. **P < 0.01 and ***P < 0.001, by 1-way ANOVA with post hoc Tukey’s multiple-comparison test.
Figure 5
Figure 5. Total and mitochondrial HSC and HPC ROS levels in young and old C57BL/6 mouse BM collected under hypoxia and processed under ambient air or hypoxic conditions.
Young and old C57BL/6 mouse BM was collected and processed as in Figure 1A. BM cells were analyzed by flow cytometry for total ROS levels (using H2DCFDA) (AC) and mitochondrial (Mito) ROS levels (using MitoTracker Red CMXRos) (DF). ROS levels in HSCs (LSK CD34FLT3) (A and D), MPPs (LSK CD34+ Flt3+) (B and E), and LK myeloid progenitors (LinSca-1c-Kit+) (C and F). Data represent the mean ± SEM for 6 C57BL/6 mice per group. *P < 0.05, **P < 0.01, and ***P < 0.001, by 1-way ANOVA with post hoc Tukey’s multiple-comparison test.
Figure 6
Figure 6. CyTOF analysis of gated LT-HSCs demonstrated distinct subpopulation changes among ambient air–acclimated and hypoxia-collected/processed lineage-negative BM cells.
BM from young and old C57BL/6 donor mice was collected and processed as in Figure 1A. Samples were stained with the indicated antibodies conjugated to metal (see Supplemental Table 3) and then analyzed with a CyTOF 2 mass cytometer and Cytobank software. (A) cMyc levels within gated LSK CD48CD150+ plots using viSNE analysis. Scales indicate the mean marker intensity of arcsinh-transformed values. (B) Gated LSK CD48CD150+ LT-HSCs were used to make viSNE plots, where different colors indicate the subpopulations explored (10 in all; see Supplemental Table 2 for subpopulation definitions). In A and B, the cell populations changed by ambient air exposure are labeled as gates I, II, and III, and the percentage of cells within the gate is indicated. t-SNE1,-2, t-distributed stochastic neighbor embedding.

References

    1. Beerman I, Maloney WJ, Weissmann IL, Rossi DJ. Stem cells and the aging hematopoietic system. Curr Opin Immunol. 2010;22(4):500–506. doi: 10.1016/j.coi.2010.06.007. - DOI - PMC - PubMed
    1. Geiger H, de Haan G, Florian MC. The ageing haematopoietic stem cell compartment. Nat Rev Immunol. 2013;13(5):376–389. doi: 10.1038/nri3433. - DOI - PubMed
    1. Kuranda K, et al. Age-related changes in human hematopoietic stem/progenitor cells. Aging Cell. 2011;10(3):542–546. doi: 10.1111/j.1474-9726.2011.00675.x. - DOI - PubMed
    1. Miller JP, Allman D. Linking age-related defects in B lymphopoiesis to the aging of hematopoietic stem cells. Semin Immunol. 2005;17(5):321–329. doi: 10.1016/j.smim.2005.05.003. - DOI - PubMed
    1. Rossi DJ, et al. Cell intrinsic alterations underlie hematopoietic stem cell aging. Proc Natl Acad Sci U S A. 2005;102(26):9194–9199. doi: 10.1073/pnas.0503280102. - DOI - PMC - PubMed

Publication types