. 2021 Jan 4;131(1):e133081.
doi: 10.1172/JCI133081.

Targeting the mitochondrial trifunctional protein restrains tumor growth in oxidative lung carcinomas

Affiliations

Targeting the mitochondrial trifunctional protein restrains tumor growth in oxidative lung carcinomas

Nivea Dias Amoedo et al. J Clin Invest. .

Abstract

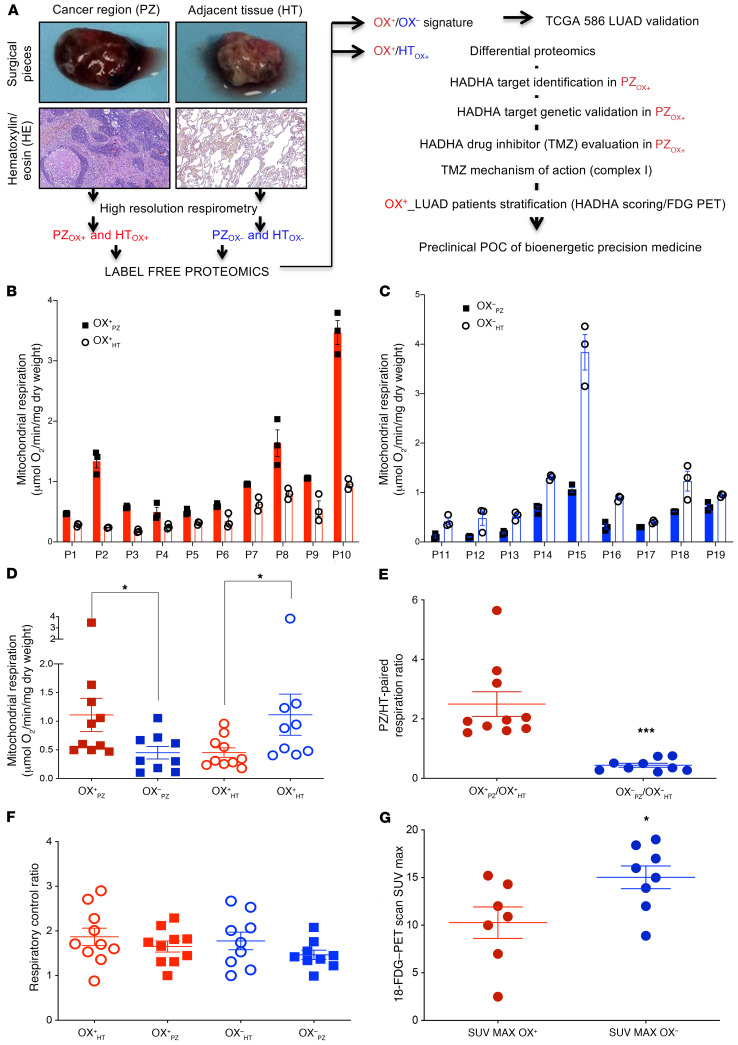
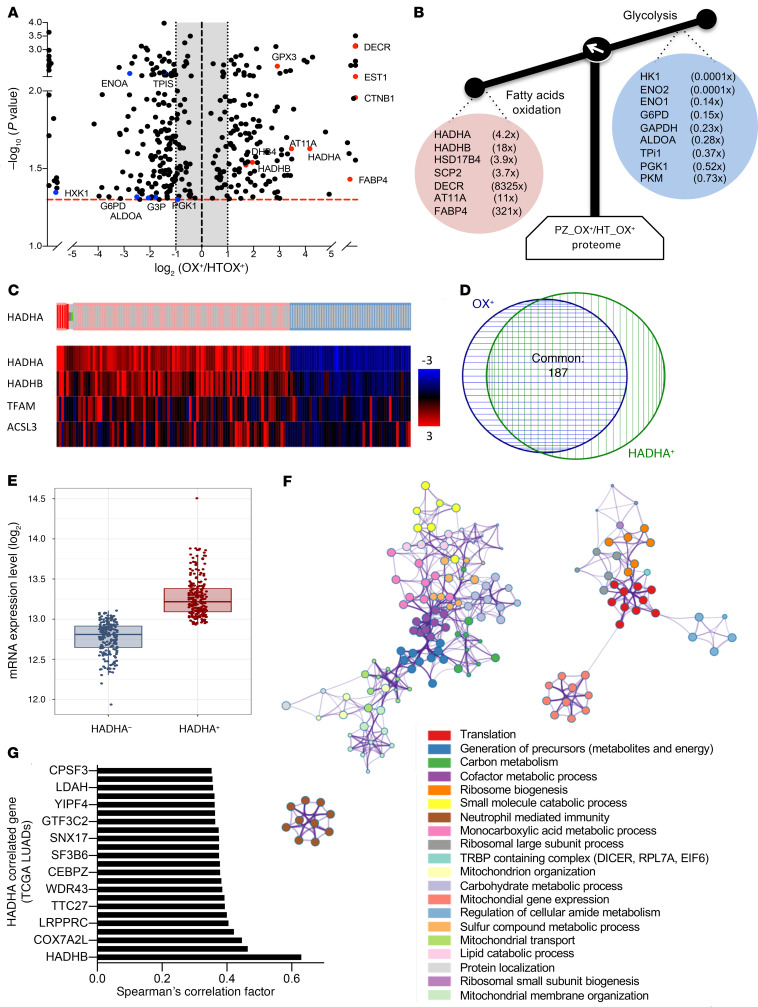
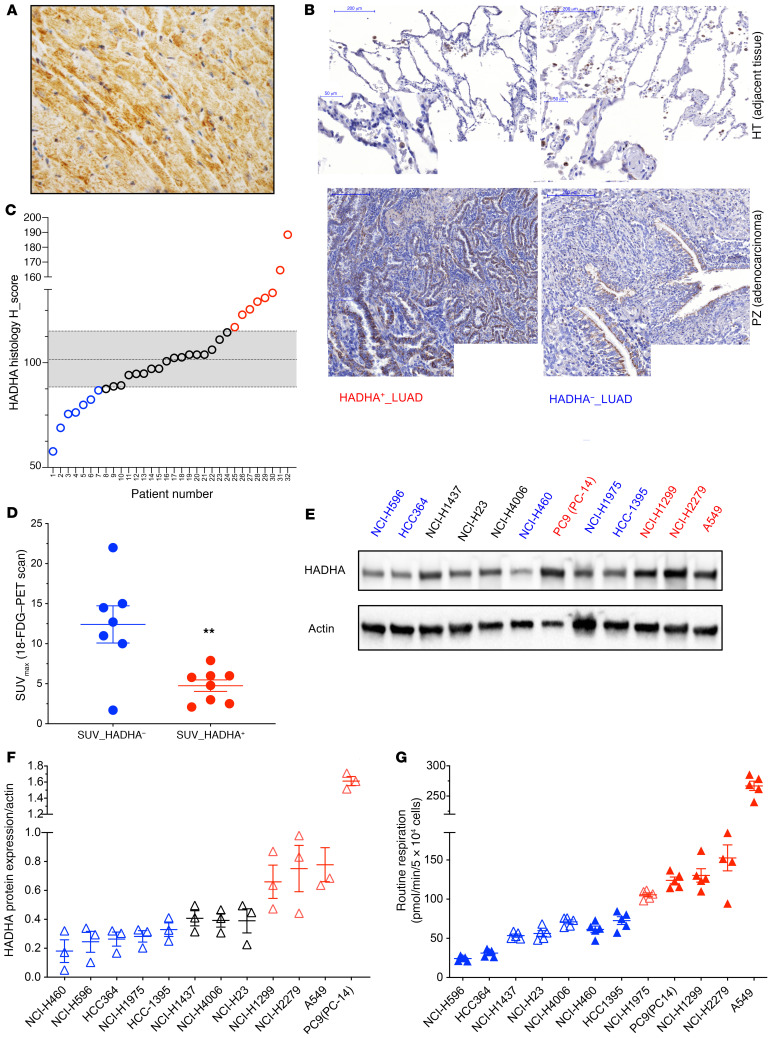
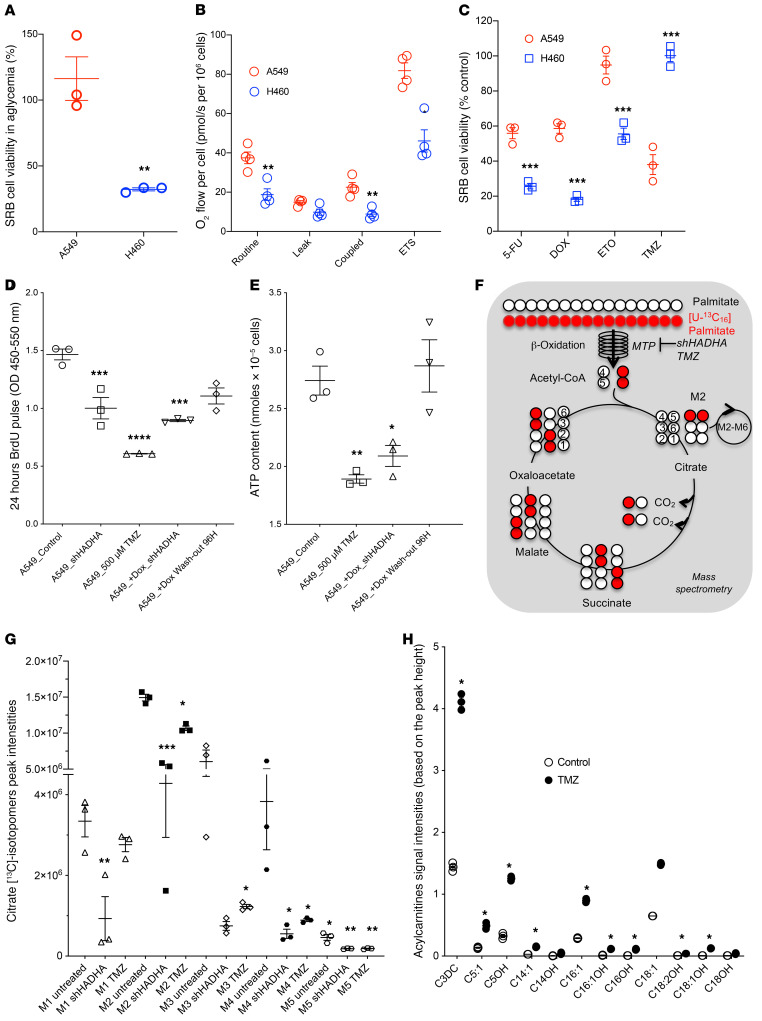
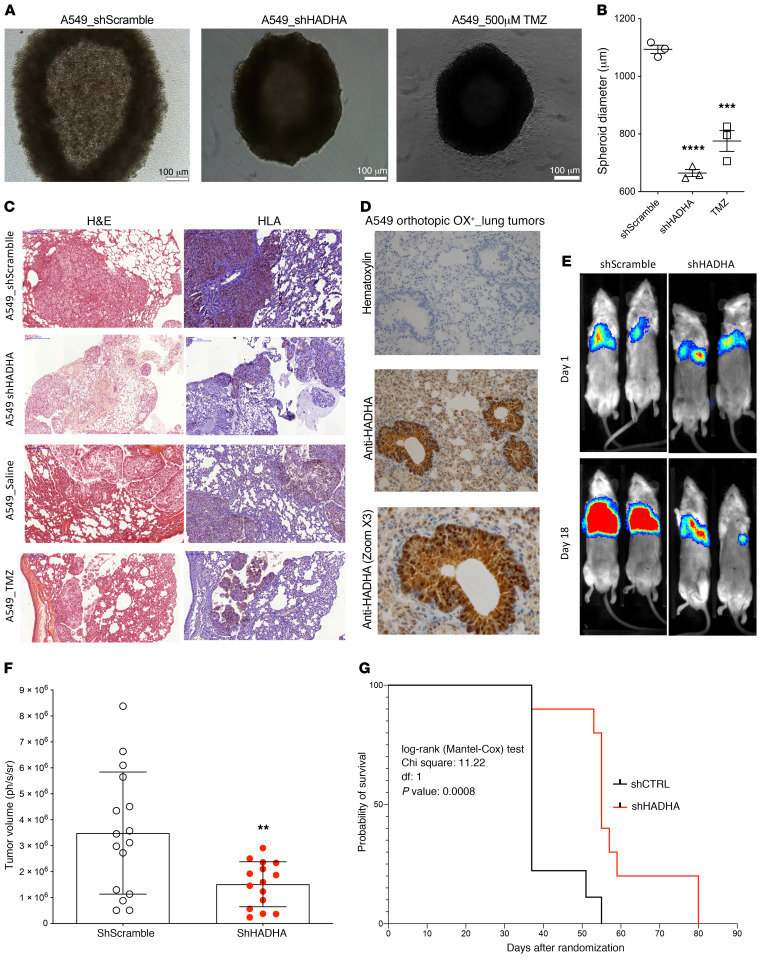
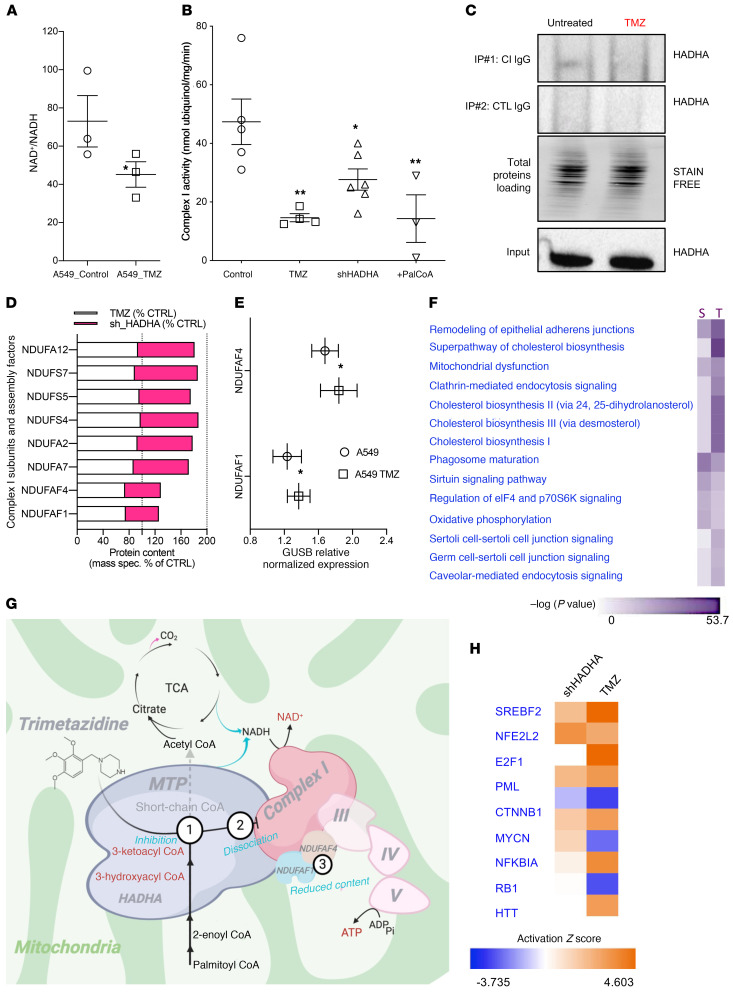
Metabolic reprogramming is a common hallmark of cancer, but a large variability in tumor bioenergetics exists between patients. Using high-resolution respirometry on fresh biopsies of human lung adenocarcinoma, we identified 2 subgroups reflected in the histologically normal, paired, cancer-adjacent tissue: high (OX+) mitochondrial respiration and low (OX-) mitochondrial respiration. The OX+ tumors poorly incorporated [18F]fluorodeoxy-glucose and showed increased expression of the mitochondrial trifunctional fatty acid oxidation enzyme (MTP; HADHA) compared with the paired adjacent tissue. Genetic inhibition of MTP altered OX+ tumor growth in vivo. Trimetazidine, an approved drug inhibitor of MTP used in cardiology, also reduced tumor growth and induced disruption of the physical interaction between the MTP and respiratory chain complex I, leading to a cellular redox and energy crisis. MTP expression in tumors was assessed using histology scoring methods and varied in negative correlation with [18F]fluorodeoxy-glucose incorporation. These findings provide proof-of-concept data for preclinical, precision, bioenergetic medicine in oxidative lung carcinomas.

Keywords: Bioenergetics; Metabolism; Oncology.


Conflict of interest statement

Conflict of interest: RR and NA declare a patent (PCT/EP2018/086278) entitled “Mitochondrial trifunctional protein (MTP) inhibitors for use in the treatment of high mitochondrial respiration (OX+) cancers.” Institution: AST Aquitaine — University of Bordeaux.

Figures

Figure 1
Figure 1. Oxidative human lung tumor (OX+ LUAD) identification by high-resolution respirometry.
(A) Tissue sampling and study workflow. The cancer region (PZ; proliferating zone) and the paired, cancer-adjacent tissue (HT; healthy tissue) were dissected by the pathologist and used for subsequent bioenergetic, proteomic, and immunohistology analyses. (B) Tissue respiration (PZ: plain bars and HT: empty bars) identified consistent bioenergetic mispairing between PZ and HT in the 2 groups of tumors: OX+ (PZOX+ > HTOX+; red) and (C) OX (PZOX– < HTOX–; blue). (D) Comparison of the respiration of the OX+ LUAD group (red circles) versus the OX LUAD (blue squares), for PZ (plain symbols) and HT (empty symbols), respectively. (E) PZ respiration normalized to HT respiration stratified the OX+ LUAD (red circles) and the OX LUAD (blue squares) subgroups. (F) Respiratory control ratio (routine/oligomycin treated–respiration). (G) Glucose incorporation in the 2 subgroups of lung tumors as measured by the [18F]-FDG–PET scan. Differences between the OX+ and the OX LUAD subgroups were compared using a 2-sided Student’s t test. Data are expressed as mean ± SEM. *P < 0.05, ***P < 0.001.
Figure 2
Figure 2. The MTP subunit HADHA is a priority target in OX+ LUAD.
(A) Volcano plot of the differential label-free proteomic analysis performed between PZOX+ and HTOX+ LUADs. (B) Proteins involved in glycolysis were repressed in PZOX+, whereas proteins involved in FAO were upregulated. The mean fold change ratio between OX+ PZ and OX+ HT is indicated. (C) Analysis of HADHA expression in 586 human LUAD samples (https://www.cbioportal.org/). Tumors with a positive HADHA z score higher than 1.2 (HADHA+) are indicated in red; tumors with HADHA z score less than 0.8 (HADHA) are shown in blue. The heatmap gives the z score for the genes listed on the left. (D) Venn diagram showing the overlap between the TCGA LUAD OX+ tumors and the TCGA LUAD HADHA+ tumors identified in panel C. (E) HADHA absolute mRNA expression in HADHA+ and HADHA LUAD tumors. (F) RNA-Seq data from the HADHA+ and the HADHA LUADs were analyzed using DESeq2 to generate the list of genes that differed between the 2 groups (adjusted P < 0.005). This list was further analyzed using Metascape (metascape.org) to identify all statistically enriched GO/KEGG terms. The significant terms were then hierarchically clustered into a tree and converted into a network layout. Each term is represented by a circle node, where its size is proportional to the number of genes, and its color represents its cluster. Terms with a similarity score higher than 0.3 are linked by an edge (the thickness represents the similarity score) and visualized with Cytoscape (v3.1.2). One term from each cluster was selected as label. (G) Genes coexpressed with HADHA in TCGA lung tumors. The top genes with a Pearson coefficient higher than 0.35 are shown in the bar graph. Data are expressed as mean ± SEM.
Figure 3
Figure 3. HADHA+ LUAD tumor and cell line stratification.
(A) HADHA immunohistology staining in mouse heart (40× zoom). A strong HADHA cytosolic staining (brown) can be observed in the myofibers (nuclei were stained in blue). (B) This method was applied to study HADHA expression in paraffin-embedded sections of lung tumors stained with hematoxylin (blue), eosin (red), and with a monoclonal antibody recognizing HADHA (brown staining). Representative tumors with either high HADHA expression (HADHA+ LUAD; left panel) or low HADHA expression (HADHA LUAD; right panel) are shown. (C) HADHA tissue expression in the tumor and the noncancer tissue was used to calculate the HADHA histology score in 32 tumor samples. Tumors with HADHA score greater than median absolute deviation (MAD) were denominated HADHA+ LUADs (shown in red) and tumors with HADHA score less than MAD were denoted HADHA LUADs (shown in blue). (D) Distribution of the [18F]-FDG–PET scan SUVmax values. (E) HADHA expression was determined by Western blot on a panel of 12 human lung cancer cell lines. (F) HADHA expression normalized to actin levels (mean expression value at dashed line) was used to segregate the cell lines with high (HADHA+; red) or low HADHA expression (HADHA; blue). Cells with a black symbol show no difference to the median value. (G) Mitochondrial respiration was measured in the 12 human lung cancer cell lines using the Seahorse extracellular flux analyzer. The mean (dashed line) was used to segregate the cell lines with high (red) or low (blue) respiration. Cells with a plain symbol correspond to the HADHA/OX group (plain blue) or to the HADHA+/OX+ group (plain red). Data are expressed as mean ± SEM. **P < 0.01.
Figure 4
Figure 4. Metabolic impact of HADHA inhibition in OX+ LUADs.
(A) Impact of glucose withdrawal on A549 (HADHA+/OX+; red) and H460 (HADHA/OX; blue) cell viability. (B) High-resolution respirometry comparative analysis of intact A549 and H460 cells: routine respiration (basal), leak respiration (oligomycin), ETS (uncoupled), and ROX (in presence of rotenone and antimycin A). All the parameters were corrected by ROX values. (C) Effect of trimetazidine (TMZ 500 μM; 24 hours), 5-fluorouracil (5-FU 50 μM, 24 hours), doxorubicin (DOX 5 μM; 24 hours), and etoposide (ETO 20 μM, 24 hours) on cell viability. (D) Reduction of BrdU incorporation in A549 cells treated with HADHA shRNA or with 500 μM TMZ for 24 hours in vitro. A doxycycline-induced shRNA targeting HADHA was also used to study the reversibility and the specificity of HADHA inhibition on cell proliferation after 96 hours of doxycycline washout. (E) Total cellular ATP content of A549 cells treated with saline, 500 μM TMZ for 48 hours, or doxycycline-induced shRNA-mediated HADHA knockdown. (F) Principles of the lipidomic analysis of [U-13C]-palmitate oxidative metabolism. (G) The incorporation of [U-13C]-palmitate carbons in citrate was quantified for different isotopomers (M1–M6) after 4 hours in A549 cells treated with scramble-shRNA, shRNA targeting HADHA, or 500 μM TMZ. (H) Lipidomic analysis of A549 cells treated with saline or TMZ. Differences between the treated and the untreated groups were compared using a 2-sided Student’s t test (panels AE). For panels H and G, 1-way ANOVA with Dunnett’s correction multiple t test comparison was used. Data are expressed as mean ± SEM. *P < 0.05, **P < 0.01, ***P < 0.001, ****P < 0.0001.
Figure 5
Figure 5. Anticancer effect of HADHA genetic inhibition in OX+ LUAD.
(A) Reduction of OX+ LUAD spheroid growth using HADHA shRNA or 50 μM TMZ on A549 cells cultured in anchorage-independent conditions. (B) Effect of MTP inhibition on A549 OX+ LUAD spheroid diameter. (C) Representative (10×) fields of 2 separate areas of A549 OX+ tumors: H&E staining (left; pink) and anti-human marker HLA (right; blue) staining of A549 cells in excised orthotopic human A549-OX+ LUAD tumors in NSG mice. (D) Immunohistology staining of HADHA in excised orthotopic human A549-OX+ LUAD tumors in NSG mice. H&E staining 20× zoom. Anti-HADHA 40× zoom. (E) Representative evolution of the bioluminescence signal from day 1 to day 18 in 2 groups of NSG mice: (i) orthotopic model of A549 expressing luciferase, (ii) orthotopic model of A549 shHADHA expressing luciferase. (F) Relative tumor volume obtained from the luminescence signal in the groups of mice treated with shRNA scramble and shRNA HADHA (N = 20 animals per group). (G) Animal survival (Kaplan-Meier representation) in the 2 groups of mice treated with shRNA scramble and shRNA HADHA (N = 20 animals per group). Values represent mean ± SEM; N = 4–6 for the in vitro experiments; N = 8–20 for the in vivo experiments. One-way ANOVA with Dunnett’s correction was used to analyze the results of panels A and B. Two-sided unpaired Student’s t test was used to compare the groups of mice in panel F. Log-rank (Mantel-Cox) test was used to compare animal survival in panel G. **P < 0.01, ***P < 0.001, ****P < 0.0001.
Figure 6
Figure 6. Trimetazidine disrupts the HADHA–complex I interaction.
(A) NAD+/NADH ratio in A549 (OX+) cells treated with 500 μM trimetazidine (TMZ) for 48 hours. (B) NADH-oxidizing complex I enzymatic activity on A549 cells treated with 500 μM TMZ for 48 hours, on A549 cells expressing a shRNA against HADHA, or on A549 cell homogenate treated with 100 μM palmitoyl-CoA. (C) Impact of HADHA downregulation using shRNA on complex I–HADHA physical association. HADHA detection was performed by Western blot. A negative control IgG was also used to verify the specificity of the capture. (D) Changes in complex I composition in A549 cells expressing the shRNA targeting HADHA or in cells treated with TMZ. Complex I subunit content was quantified using mass spectrometry. The data are expressed as a percentage of the corresponding control. (E) NDUFAF1 and NDUFAF4 subunit mRNA content in A549 cells treated with TMZ. (F) Differential proteomic analysis performed on A549 cells treated with TMZ versus untreated cells, or between A549 cells expressing an shRNA against HADHA and cells expressing a scramble shRNA. The proteome modifications were compared using the “comparative analysis module” of IPA (QIAGEN). Only proteins with changes greater than 15% and P < 0.05 were kept for this analysis. The IPA canonical pathways altered in the 2 conditions are shown as well as the –log P value (purple color scale). (G) The mechanism of action of TMZ in lung cancer cells. Three related effects are proposed: HADHA inhibition, dissociation from complex I, and reduced content of NDUFAF1 and NDUFAF4. (H) Transcription factors potentially activated or inhibited by the shHADHA or TMZ treatments in A549 cells, as predicted using the upstream analysis module of IPA. The activation z score is shown as a color code (orange = activated and blue = inhibited). Data are expressed as mean ± SEM. *P < 0.05, **P < 0.01.

References

    1. Garon EB, et al. Five-year overall survival for patients with advanced non–small-cell lung cancer treated with pembrolizumab: results from the phase I KEYNOTE-001 study. J Clin Oncol. 2019;37(28):2518–2527. doi: 10.1200/JCO.19.00934. - DOI - PMC - PubMed
    1. Hong DS, et al. KRASG12C inhibition with sotorasib in advanced solid tumors. N Engl J Med. 2020;383(13):1207–1217. doi: 10.1056/NEJMoa1917239. - DOI - PMC - PubMed
    1. Hensley CT, et al. Metabolic heterogeneity in human lung tumors. Cell. 2016;164(4):681–694. doi: 10.1016/j.cell.2015.12.034. - DOI - PMC - PubMed
    1. Padanad MS, et al. Fatty acid oxidation mediated by acyl-CoA synthetase long chain 3 is required for mutant KRAS lung tumorigenesis. Cell Rep. 2016;16(6):1614–1628. doi: 10.1016/j.celrep.2016.07.009. - DOI - PMC - PubMed
    1. Weinberg F, et al. Mitochondrial metabolism and ROS generation are essential for Kras-mediated tumorigenicity. Proc Natl Acad Sci U S A. 2010;107(19):8788–8793. doi: 10.1073/pnas.1003428107. - DOI - PMC - PubMed

Publication types

MeSH terms

Substances