. 2021 Jan 4;131(1):e134529.
doi: 10.1172/JCI134529.

TLR3 controls constitutive IFN-β antiviral immunity in human fibroblasts and cortical neurons

Affiliations

TLR3 controls constitutive IFN-β antiviral immunity in human fibroblasts and cortical neurons

Daxing Gao et al. J Clin Invest. .

Abstract

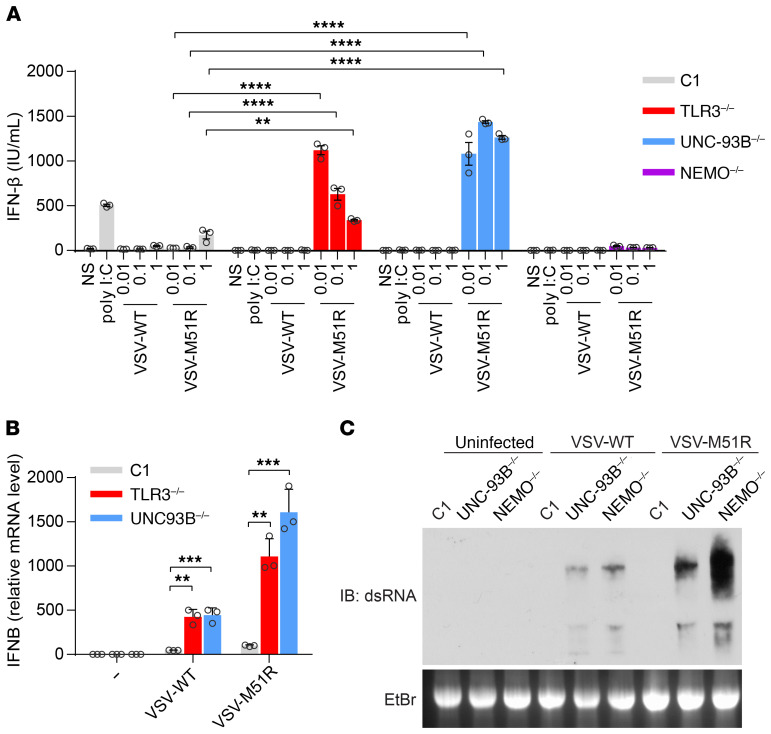
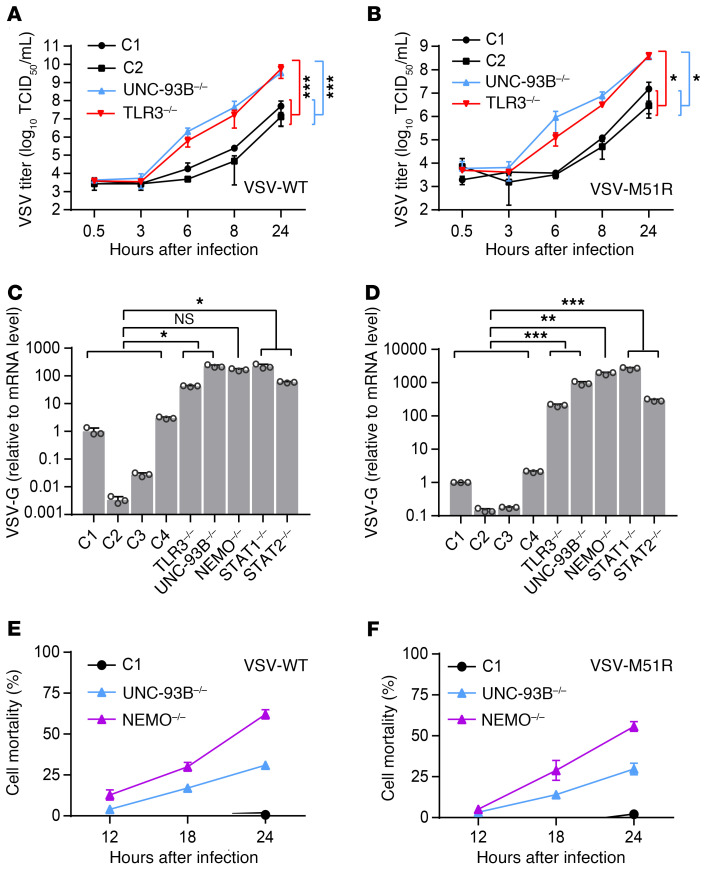
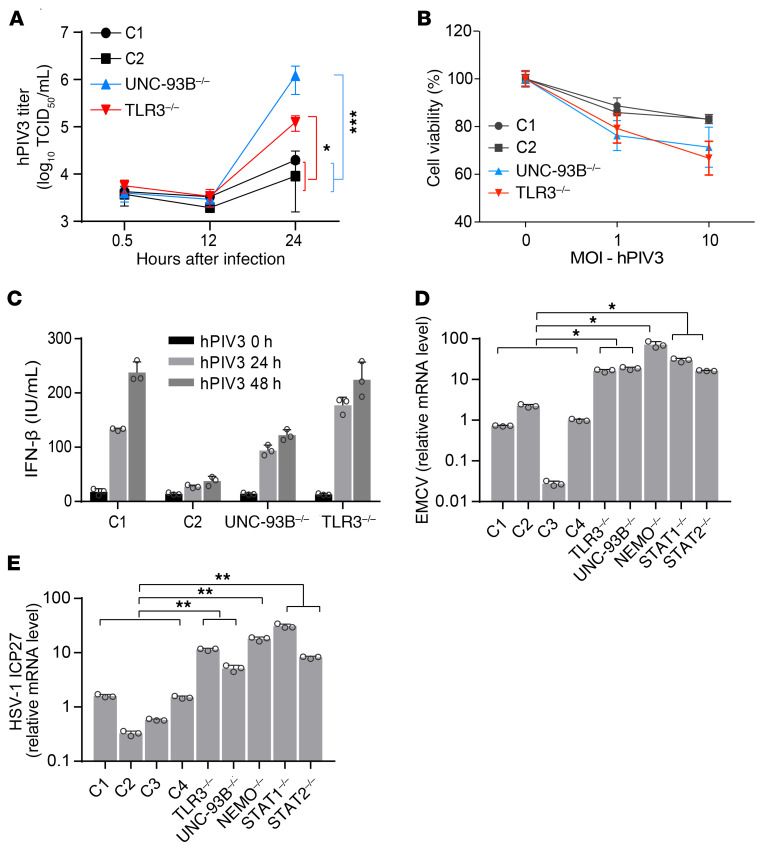
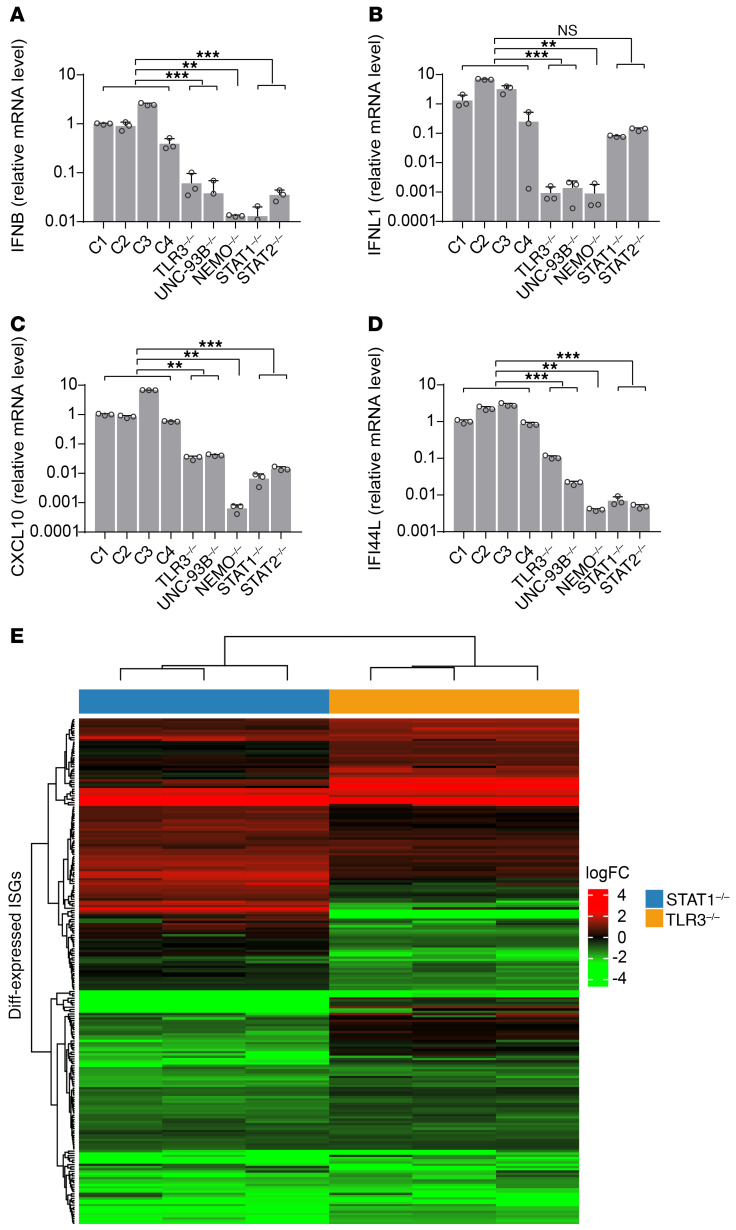
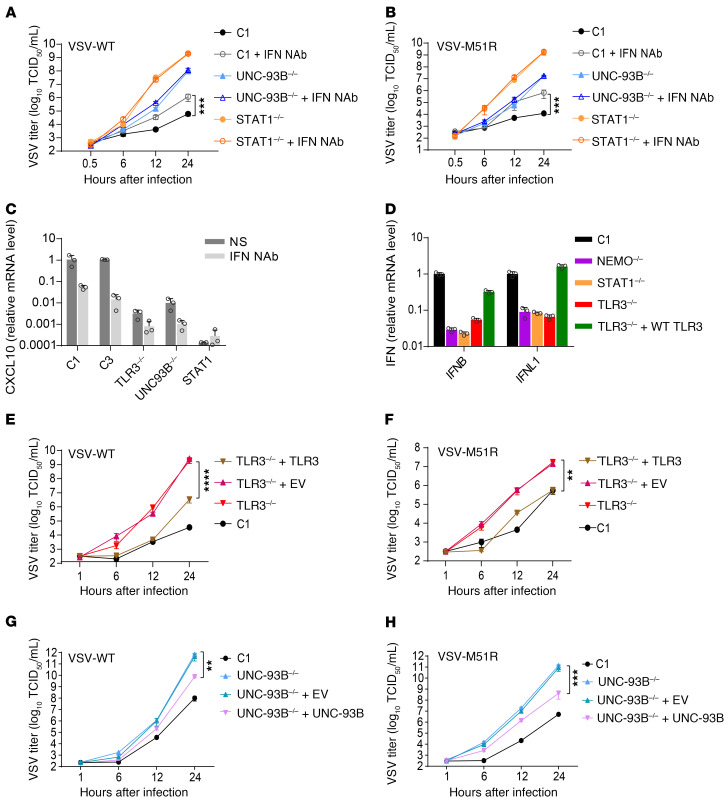
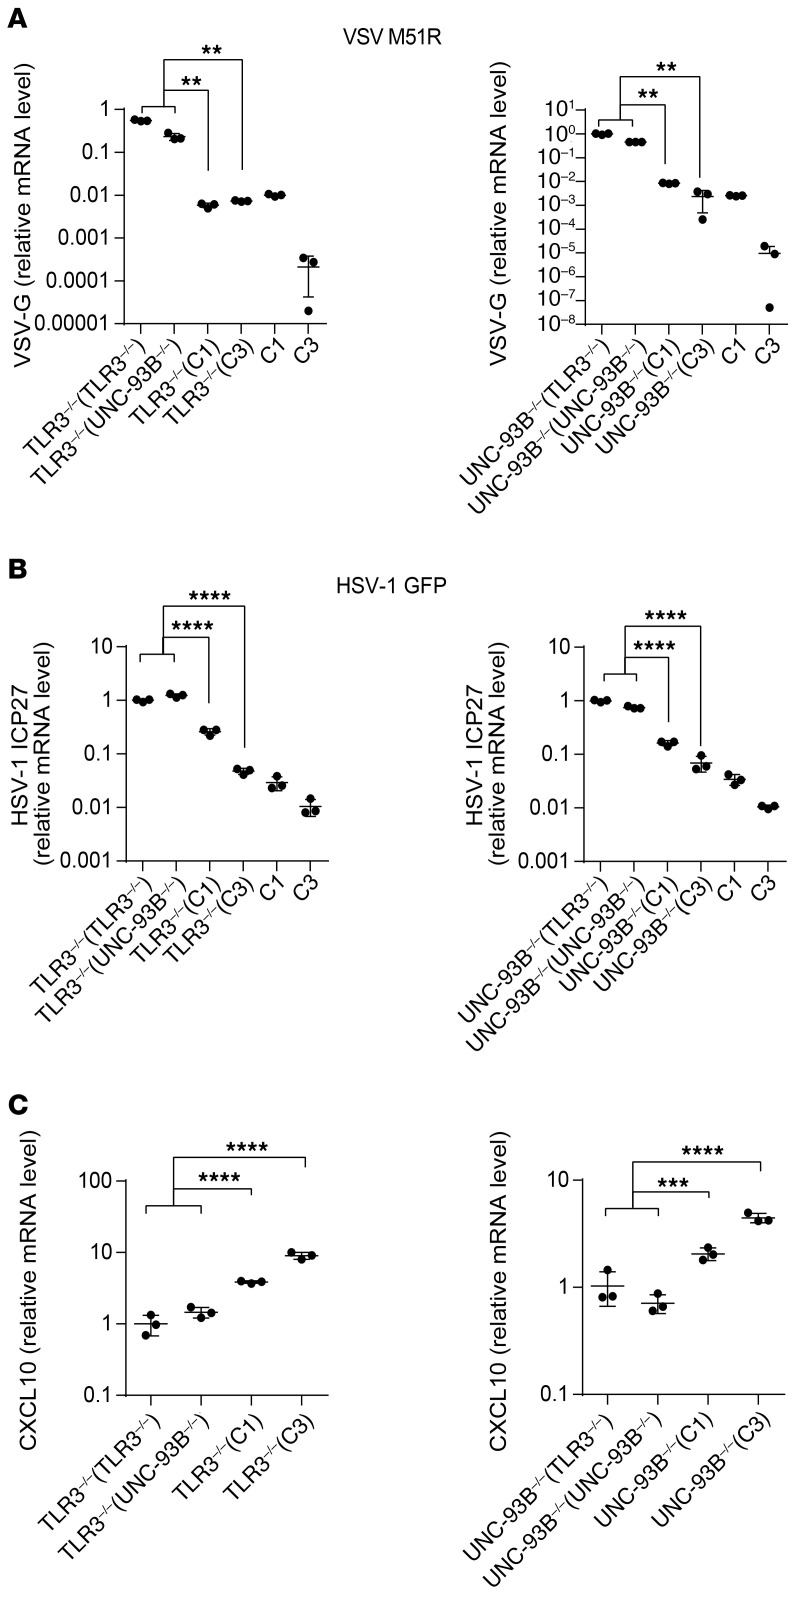
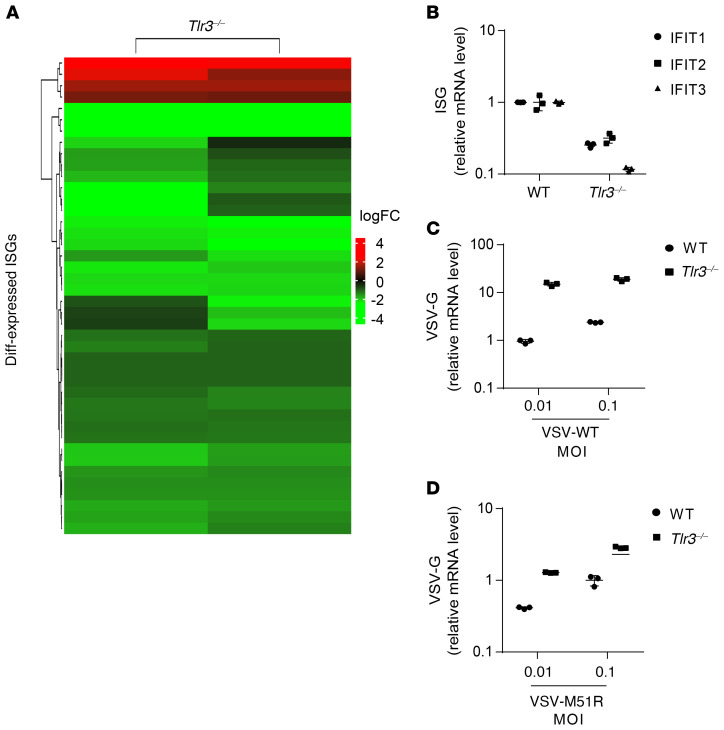
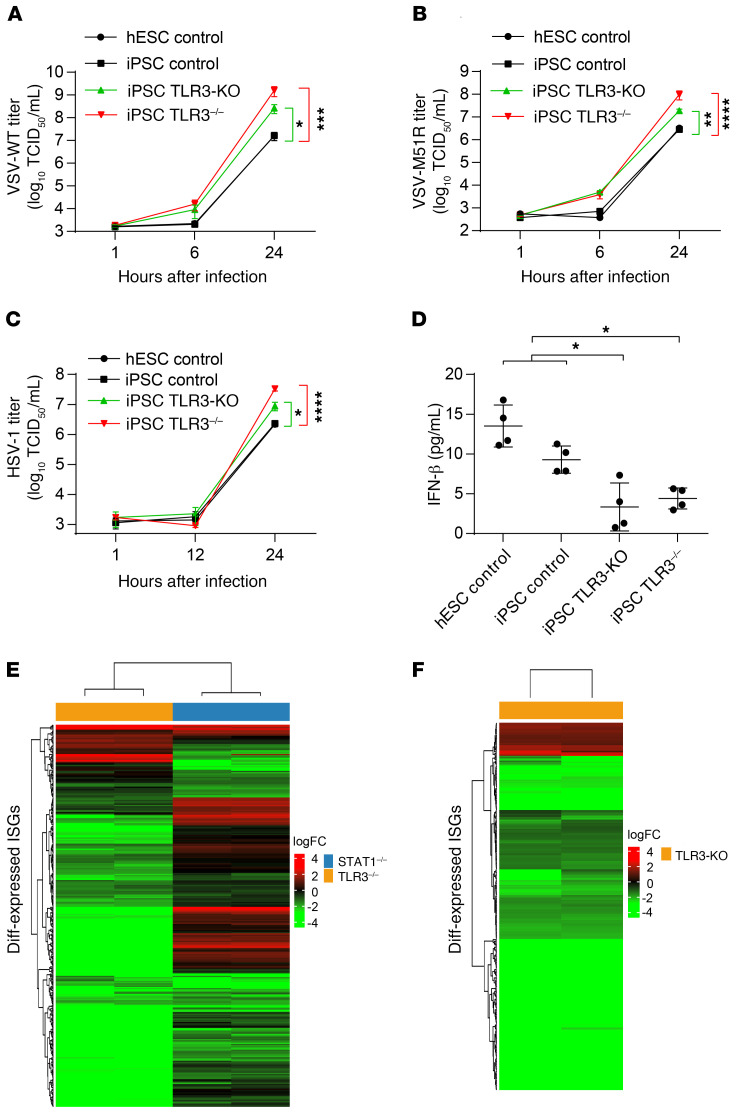
Human herpes simplex virus 1 (HSV-1) encephalitis can be caused by inborn errors of the TLR3 pathway, resulting in impairment of CNS cell-intrinsic antiviral immunity. Deficiencies of the TLR3 pathway impair cell-intrinsic immunity to vesicular stomatitis virus (VSV) and HSV-1 in fibroblasts, and to HSV-1 in cortical but not trigeminal neurons. The underlying molecular mechanism is thought to involve impaired IFN-α/β induction by the TLR3 recognition of dsRNA viral intermediates or by-products. However, we show here that human TLR3 controls constitutive levels of IFNB mRNA and secreted bioactive IFN-β protein, and thereby also controls constitutive mRNA levels for IFN-stimulated genes (ISGs) in fibroblasts. Tlr3-/- mouse embryonic fibroblasts also have lower basal ISG levels. Moreover, human TLR3 controls basal levels of IFN-β secretion and ISG mRNA in induced pluripotent stem cell-derived cortical neurons. Consistently, TLR3-deficient human fibroblasts and cortical neurons are vulnerable not only to both VSV and HSV-1, but also to several other families of viruses. The mechanism by which TLR3 restricts viral growth in human fibroblasts and cortical neurons in vitro and, by inference, by which the human CNS prevents infection by HSV-1 in vivo, is therefore based on the control of early viral infection by basal IFN-β immunity.

Keywords: Immunology; Infectious disease; Innate immunity.


Conflict of interest statement

Conflict of interest: The authors have declared that no conflict of interest exists.

Figures

Figure 1
Figure 1. Paradoxical IFN response to VSV-M51R infection in fibroblasts with TLR3 signaling deficiencies.
(A) IFN-β production in SV-40–transformed dermal fibroblasts (SV-40 fibroblasts) left nonstimulated (NS), treated with poly(I:C), or infected with VSV-WT (WT) or VSV-M51R mutant at various MOIs (0.01, 0.1, 1) for 24 hours, as measured by ELISA. C1 is a healthy control. (B) IFN-β mRNA levels in fibroblasts left NS or infected for 24 hours with VSV-WT or -M51R at a MOI of 1. β-glucuronidase mRNA levels were used for normalization. The error bars indicate SD of biological triplicates from 3 independent experiments. P values were obtained for 1-way ANOVA and subsequent Tukey’s multiple comparison tests. (C) dsRNA from VSV-WT– and VSV-M51R–infected fibroblasts, visualized by electrophoresis in 1.5% agar gels, blotting onto nylon membranes and incubation with a monoclonal antibody against dsRNA. Ethidium bromide (EtBr) staining of the agar gel is shown as a loading control. Data from 3 independent experiments are shown. **P < 0.01, ***P < 0.001, ****P < 0.0001.
Figure 2
Figure 2. Unrestricted virus growth and cytotoxicity in fibroblasts with TLR3 signaling deficiencies.
VSV-WT (A) and VSV-M51R (B) single-cycle replication curves for fibroblasts from healthy controls (C1 and C2) and patients with UNC-93B or TLR3 deficiency at a MOI of 1 over 24 hours. Control fibroblasts (C1–C4) and TLR3–/–, UNC93B–/–, NEMO–/–, STAT1–/–, and STAT2–/– fibroblasts were infected with VSV-WT (C) and VSV-M51R (D) at a MOI of 0.01 for 16 hours. Viral VSV-G RNA levels were then determined by RT-qPCR and normalized against C1. Cell mortality following infection with VSV-WT (E) and VSV-M51R (F) at a MOI of 1 for C1, UNC-93B–/–, and NEMO–/– fibroblasts, as measured by the release of lactate dehydrogenase (LDH) at the times indicated, in hours postinfection (hpi). Values are expressed relative to those for uninfected cells. Triplicate measurements from 3 independent experiments (AB, EF) or representative results from 3 independent experiments (CD) are shown. The error bars indicate SD of biological triplicates. P values were obtained through log transformation followed by 1-way ANOVA and subsequent Tukey’s multiple comparison tests (AB) or likelihood ratio tests (CD), by comparing each patient’s fibroblasts with control fibroblasts, and the respective P value is indicated. *P < 0.05, **P < 0.01, ***P < 0.001.
Figure 3
Figure 3. High susceptibility to different viruses in TLR3 signaling–deficient cells.
(A) hPIV3 single-cycle replication curves in fibroblasts from healthy controls (C1 and C2) and patients with UNC-93B or TLR3 deficiency over 24 hours. (B) Viability of fibroblasts 48 hours after infection with hPIV3 at the indicated MOIs. (C) IFN-β production, measured by ELISA, after 24 or 48 hours of infection with hPIV3 in C1, C2, UNC-93B–/–, and TLR3–/– fibroblasts. Control fibroblasts (C1–C4) and TLR3–/–, UNC93B–/–, NEMO–/–, STAT1–/–, and STAT2–/– fibroblasts were infected with EMCV (D) or HSV-1-GFP (E) at a MOI of 0.01 for 16 hours. Viral RNA levels were then quantified by RT-qPCR, with normalization against the values for C1. Triplicate measurements from 3 independent experiments (AC) or representative results from 3 independent experiments (DE) are shown. The error bars indicate SD of biological triplicates. P values were obtained through log transformation followed by 1-way ANOVA and subsequent Tukey’s multiple comparison tests (A) or likelihood ratio tests, by comparing each patient’s fibroblasts with control fibroblasts (D, E), and the respective P values are indicated. *P < 0.05, **P < 0.01 ***P < 0.001.
Figure 4
Figure 4. Impact of TLR3 signaling deficiencies on basal IFN-related gene expression.
mRNA levels of IFNB (A), IFNL1 (B), CXCL10 (C), and IFI44L (D) (relative to GAPDH) in unstimulated fibroblasts from healthy controls (C1–C4) and individuals deficient for TLR3-IFN signaling, as quantified by RT-qPCR with normalization against C1. Representative data from 3 independent experiments are shown. The error bars indicate SDs of triplicate measurements. (E) Gene expression profile of the ISGs differentially expressed in patients with STAT1 (blue bar) and TLR3 (orange bar) deficiencies, relative to mean expression levels in controls, as assessed by RNA-Seq. The heatmap shows the log fold-change in ISG expression, with red indicating upregulation and green downregulation. P values were obtained for likelihood ratio tests by comparing each patient’s fibroblasts with control fibroblasts (AD), and the respective P values are indicated. **P < 0.01, ***P < 0.001.
Figure 5
Figure 5. Constitutive IFN-β production in fibroblasts is TLR3 dependent.
Replication of VSV-WT (A) and VSV-M51R (B) in fibroblasts from a healthy control (C1) or patients with UNC-93B or STAT1 deficiency, cultured in the presence or absence of neutralizing antibodies against IFN-α, -β, and -λ (IFN Nab). (C) CXCL10 mRNA levels in unstimulated fibroblasts after treatment with IFN NAb for 24 hours. (D) IFN-β and IFN-λ1 (IL-29) mRNA levels in TLR3–/– fibroblasts transfected with WT TLR3, measured by RT-qPCR and normalized against GUS expression. Replication of VSV-WT (E) and VSV-M51R (F) in TLR3–/– fibroblasts stably transfected with empty vector (+EV) or WT TLR3 (+TLR3). Replication of VSV-WT (G) and VSV-M51R (H) in UNC-93B–/– fibroblasts stably transfected with empty vector or WT UNC-93B (+UNC-93B). Representative results are shown for 3 (A, B, EH) or 2 (CD) independent experiments. The error bars indicate SDs of biological triplicates (C, D) or the SEM of biological triplicates (A, B, EH). P values were obtained through log transformation followed by 1-way ANOVA and subsequent Tukey’s multiple comparison tests, and the respective P values are indicated. **P < 0.01, ***P < 0.001, ****P < 0.0001.
Figure 6
Figure 6. TLR3-dependent constitutive IFN-β production restricts VSV growth.
(A) TLR3–/– (left panel) and UNC93B–/– (right panel) fibroblasts were subjected to pretreatment with conditioned medium from unstimulated cell cultures (as indicated in parentheses) for 18 hours and infected with VSV-M51R for 24 hours. VSV-G mRNA levels were then assessed by RT-qPCR, with normalization against GAPDH. (B) Similar to A, except that HSV-1 GFP was used to infect cells and ICP27 mRNA levels were measured by RT-qPCR. (C) TLR3–/– (left panel) and UNC93B–/– (right panel) fibroblasts were treated with conditioned medium, as indicated in parentheses, for 24 hours and CXCL10 expression was then quantified by RT-qPCR. The error bars indicate SDs of biological triplicates from 3 independent experiments. P values were obtained for likelihood ratio tests, by comparing each patient’s fibroblasts treated with conditioned medium from control or patient fibroblasts, and the respective P values are indicated. **P < 0.01, ***P < 0.001, ****P < 0.0001.
Figure 7
Figure 7. TLR3 ablation decreases ISG expression and increases vulnerability to viruses in MEFs.
(A) Gene expression profile of all differentially expressed ISGs in Tlr3–/– MEFs relative to mean levels in WT mice, as assessed by RNA-Seq. The heatmap shows the log fold-changes of ISG gene expression, with red indicating upregulation and green downregulation. (B) ISG expression was assessed in unstimulated WT and Tlr3–/– MEFs, by RT-qPCR with normalization against RPL19. WT and Tlr3–/– MEFs were infected with VSV-WT (C) and VSV-M51R (D) for 24 hours. Viral RNA levels were then quantified by RT-qPCR, with normalization against RPL19. The error bars indicate SDs of technical triplicates.
Figure 8
Figure 8. TLR3 controls basal IFN-β and antiviral immunity in cortical neurons.
HPSC-derived cortical neurons from 2 control lines (hESC control, iPSC control), a CRISPR/Cas9-mediated TLR3 knockout (TLR3-KO) line, and a TLR3–/– patient line were infected with VSV-WT (A), VSV-M51R (B), or HSV-1 (C) for the indicated times. Viral replication was assessed in 50% TCID50 assays. (D) IFN-β levels were measured in the culture supernatants of hPSC-derived cortical neurons, by Simoa digital ELISA. (E) Gene expression profile of the ISGs differentially expressed in patients with TLR3 (orange bar) and STAT1 (blue bar) deficiencies, relative to controls, as assessed by RNA-Seq. (F) Gene expression profile of the ISGs differentially expressed in TLR3-KO iPSC-derived cortical neurons, relative to parental control iPSC-derived cortical neurons. The heatmap shows the log fold-change in ISG expression, as assessed from 2 technical duplicates of the RNA-Seq, with red indicating upregulation and green downregulation. The error bars indicate the SEM (AC) or SDs (D) of biological triplicates from 3 independent experiments. P values were obtained with (AC) or without (D) log transformation followed by 1-way ANOVA and subsequent Tukey’s multiple comparison tests, by comparing TLR3–/– or TLR3-KO cortical neurons with controls, and the respective P values are indicated. *P < 0.05, **P < 0.01, ***P < 0.001, ****P < 0.0001.

References

    1. Alexopoulou L, Holt AC, Medzhitov R, Flavell RA. Recognition of double-stranded RNA and activation of NF-kappaB by Toll-like receptor 3. Nature. 2001;413(6857):732–738. doi: 10.1038/35099560. - DOI - PubMed
    1. Beutler BA. TLRs and innate immunity. Blood. 2009;113(7):1399–1407. doi: 10.1182/blood-2008-07-019307. - DOI - PMC - PubMed
    1. Kawai T, Akira S. The role of pattern-recognition receptors in innate immunity: update on Toll-like receptors. Nat Immunol. 2010;11(5):373–384. doi: 10.1038/ni.1863. - DOI - PubMed
    1. Stetson DB, Medzhitov R. Type I interferons in host defense. Immunity. 2006;25(3):373–381. doi: 10.1016/j.immuni.2006.08.007. - DOI - PubMed
    1. De Tiège X, Rozenberg F, Héron B. The spectrum of herpes simplex encephalitis in children. Eur J Paediatr Neurol. 2008;12(2):72–81. doi: 10.1016/j.ejpn.2007.07.007. - DOI - PubMed

Publication types

MeSH terms