. 2021 Dec;15(1):1-17.
doi: 10.1080/19336918.2020.1868694.

Keratin 19 maintains E-cadherin localization at the cell surface and stabilizes cell-cell adhesion of MCF7 cells

Affiliations

Keratin 19 maintains E-cadherin localization at the cell surface and stabilizes cell-cell adhesion of MCF7 cells

Sarah Alsharif et al. Cell Adh Migr. 2021 Dec.

Abstract

A cytoskeletal protein keratin 19 (K19) is highly expressed in breast cancer but its effects on breast cancer cell mechanics are unclear. In MCF7 cells where K19 expression is ablated,we found that K19 is required to maintain rounded epithelial-like shape and tight cell-cell adhesion. A loss of K19 also lowered cell surface E-cadherin levels. Inhibiting internalization restored cell-cell adhesion of KRT19 knockout cells, suggesting that E-cadherin internalization contributed to defective adhesion. Ultimately, while K19 inhibited cell migration and invasion, it was required for cells to form colonies in suspension. Our results suggest that K19 stabilizes E-cadherin complexes at the cell membrane to maintain cell-cell adhesion which inhibits cell invasiveness but provides growth and survival advantages for circulating tumor cells.

Keywords: Intermediate filaments; adherens junction; breast cancer; cell migration; cell morphology; cell-cell adhesion; keratin; keratin 19; metastasis.


Conflict of interest statement

The authors declare no conflict of interest.

Figures
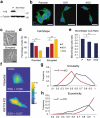
Figure 1.
Figure 1.
Keratin 19 knockout cells display an elongated phenotype. (a) Whole cell lysates of parental (p) control and two different clones (KO1 and KO2) of KRT19 KO cell lines were harvested, and immunoblotting was performed with antibodies against the indicated proteins. Molecular weights in kDa. (b) Immunostaining of K18 (green) in P and KRT19 KO cells. Nuclei are shown in blue. Bar, 20 µm. (c) Phase-contrast images of representative rounded and elongated shapes. Bar, 20 µm. (d) Percentages of P and KRT19 KO cells with rounded or elongated cell shape. Data from three experimental repeats are shown as mean ± SEM. Student’s t-test: *p < 0.05; **p < 0.001. Chi-square test: p < 0.001. (e) Minor/Major axis ratios of P and KRT19 KO cells. Data from four experimental replicates are shown as mean ± SEM. Student’s t-test: *p < 0.05; **p < 0.001. (f) Phase pseudoheight maps of P and KRT19 KO (KO2) cells collected by digital holographic microscopy (DHM). Sum of squared deviation (SSD) shows the distance of individual cells from the population mean. Representative P and KRT19 KO cells with the smallest SSD of 17 phase parameters collected shown. A color bar indicates cell phase height. Bar, 10 µm. Histograms of (g) circularity and (h) eccentricity of P and KRT19 KO cells from DHM analyses
Figure 2.
Figure 2.
Weakened cell-cell adhesion in KRT19 KO cells. (a) Phase-contrast images of representative cells engaged in high, medium and low adhesions. Arrows indicate high cell-cell adhesions and arrowheads indicate low cell-cell adhesions. Bar, 20 µm. (b) Percentage of parental (p) control and KRT19 KO cells in high, medium or low adhesions. Data from five experimental repeats are shown as mean ± SEM. Student’s t-test: *p < 0.05; **p < 1 × 0.001. Chi-square test: p < 0.0001. (c) Phase-contrast images of cell clusters formed by P and KRT19 KO cells. Arrows indicate high cell-cell adhesions and arrowheads indicate low cell-cell adhesions. Bar, 20 µm. (d) Number of cells per cluster. Clusters classified into three different ranges: 2–3 cells/cluster; 4–5 cells/cluster; and >6 cells/cluster. Data from three experimental repeats are shown as mean ± SEM. Any statistically significant difference between P and KRT19 KO cells is denoted by * (p < 0.05, Student’s t-test) above the cluster of KRT19 KO cells. Chi-square test: p < 0.0001. (e) Ratio of cell-cell contact length to cell perimeter per cell. Data from four experimental repeats normalized to that of the parental control are shown as mean ± SEM. Student’s t-test: *p < 0.05; **p < 1 × 0.001. (f) Monolayer fragment numbers of P and KRT19 KO cells from the dispase assay. Data from three experimental repeats, each with three replicates, are shown as mean ± SEM. Student’s t-test: *p < 0.05
Figure 3.
Figure 3.
Defective regulation of E-cadherin in KRT19 KO cells. (a) Whole cell lysates of parental (p) control and KRT19 KO cells were prepared and immunoblotting was performed with indicated antibodies. Molecular weights in kDa. (b) Signal intensities of plakoglobin, E-cadherin and β-catenin from (A) were quantified and normalized to those of the GAPDH loading control. Data from at least three experimental repeats normalized to that of the parental control are shown as mean ± SEM. Student’s t-test: ns: not significant; *p < 0.05. (c) Immunostaining of E-cadherin (green) in P and KRT19 KO (KO2) cells. Nuclei are shown in blue. Arrows indicate E-cadherin localization. Bar, 20 µm. (d) Streptavidin beads were used to pulldown P and KRT19 KO (KO2) cells either treated (+) or untreated (-) with biotin for cell surface labeling of proteins. Immunoprecipitates and inputs were subjected to SDS-PAGE and immunoblotting was performed with antibodies against the indicated proteins. Molecular weights in kDa. (e) Signal intensities of E-cadherin in immunoprecipitates of biotin-treated samples from (D) were quantified and normalized to those of E-cadherin in input. Data from at least three experimental repeats normalized to that of the parental control are shown as mean ± SEM. Student’s t-test: *p < 0.05. (f) Co-IP of β-catenin with E-cadherin. IP with anti-β-catenin antibody or IgG control was perform in P and KRT19 KO (KO2) cells. Immunoprecipitates and inputs were subjected to SDS-PAGE and immunoblotting was performed with antibodies against the indicated proteins. Molecular weights in kDa. (g) Signal intensities of E-cadherin in IP from (F) were quantified and normalized to those of β-catenin in IP. Data from at least three experimental repeats normalized to that of the parental control are shown as mean ± SEM. Student’s t-test: *p < 0.05. (h) Phase-contrast images of P and KRT19 KO (KO2) cells. Cells were either grown in normal growth condition (Normal media), placed in calcium-free media for 6 h, then left unstimulated (-Calcium) or stimulated (+Calcium) with CaCl2 for 4 h. Arrows indicate high cell-cell adhesions and arrowheads indicate low cell-cell adhesions. Bar, 20 µm
Figure 4.
Figure 4.
Inhibiting internalization rescues cell-cell adhesion of KRT19 KO cells. Parental and KRT19 KO (KO2) cells were either (a) incubated with labeled transferrin (red) for 30 min, then immunostained for E-cadherin (green) or (b) co-immunostained for E-cadherin (green) and LAMP1 (red). Arrows indicate colocalization between E-cadherin and transferrin. Nuclei are shown in blue. Insets: areas in KRT19 KO cells rich in E-cadherin localization. Bar, 20 µm. (c) Parental and KRT19 KO (KO2) cells treated with dynamin inhibitor (Dynasore) or DMSO control for 2 h were subjected to dispase assay. Data from at least three experimental repeats, each with three replicates, are shown as mean ± SEM. Student’s t-test: ns: not significant; *p < 0.05. (d) Schematic of how K19 influences E-cadherin localization. While E-cadherin is localized to cell surface in the presence of K19 (left panel), it is internalized and accumulated in early/recycling endosomes in the absence of K19 (right panel)
Figure 5.
Figure 5.
K19 re-expression rescues defects associated with KRT19 KO cells. (a) KRT19 KO (KO2) cells stably expressing GFP or GFP-K19 were co-immunostained for GFP (green) and F-actin (red). Nuclei are shown in blue. Bar, 20 µm. (b) Percentage of cells from (A) with rounded or elongated cell shape. Data from five experimental repeats are shown as mean ± SEM. N = 74 for GFP-expressing cells and N = 115 for GFP-K19-expressing cells. Student’s t-test: *p < 0.005. Chi-square test: p < 0.0001. (c) Number of monolayer fragments formed by KRT19 KO (KO2) cells stably expressing vector control (v) or K19 from the dispase assay. Data from at least three experimental repeats, each with three replicates, are shown as mean ± SEM. Student’s t-test: *p < 0.05. (d) Whole cell lysates of KRT19 KO (KO2) cells stably expressing vector control (V) or K19 were prepared and immunoblotting was performed with indicated antibodies. Molecular weights in kDa. (e) Signal intensities of plakoglobin and E-cadherin from (D) were quantified and normalized to those of the GAPDH loading control. Data from at least three experimental repeats normalized to that of the vector control are shown as mean ± SEM. Student’s t-test: *p < 0.05. (f) Co-IP of β-catenin with E-cadherin in KRT19 KO (KO2) cells stably expressing GFP or GFP-K19. IP with anti-β-catenin antibody or IgG control was perform. Immunoprecipitates and inputs were subjected to SDS-PAGE and immunoblotting was performed with antibodies against the indicated proteins. Molecular weights in kDa. Signal intensities of E-cadherin in IP from were quantified and normalized to those of β-catenin in IP and GFP control
Figure 6.
Figure 6.
K19 inhibits cell migration and invasion. (a) Wound closure of parental (p) control and KRT19 KO cells. Phase-contrast images of wound area at 0 and 30 h after scratch. Bar, 0.5 mm. (b) Wound areas from (A) were quantitated using the ImageJ software and normalized to that at 0 h. (c) Wound closure of KRT19 KO (KO2) cells stably expressing vector control (v) or K19. Wound areas were quantitated using the ImageJ software and normalized to that at 0 h. Transwell migration of (d) P and KRT19 KO (KO2) cells or (e) KRT19 KO (KO2) cells stably expressing GFP or GFP-K19 in the presence of either 0.1 or 10% serum as chemoattractant. Transwell invasion of (f) parental and KRT19 KO (KO2) cells or (g) KRT19 KO (KO2) cells stably expressing GFP or GFP-K19 in the presence of either 0.1 or 10% serum as chemoattractant. Migrated/invaded cells were identified either by staining nuclei with propidium iodide or using GFP signals under a fluorescent microscope. For (d-g), Number of migrated or invaded cells per high-power field were quantified the ImageJ software. For (b-g), data from three experimental repeats, each with three replicates, are shown as mean ± SEM. Student’s t-test: ns: not significant; * p < 0.05; **p < 1 × 0.005
Figure 7.
Figure 7.
K19 is required for the anchorage-independent growth of MCF7 cells. (a) Mammosphere formation of parental (p) control and KRT19 KO cells. Phase-contrast images of mammospheres grown in ultra-low attachment plates for 7 days. Bar, 100 µm. (b) Mammosphere areas from (A) were quantitated using the ImageJ software. (c) Phase contrast and immunofluorescence images of mammospheres formed by KRT19 KO (KO2) cells stably expressing GFP or GFP-K19 in ultra-low attachment plates. Bar, 100 µm. (d) Mammosphere areas from (C) were quantitated using the ImageJ software. (e) Anchorage-independent growth of P and KRT19 KO cells. Phase-contrast images of colonies grown in soft agar for 7 days. Bar, 200 µm. (f) Colony areas from using (E) were quantitated using the ImageJ software. (g) KRT19 KO (KO2) cells stably expressing GFP or GFP-K19 in soft agar for 7 days and colony areas were measured using the ImageJ software. For (B), (D), (F) and (G), data from three experimental repeats, each with three replicates, are shown as mean ± SEM. Student’s t-test: * p < 0.05; **p < 0.001

References

    1. Hanahan D, Weinberg RA.. The hallmarks of cancer. Cell. 2000;100(1):57–70. - PubMed
    1. Gupta GP, Massagué J. Cancer metastasis: building a framework. Cell. 2006;127(4):679–695. - PubMed
    1. Dillekås H, Rogers MS, Straume O. Are 90% of deaths from cancer caused by metastases? Cancer Med. 2019;8(12):5574–5576. - PMC - PubMed
    1. Lambert AW, Pattabiraman DR, Weinberg RA. Emerging biological principles of metastasis. Cell. 2017;168(4):670–691. - PMC - PubMed
    1. Sharma P, Alsharif S, Fallatah A, et al. Intermediate filaments as effectors of cancer development and metastasis: a focus on keratins, vimentin, and nestin. Cells. 2019;8(5):497. - PMC - PubMed

Publication types