. 2021 Jan 4:10:e62810.
doi: 10.7554/eLife.62810.

Defining human mesenchymal and epithelial heterogeneity in response to oral inflammatory disease

Affiliations

Defining human mesenchymal and epithelial heterogeneity in response to oral inflammatory disease

Ana J Caetano et al. Elife. .

Abstract

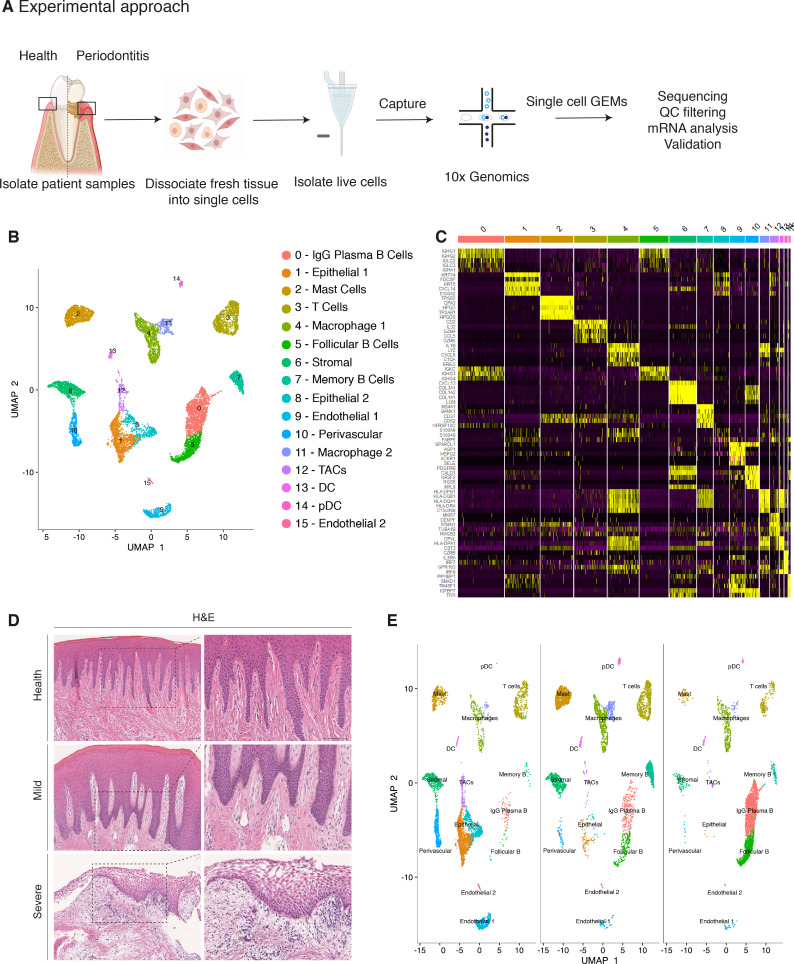
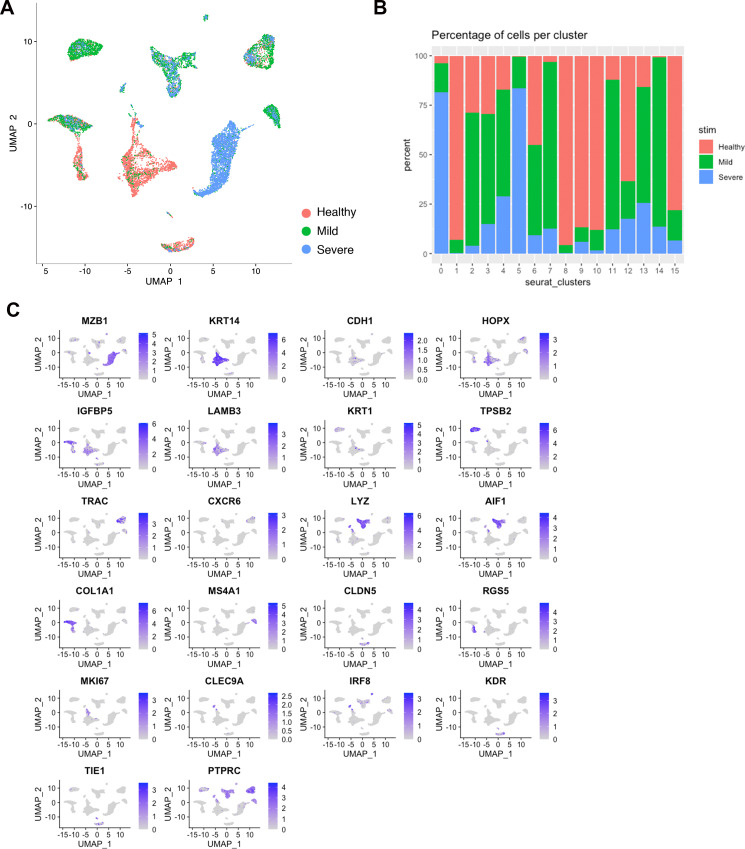
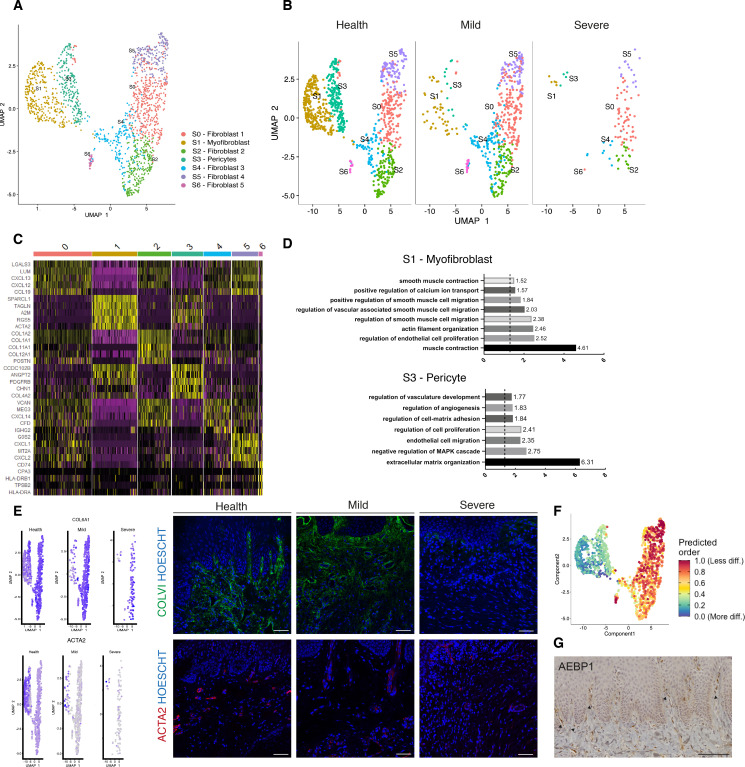
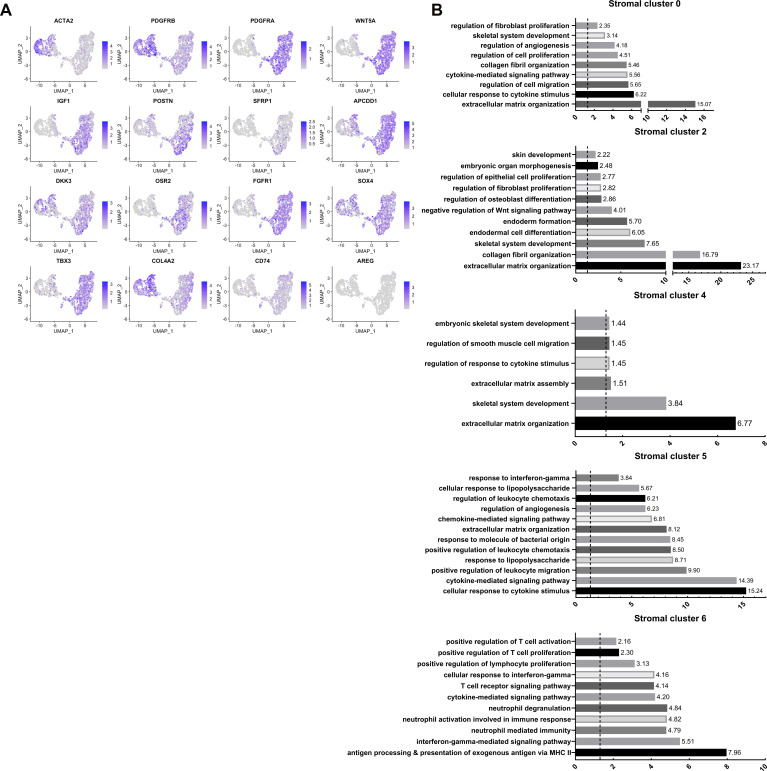
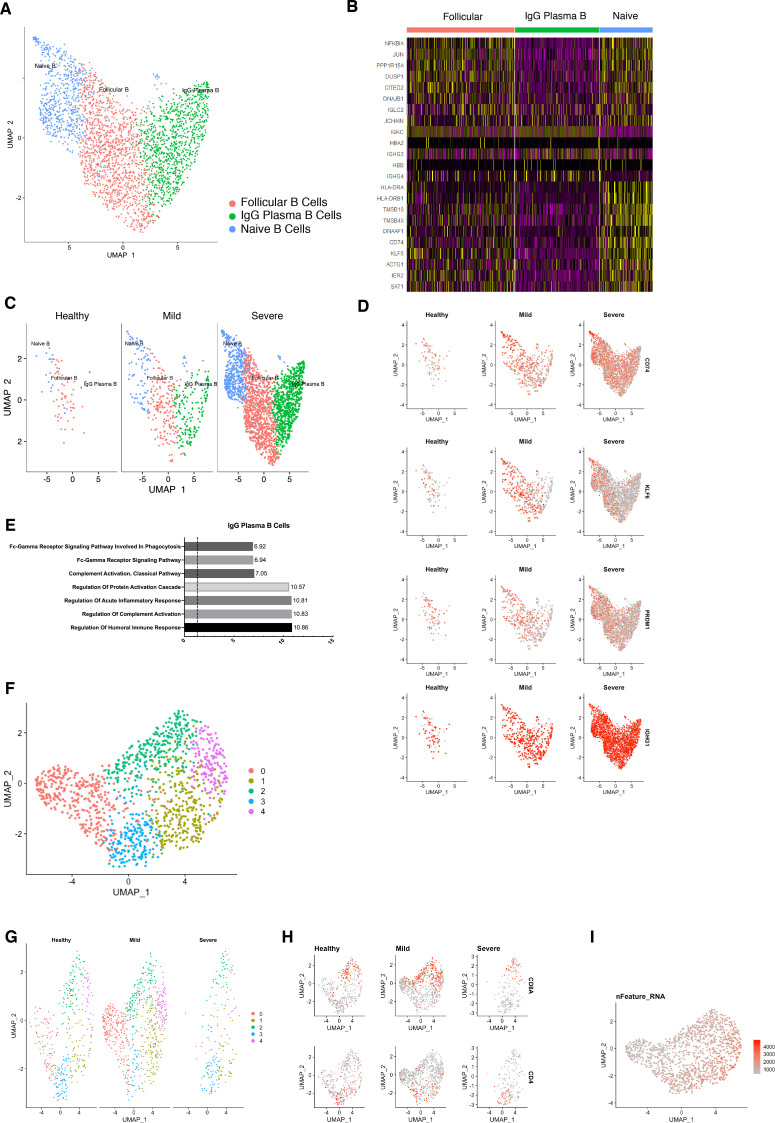
Human oral soft tissues provide the first barrier of defence against chronic inflammatory disease and hold a remarkable scarless wounding phenotype. Tissue homeostasis requires coordinated actions of epithelial, mesenchymal, and immune cells. However, the extent of heterogeneity within the human oral mucosa and how tissue cell types are affected during the course of disease progression is unknown. Using single-cell transcriptome profiling we reveal a striking remodelling of the epithelial and mesenchymal niches with a decrease in functional populations that are linked to the aetiology of the disease. Analysis of ligand-receptor interaction pairs identify potential intercellular hubs driving the inflammatory component of the disease. Our work establishes a reference map of the human oral mucosa in health and disease, and a framework for the development of new therapeutic strategies.

Keywords: cell biology; gingiva; human; oral mucosa; periodontitis; regenerative medicine; stem cells; transcriptomics.


Conflict of interest statement

AC, VY, AV, VB No competing interests declared, ED an employee of Unilever Plc. PS This work was funded by Unilever in the form of a research grant awarded to P.T.S

Figures

Figure 1.
Figure 1.. Single-cell Atlas of Gingiva Biopsies from Healthy Individuals and Periodontitis Patients.
(A) Overview of the experimental workflow. All samples were processed immediately after clinical surgery. (B) scRNA-seq data obtained from healthy and periodontitis cells (n = 12,411) from four donors illustrated by UMAP coloured by cell-type annotation (nHealthy = 4639, nMild = 4401, nSevere = 3367). (C) Heatmap of the mean expression of the most differentially expressed marker genes for each cluster identified. (D) Haematoxylin and eosin staining of gingival sections from healthy, mild, and severe patient samples showing increasing changes in tissue architecture with loss of epithelial rete ridges definition and infiltration of leukocytes. (E) Changes in tissue composition in periodontitis showing UMAP of progressive diseased states from healthy, mild, and severely diseased donors.
Figure 1—figure supplement 1.
Figure 1—figure supplement 1.. Flow Cytometry Gating Strategies on Human Gingival Cells.
Cells were gated based on size using standard SSC-A and FSC-A parameters. Doublets were excluded using SSC-A and SSC-W parameters. Live cells were selected as cells dimly fluorescing in DAPI. Samples were analysed on BD FACS Aria III Fusion machine.
Figure 1—figure supplement 2.
Figure 1—figure supplement 2.. Single-cell profiling of healthy human gingiva datasets using 10x Chromium.
(A) UMAP visualisation of human gingiva clusters from healthy human donors. (B) Scatter plots showing differential expressed genes across the two healthy samples. Panels A-B, n = 2 individuals.
Figure 1—figure supplement 3.
Figure 1—figure supplement 3.. Single-cell profiling of healthy and disease human gingiva using 10x Chromium.
(A) UMAP illustration of scRNA-seq data obtained from healthy and periodontitis cells (n = 12,411) from four donors coloured by condition. (B) Cell subset distributions across conditions. Shown are percentage of cells (y axis) in each cell subset (bars) that are derived from each healthy (orange), mild (green), and severe (blue) samples. X axis represents cluster ID. (C) Feature Plot showing the expression of lineage marker genes used for cell-type classification.
Figure 2.
Figure 2.. Cellular and molecular map of the stromal gingival compartment in health and disease identifies subpopulations with potential role in disease progression.
(A) UMAP plot of gingival stromal cells. Single cells coloured by cluster annotation. (B) UMAP plot of stromal cells during disease progression. (C) Heatmap showing subset-specific markers. (D) GO enrichment terms for S1 (myofibroblast) and S3 (pericyte). -log adjusted p-value shown (dotted line corresponds to FDR = 0.05). (E) Immunofluorescence staining showing COLVI, ACTA2 expression throughout disease progression. Scale bars, 100 μm. n = 3 patient samples/condition. Feature plots showing COLVI and ACTA2 expression across clusters and conditions. (F) UMAP annotated with CytoTRACE analysis to predict stromal stem populations. Transcriptional diversity is used here to predict maturation states. (G) Immunohistochemistry staining showing AEBP1+ cells tissue distribution. Scale bar, 100 μm. n = 6 patient samples.
Figure 2—figure supplement 1.
Figure 2—figure supplement 1.. Re-clustering of human stromal gingival cells in health and disease, Related to Figure 2.
(A) Feature Plots showing the expression of individual genes used for cell-type assignment of different stromal subsets. (B) GO enrichment terms for the different stromal subsets. -log adjusted p-value shown (dotted line corresponds to FDR = 0.05).
Figure 3.
Figure 3.. Cellular and molecular map of the epithelial gingival compartment in health and disease.
(A) UMAP plot of human gingival epithelial cells. Single cells coloured by cluster annotation. (B) UMAP plot of epithelial cells during disease progression. (C) Heatmap showing subset-specific markers. (D) GO enrichment terms for E0, E6, and E8 with -log adjusted p-value shown (dotted line corresponds to FDR = 0.05). (E) Dot plot showing top predicted ligands expressed by epithelial cells that modulate the E0 (stem) compartment. (F) Expression of KI67 and SOX2 in human healthy tissue. KI67 marks proliferative cells (cluster E5), and SOX2 marks an epithelial stem cell compartment (cluster E0). Scale bars = 100 μm (A, B). Scale bars, 50 μm (A’, B’). n = 4 patient samples/condition.
Figure 3—figure supplement 1.
Figure 3—figure supplement 1.. Re-clustering of human epithelial gingival cells in health and disease, Related to Figure 3.
(A) Feature Plots showing the expression of individual genes used for cell-type assignment of different epithelial subsets. (B) GO enrichment terms for the different epithelial subsets. -log adjusted p-value shown (dotted line corresponds to FDR = 0.05).
Figure 4.
Figure 4.. Unbiased cell–cell interaction analysis and its effect in the stromal microenvironment.
(A) Schematic representation of the NicheNet analysis of upstream ligand–receptor pairs and stromal target genes inducing DE genes in periodontitis. Created with BioRender.com. (B) Dot plots depicting which gingival cell populations express top-ranked ligands contributing to the transcriptional response observed from health to mild disease and from mild to severe in the stromal compartment. (C) Schematic representation of the NicheNet analysis of epithelial-mesenchymal crosstalk in mild disease. Created with BioRender.com. (D) Top predicted epithelial ligands driving the stromal inflammatory response and dot plot showing which epithelial subpopulation express these ligands. (E) Ligand-receptor heatmap of potential receptors expressed by stromal cells associated with each epithelial ligand. (F) Ligand-target heatmap of stromal and perivascular target genes of the identified epithelial ligands. (G) Dot plot confirming upregulation of the identified stromal target genes in disease. (H) UMAPs feature plots mapping the identified epithelial ligands and target genes to the respective target genes expressed by stromal cells.
Figure 5.
Figure 5.. Periodontitis induces an IgG plasma B-cell signature in human gingiva.
(A) UMAP analysis of human B cells identifying follicular and IgG plasma B cells split by condition. (B) UMAP expression plots of human B-cell subset markers. Cells coloured by normalised expression of indicated genes. (C) CD79A in human gingival tissue across health and disease. Scale bars, 100 μm. n = 3 patient samples/condition. (D) Gene enrichment analysis of IgG plasma B cells. -log adjusted p-value shown (dotted line corresponds to FDR = 0.05).
Figure 5—figure supplement 1.
Figure 5—figure supplement 1.. Re-clustering of human B and T cells in health and disease.
(A) UMAP plot of B cells in health and disease. (B) Heatmap showing subset-specific markers. (C) UMAP plot of B cells during disease progression. (D) Feature Plots showing the expression of individual genes used for assignment of different B-cell subsets. (E) GO enrichment terms for IgG plasma B cells with -log adjusted p-value shown (dotted line corresponds to FDR = 0.05). (F) UMAP plot of T cells in health and disease. (G) UMAP plot of T cells during disease progression. (H) Feature Plots showing the expression of CD4 and CD8 T-cell subsets. (I) UMAP showing number of detected genes.

References

    1. Abe T, AlSarhan M, Benakanakere MR, Maekawa T, Kinane DF, Cancro MP, Korostoff JM, Hajishengallis G. The B Cell-Stimulatory cytokines BLyS and APRIL are elevated in human periodontitis and are required for B Cell-Dependent bone loss in experimental murine periodontitis. The Journal of Immunology. 2015;195:1427–1435. doi: 10.4049/jimmunol.1500496. - DOI - PMC - PubMed
    1. Abraham SN, John AL. Mast cell-orchestrated immunity to pathogens. Nature Reviews Immunology. 2010;10:440–452. doi: 10.1038/nri2782. - DOI - PMC - PubMed
    1. Akkaya M, Kwak K, Pierce SK. B cell memory: building two walls of protection against pathogens. Nature Reviews Immunology. 2020;20:229–238. doi: 10.1038/s41577-019-0244-2. - DOI - PMC - PubMed
    1. Armulik A, Genové G, Betsholtz C. Pericytes: Developmental, Physiological, and Pathological Perspectives, Problems, and Promises. Developmental Cell. 2011;21:193–215. doi: 10.1016/j.devcel.2011.07.001. - DOI - PubMed
    1. Artese L, Simon MJ, Piattelli A, Ferrari DS, Cardoso LA, Faveri M, Onuma T, Piccirilli M, Perrotti V, Shibli JA. Immunohistochemical analysis of inflammatory infiltrate in aggressive and chronic periodontitis: a comparative study. Clinical Oral Investigations. 2011;15:233–240. doi: 10.1007/s00784-009-0374-1. - DOI - PubMed

Publication types

Associated data