. 2021 Jan 4:10:e63907.
doi: 10.7554/eLife.63907.

A cell atlas of the chick retina based on single-cell transcriptomics

Affiliations

A cell atlas of the chick retina based on single-cell transcriptomics

Masahito Yamagata et al. Elife. .

Abstract

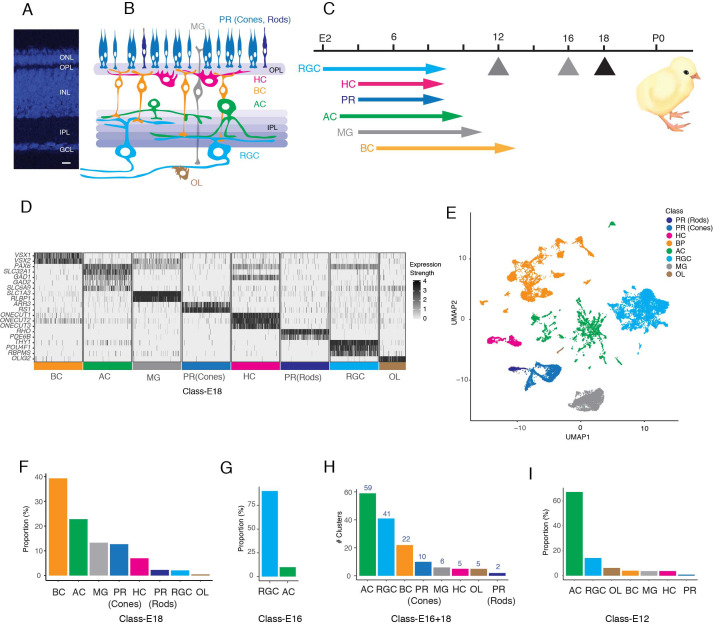
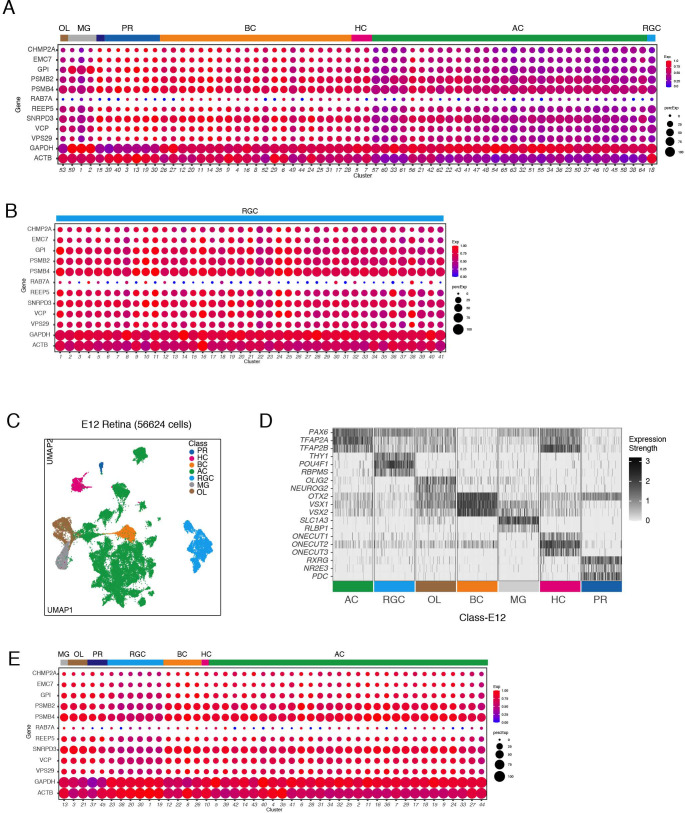
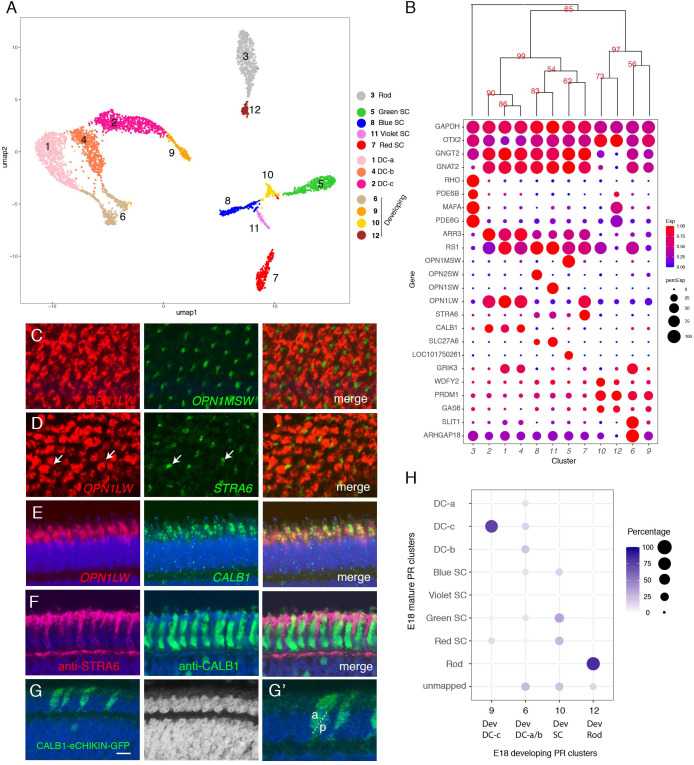
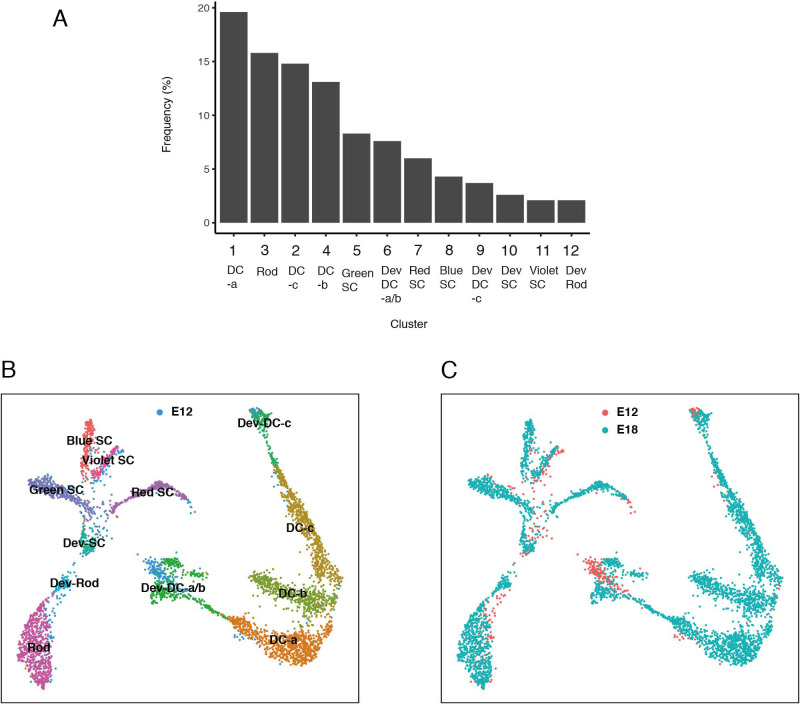
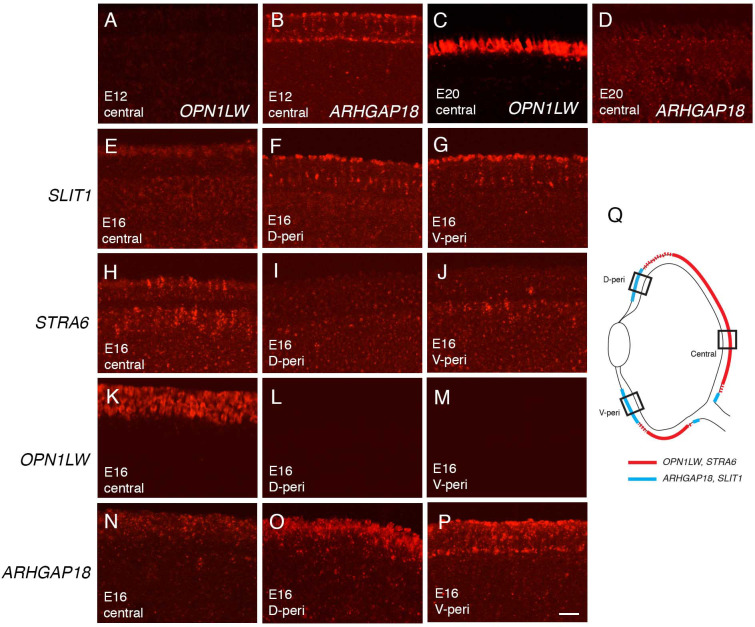
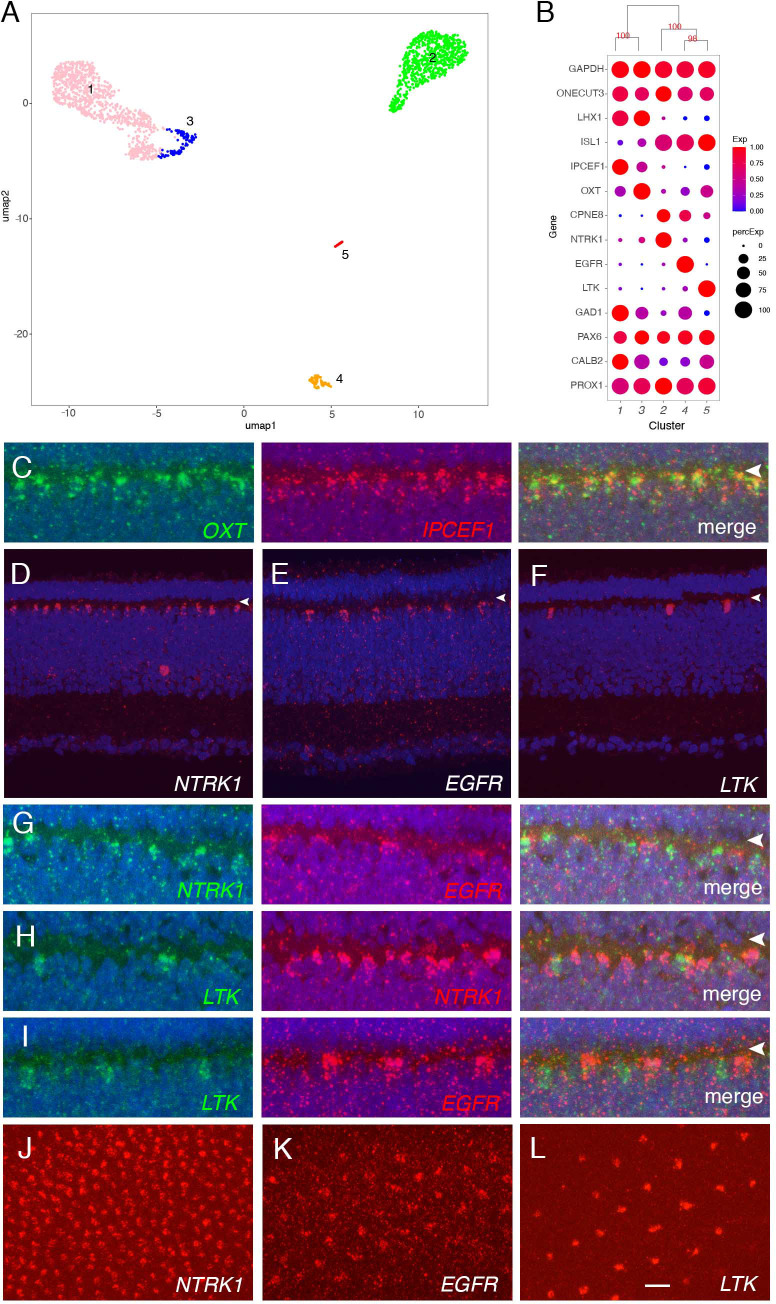
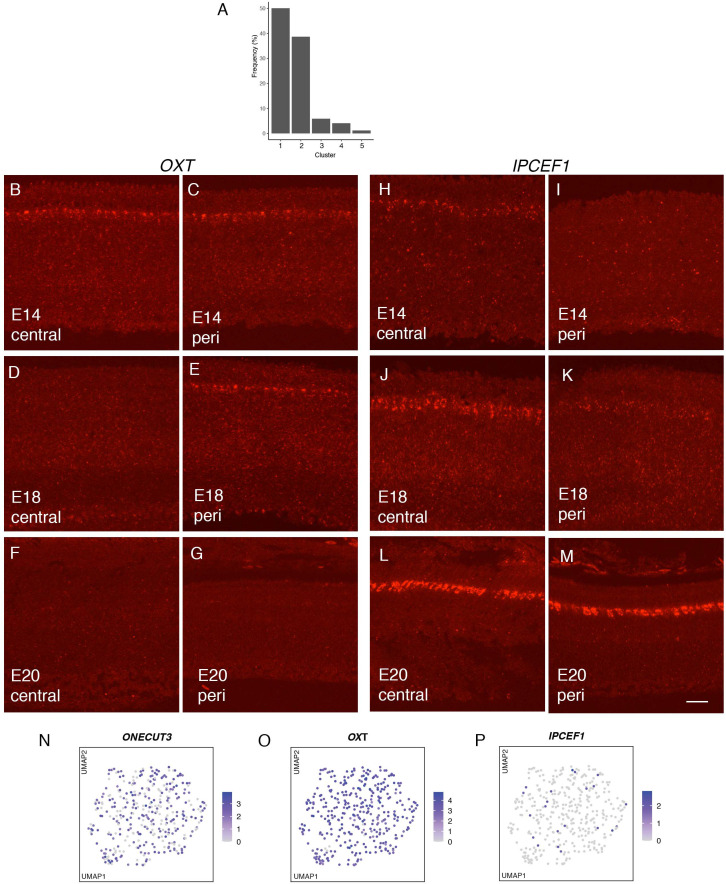
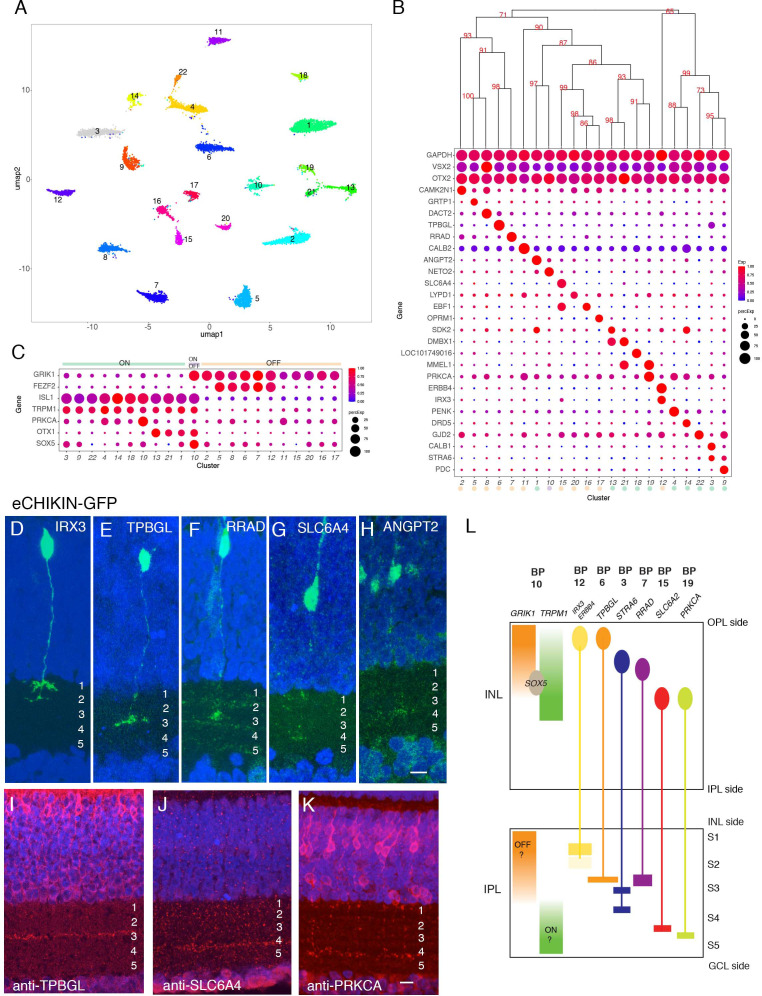
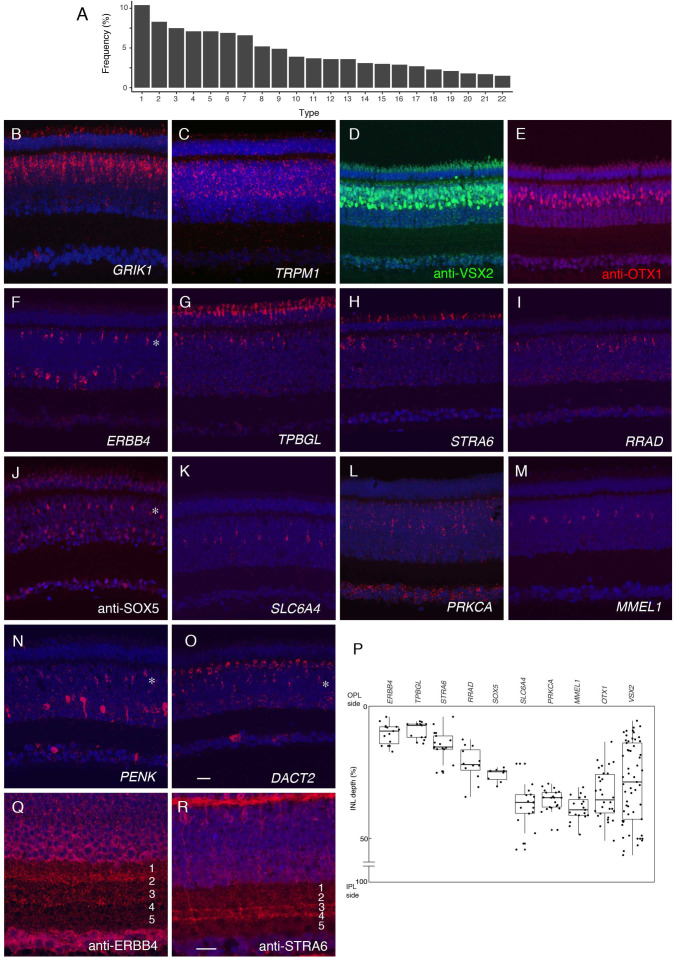
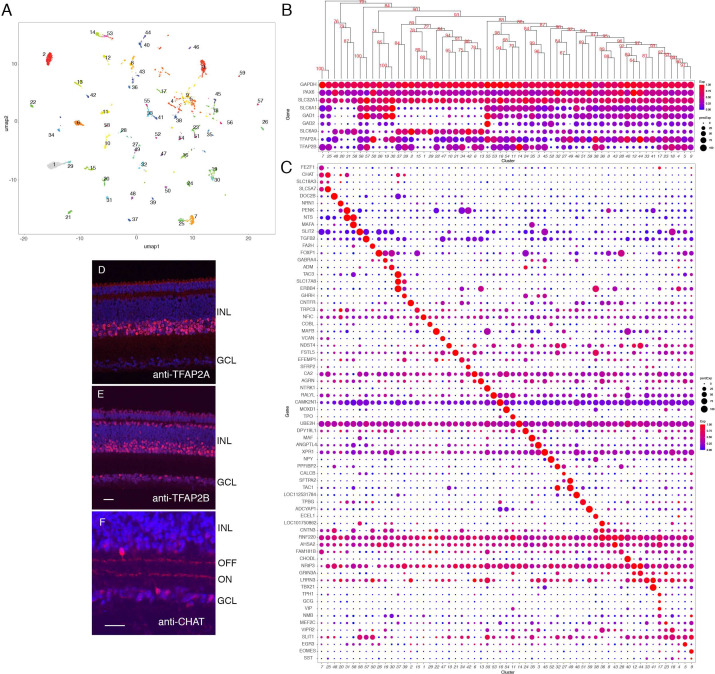
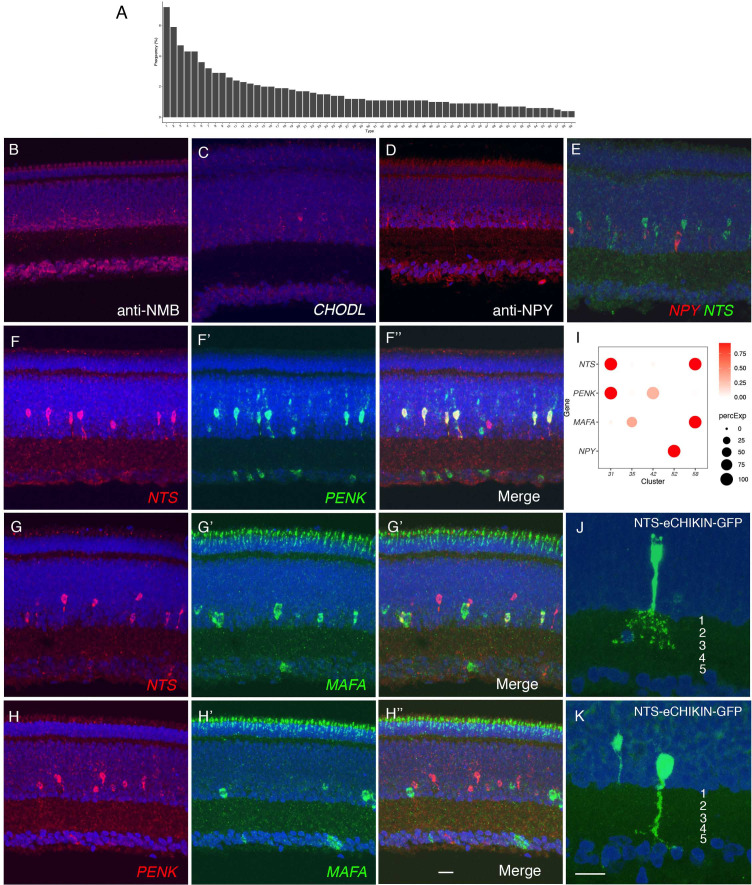
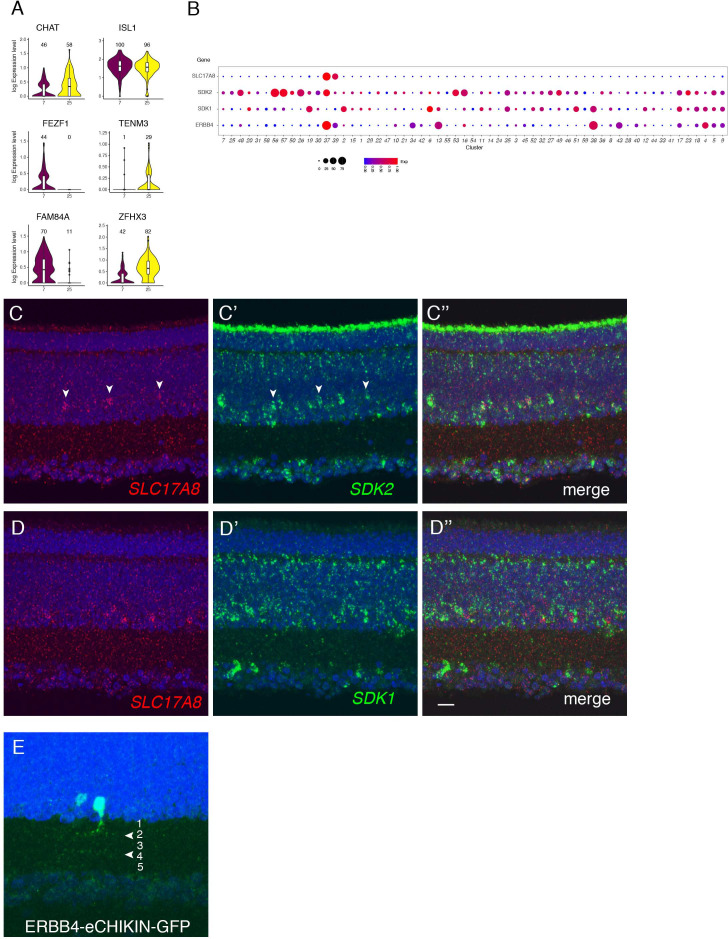
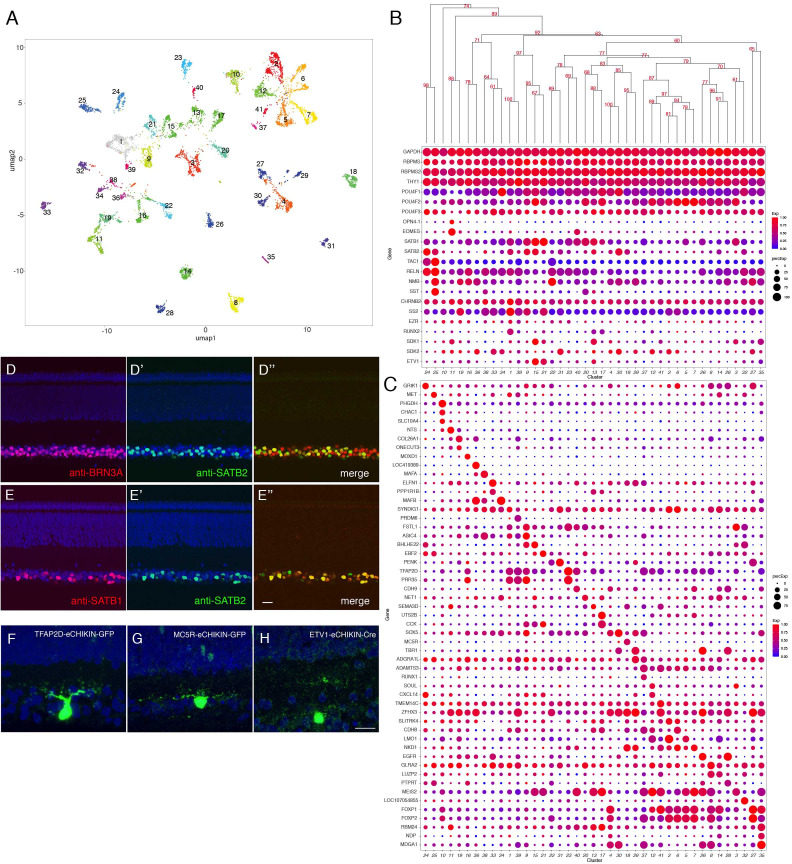
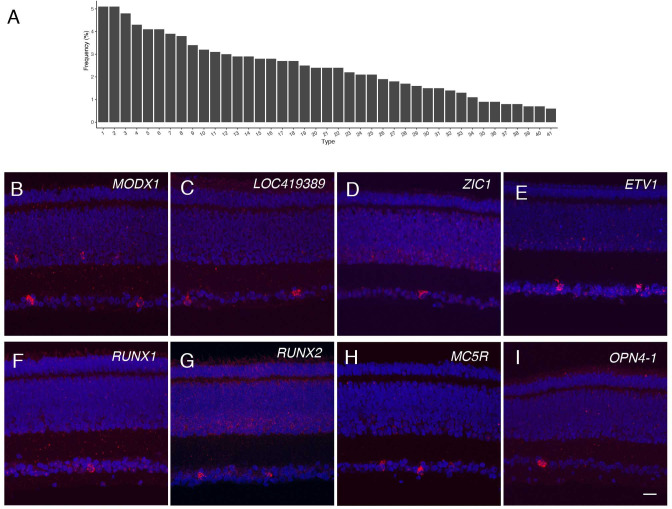
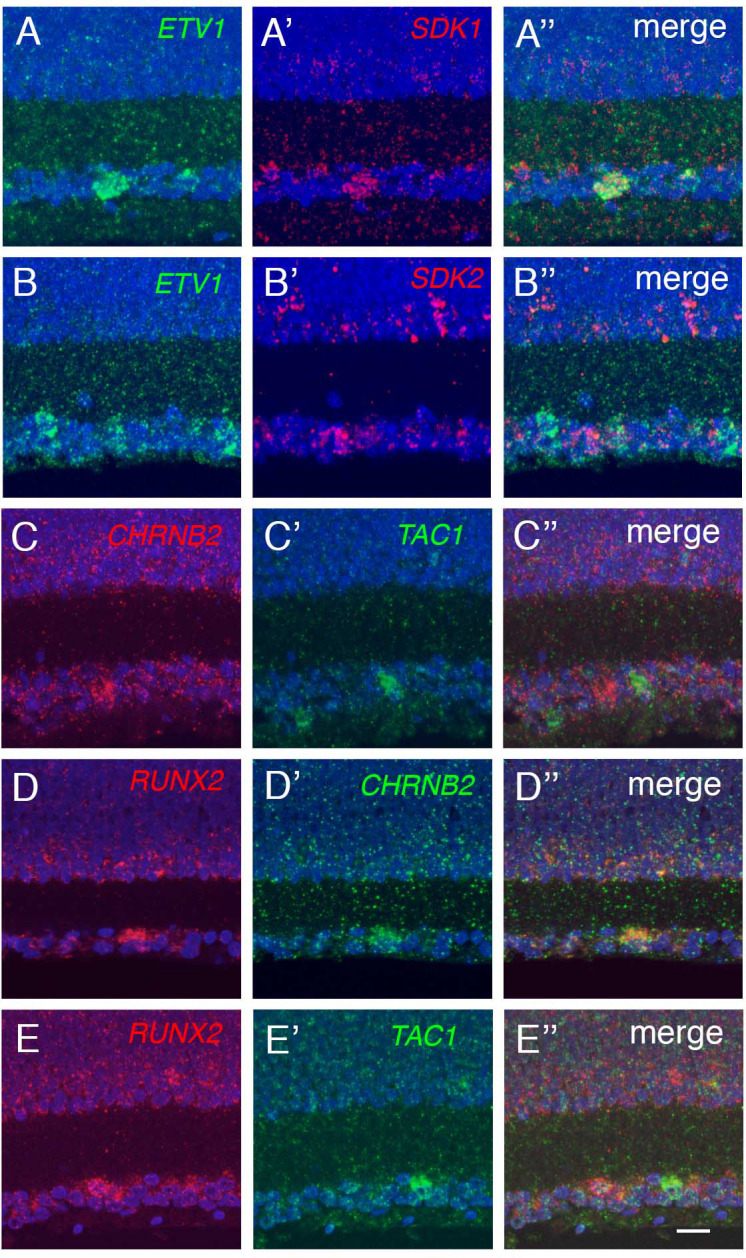
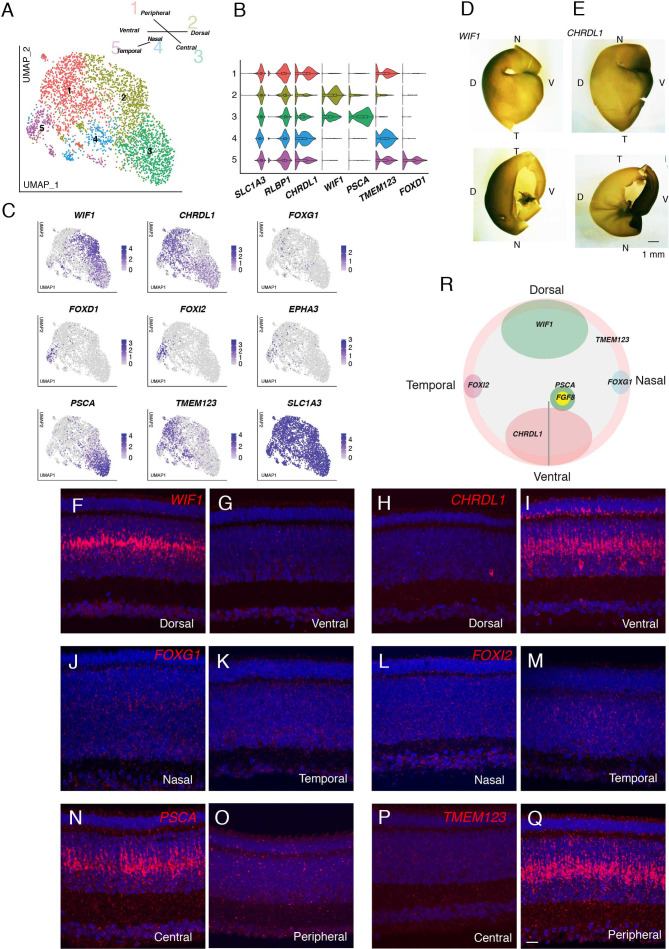
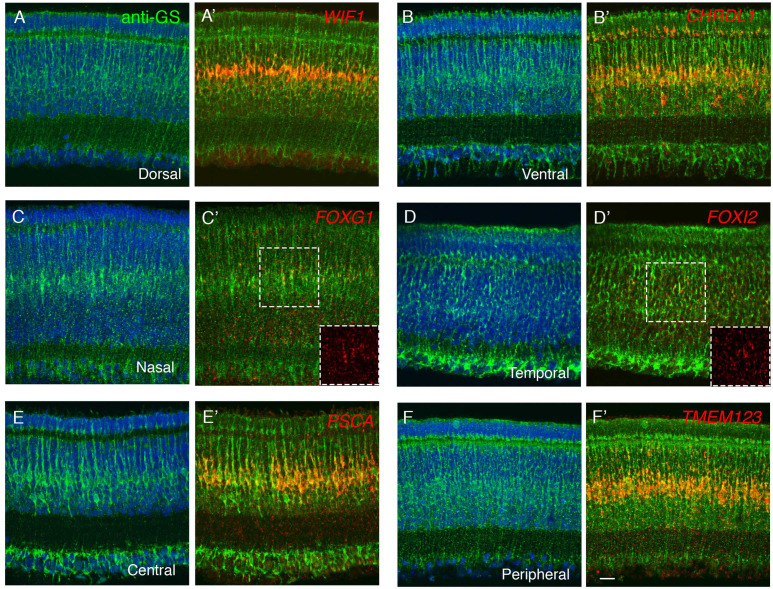
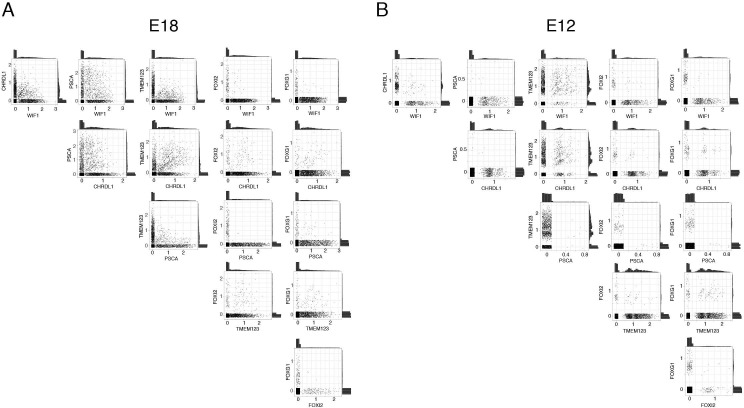
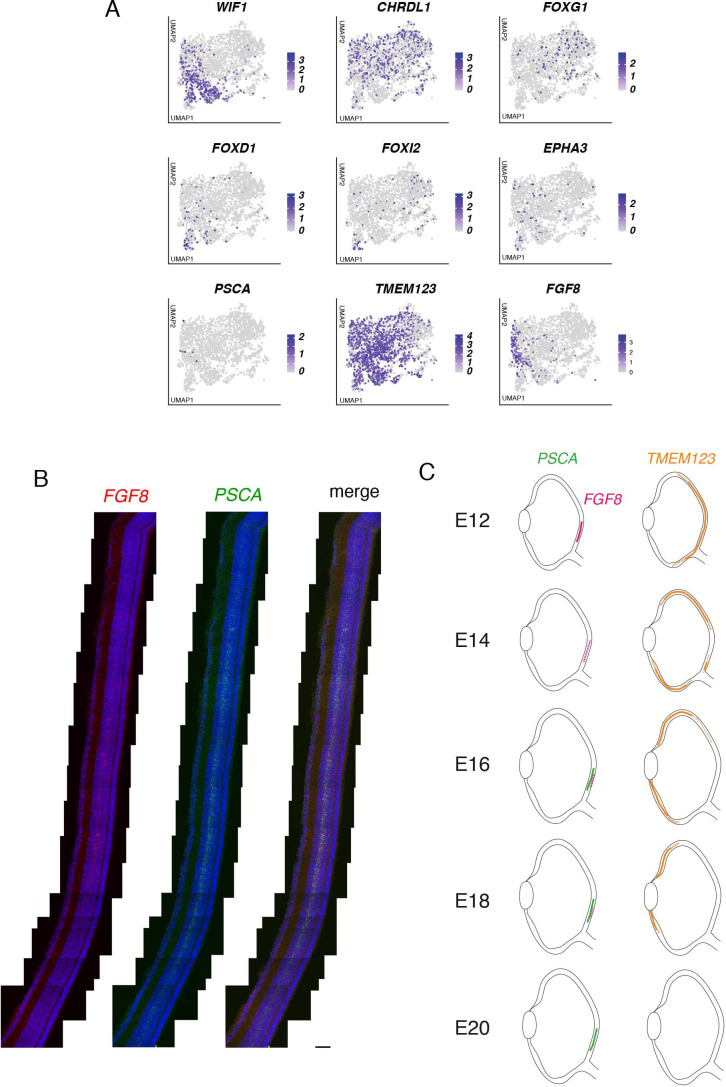
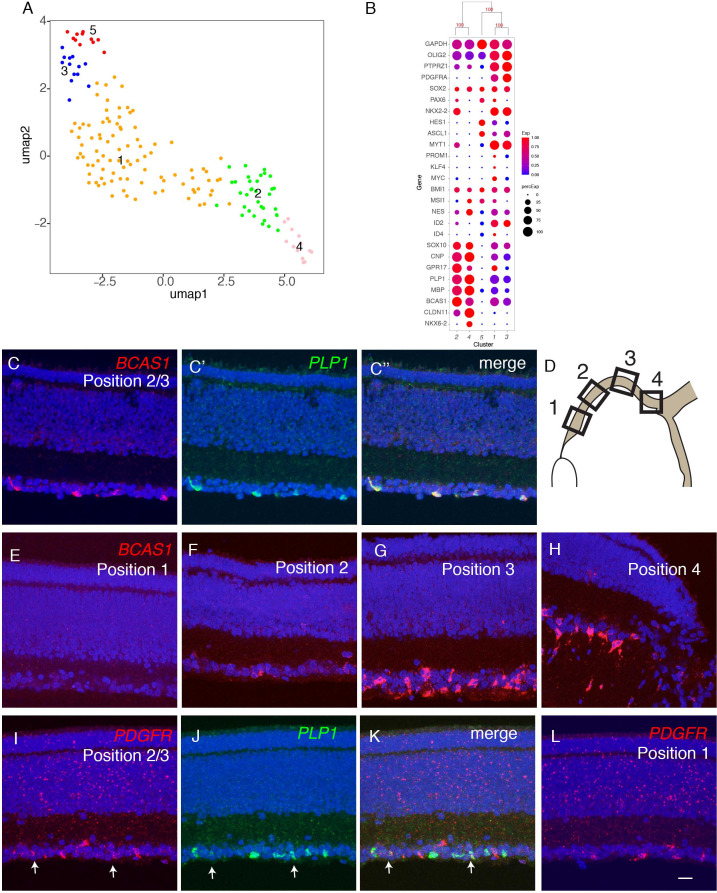
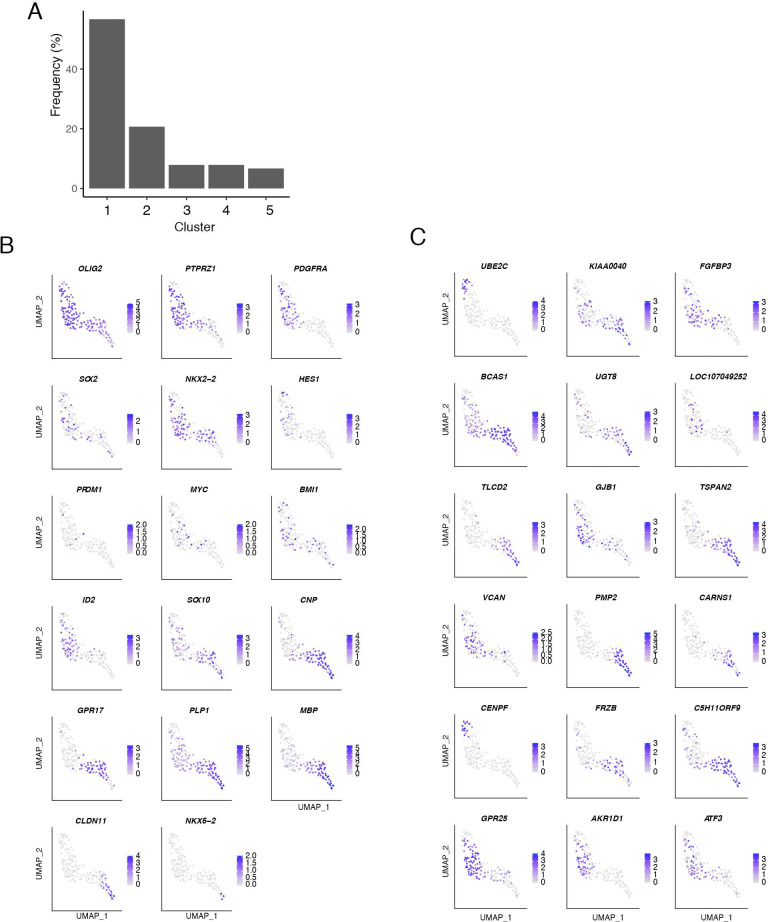
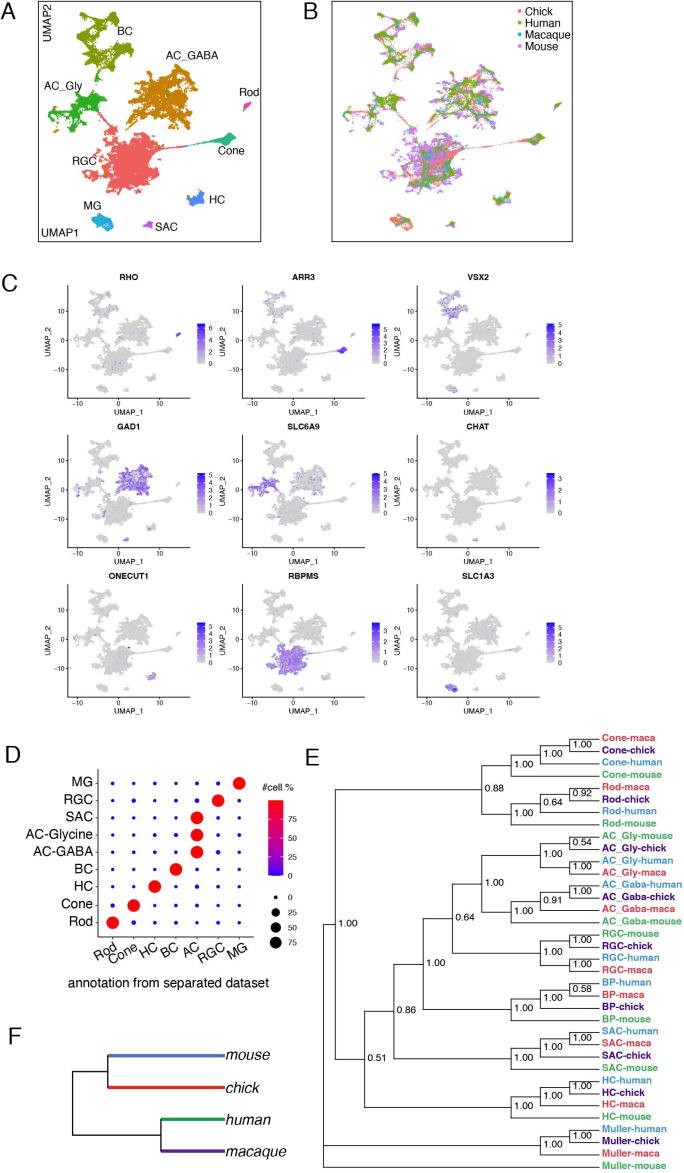
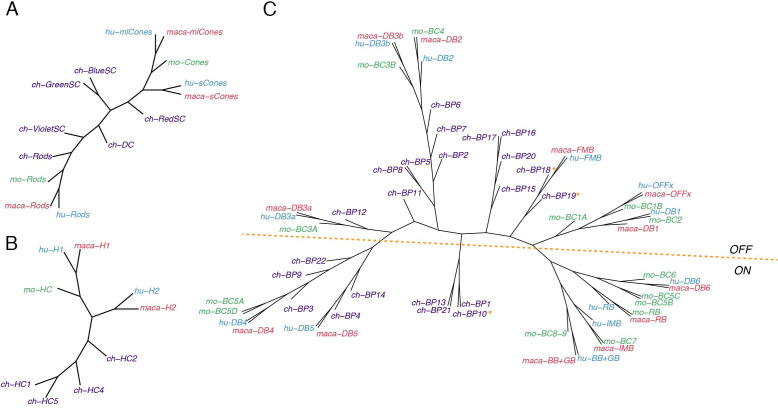
Retinal structure and function have been studied in many vertebrate orders, but molecular characterization has been largely confined to mammals. We used single-cell RNA sequencing (scRNA-seq) to generate a cell atlas of the chick retina. We identified 136 cell types plus 14 positional or developmental intermediates distributed among the six classes conserved across vertebrates - photoreceptor, horizontal, bipolar, amacrine, retinal ganglion, and glial cells. To assess morphology of molecularly defined types, we adapted a method for CRISPR-based integration of reporters into selectively expressed genes. For Müller glia, we found that transcriptionally distinct cells were regionally localized along the anterior-posterior, dorsal-ventral, and central-peripheral retinal axes. We also identified immature photoreceptor, horizontal cell, and oligodendrocyte types that persist into late embryonic stages. Finally, we analyzed relationships among chick, mouse, and primate retinal cell classes and types. Our results provide a foundation for anatomical, physiological, evolutionary, and developmental studies of the avian visual system.

Keywords: cell atlas; chicken; evolution; neuroscience; photoreceptor; retina; retinal ganglion cell; scRNAseq.

Plain language summary

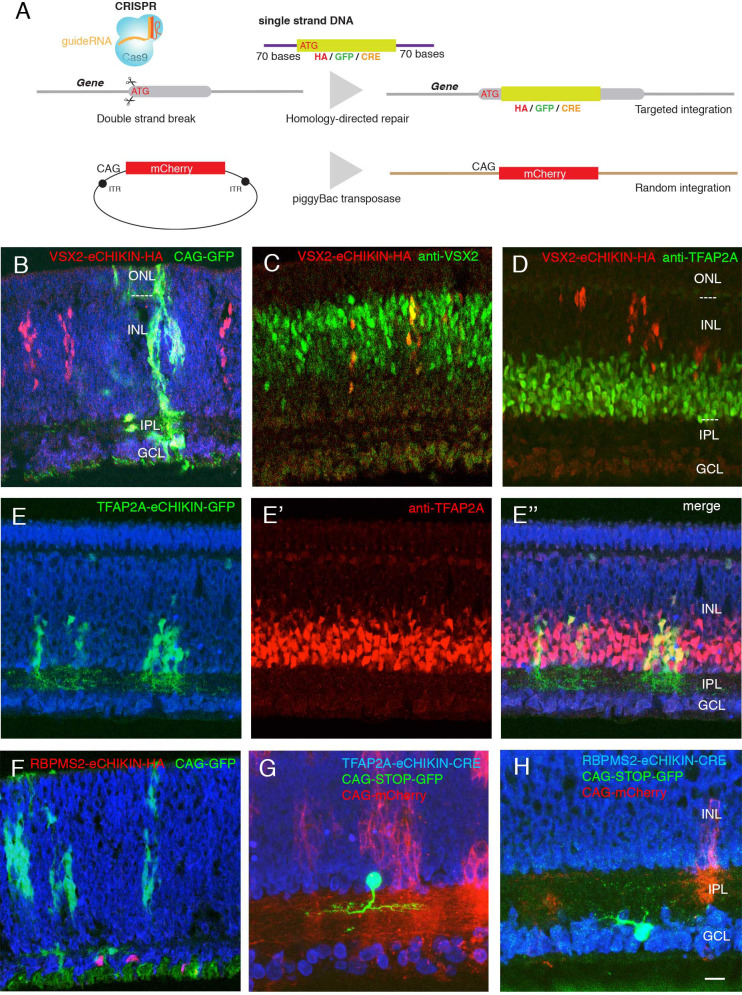
The evolutionary relationships of organisms and of genes have long been studied in various ways, including genome sequencing. More recently, the evolutionary relationships among the different types of cells that perform distinct roles in an organism, have become a subject of inquiry. High throughput single-cell RNA sequencing is a technique that allows scientists to determine what genes are switched on in single cells. This technique makes it possible to catalogue the cell types that make up a tissue and generate an atlas of the tissue based on what genes are switched on in each cell. The atlases can then be compared among species. The retina is a light-sensitive tissue that animals with a backbone, called vertebrates, use to see. The basic plan of the retina is very similar in vertebrates: five classes of neurons – the cells that make up the nervous system – are arranged into three layers. The chicken is a highly visual animal and it has frequently been used to study the development of the retina, from understanding how unspecialized embryonic cells become neurons to examining how circuits of neurons form. The structure and role of the retina have been studied in many vertebrates, but detailed descriptions of this tissue at the molecular level have been largely limited to mammals. To bridge this gap, Yamagata, Yan and Sanes generated the first cell atlas of the chicken retina. Additionally, they developed a gene editing-based technique based on CRISPR technology called eCHIKIN to label different cell types based on genes each type switched on selectively, providing a means of matching their shape and location to their molecular identity. Using these methods, it was possible to subdivide each of the five classes of neurons in the retina into multiple distinct types for a total of 136. The atlas provided a foundation for evolutionary analysis of how retinas evolve to serve the very different visual needs of different species. The chicken cell types could be compared to types previously identified in similar studies of mouse and primate retinas. Comparing the relationships among retinal cells in chickens, mice and primates revealed strong similarities in the overall cell classes represented. However, the results also showed big differences among species in the specific types within each class, and the genes that were switched on within each cell type. These findings may provide a foundation to study the anatomy, physiology, evolution, and development of the avian visual system. Until now, neural development of the chicken retina was being studied without comprehensive knowledge of its cell types or the developmentally important genes they express. The system developed by Yamagata, Yan and Sanes may be used in the future to learn more about vision and to investigate how neural cell types evolve to match the repertoire of each species to its environment.


Conflict of interest statement

MY, WY, JS No competing interests declared

Figures

Figure 1.
Figure 1.. Datasets used to generate a chick retinal atlas.
(A) Cross-section of chick retina stained with NeuroTrace to mark somata. The retina consists of three cellular layers: outer nuclear layer (ONL), inner nuclear layer (INL), and ganglion cell layer (GCL) separated by two synaptic layers, outer plexiform (OPL) and inner plexiform (IPL). Bar, 10 µm. (B) Sketch showing retinal cell classes. The ONL contains photoreceptors (PR): double cones, single cones, and rods. The INL contains horizontal, bipolar, and amacrine cells (HC, BC, and AC) and Müller glia (MG). The GCL contains retinal ganglion cells (RGCs) and ACs. Oligodendrocytes (OL) are present in an axonal layer beneath the GCL. (C) Birthdates of each class, from Prada et al., 1991. Hatching (P0) is at embryonic day (E)21. Arrows denote ages at which cells were obtained for scRNA-seq. To generate the cell atlas, E16 data were used for RGCs and E18 data for all other classes. (D) Expression of a subset of marker genes used to allocate E18 retinal cells to classes. Plot shows scaled expression level in a randomly down-sampled subset of all cells. (E) UMAP of E16+18 scRNA-seq data with class names based on D. (F) Fraction of E18 cells in each cell class, as determined by expression of canonical markers in D. (G) Fraction of E16 RGC-enriched cells in each cell class, determined as in D, F. (H) Number of clusters (putative cell types) in each retinal cell class, based on reclustering each class separately. (I) Fraction of E12 RGC-enriched cells in each cell class, determined as in D, F.
Figure 1—figure supplement 1.
Figure 1—figure supplement 1.. Quality control metrics for datasets used in this paper .
(A) Expression of housekeeping genes (Eisenberg and Levanon, 2013) in E18 retina. Clusters generated from initial unsupervised analysis are shown; following division into classes (Figure 1D,E), each class was reanalyzed to maximize the computational power in identifying clusters used in the remainder of the paper. Similar expression of these genes across clusters shows relatively uniform quality of cells analyzed. (B) Expression of house-keeping genes for E16 RGCs. (C) UMAP of E12 scRNA-seq data. (D) Expression patterns of a subset of marker genes used to allocate E12 retinal cells to classes, similar to Figure 1D. (E) Expression of house-keeping genes for E12 clusters.
Figure 2.
Figure 2.. Introduction of tags and reporters to specific loci using eCHIKIN.
(A) The eCHIKIN method. In ovo electroporation of Cas9/guideRNA ribonucleoprotein complexes edits the gene specified by the guide RNA, inserting a sequence encoding HA tag, GFP, or CRE. To identify transfected areas in tissues, a second fluorescent protein (GFP or mCherry) is expressed using the piggyBac transposon system. (B–D) Insertion of HA epitope tag into the nuclear protein encoded by VSX2. Cells stained by the anti-HA antibody are in the inner (upper) portion of the INL where bipolar cells (labeled with anti-VSX2 in C) are located at E12. CAG-driven GFP is expressed in all the layers. No HA-labeled cells are present in the lower portion of the INL, which contains TFAP2-positive amacrine cells (D), and all HA-positive cells are TFAP2-negative. In this and subsequent figures, sections were stained with NeuroTrace (blue) during mounting. (E, E’, E’’) GFP with a termination codon was inserted at the initiation codon of TFAP2A, an amacrine cell (AC) marker. In this case, GFP is not fused to TFAP2A protein, resulting in filling cytoplasm including neurites in the IPL at E12. TFAP2A protein is expressed by GFP-expressing cells, all of which are TFAP2A-positive ACs. (Note that the eCHIKIN construct disrupts the TFAP2A open-reading frame, so double labeling results from expression of endogenous TFAP2A and indicates that only a single TFAP2A allele was edited). (F) Insertion of HA epitope tag into the cytoplasmic protein encoded by RGC-specific RBPMS2 gene. Labeled cells are in the GCL at E10. (G) Insertion of Cre recombinase into the TFAP2A gene. The insertion construct was coelectroporated with a CAG- loxP-STOP-loxP-GFP construct, labeling a small number of ACs with GFP at E14. (H) Insertion of Cre recombinase into the RBPMS2 gene. The insertion construct was coelectroporated with CAG- loxP-STOP-loxP-GFP as in F, labeling a small number of RGCs with GFP at E14. Bar in H, 10 µm for B-E,G; 5 µm for F, H.
Figure 3.
Figure 3.. Classification and characterization of photoreceptors (PRs).
(A) Clustering of E18 PRs displayed in UMAP. Identities of each cluster are indicated to the right. (B) Dot plots showing expression of selected genes expressed in all or subsets of PRs. In this and subsequent figures, dot size indicates the proportion of cells that express each gene, and color indicates expression level normalized to its max value among clusters. Numbers correspond to clusters in A. Dendrogram above dots shows transcriptional relationships of clusters. In this and subsequent figures, numbers labeled on the tree are p-values computed by multiscale bootstrap resampling, ranging from 0 to 100, higher value indicates higher reliability. (C–E) In situ hybridization of E16 sections (en face in C,D; vertical in E,F) with probes for cluster-specific genes. (C) OPN1LW and OPN1MSW. (D) OPN1LW and STRA6. Arrows show coexpression. (E) OPN1LW and CALB1. (F) Immunostaining of E16 section with antibodies to STRA6 and CALB1. (G) Double cones (DCs) labeled by eCHIKIN-mediated insertion of GFP into the CALB1 locus. Section is from E17 retina. G' is a high-power picture of a part of G, showing an accessary DC (a) and principal DC (p) based on their position in outer nuclear layer (ONL). Bar in F, 10 µm for C and D; 5 µm for E–G. (H) Relationship between immature and mature PR clusters assessed by XGBoost. Annotation of clusters is indicated in A. Dev, developing.
Figure 3—figure supplement 1.
Figure 3—figure supplement 1.. Frequency distribution of photoreceptors and comparison of E12 and E18 data .
(A) Frequency distribution of photoreceptor (PR) types. Cluster numbers are from Figure 3A. (B, C) Clustering of PRs from E12 and E18 together and visualized in the same UMAP, showing that the majority of E12 cells are immature types while the majority of E18 cells are mature types. In B, colors represent annotations from E18 PRs as shown in Figure 3A. In C, distinct colors show E12 and E18 cells.
Figure 3—figure supplement 2.
Figure 3—figure supplement 2.. Regional distribution of developing photoreceptor cell types.
(A–D) In situ hybridization of E12 retina (A,B) and E20 retina (C,D) for OPN1LW and ARGHAP18. (E–P) Central and peripheral staining of SLIT1 (E–G), STRA6 (H–J), OPN1LW (K–M), ARGHAP18 (N–P) at E16. D-peri, dorsal peripheral; V-peri, ventral peripheral. Bar, 10 µm. (Q) Summary sketch, showing expression of indicated genes at E16 and E18.
Figure 4.
Figure 4.. Classification and characterization of horizontal cells (HC).
(A) Clustering of E18 HCs viewed by UMAP. (B) Dot plots showing expression of selected genes expressed in all or subsets of HCs. Numbers correspond to clusters in A. Dendrogram above dots shows transcriptional relationships of clusters. (C–L) In situ hybridization with indicated probes at E16. C–I are cross-sections; J–L are en face sections. Arrowheads in C–I mark OPL. (C) Double color in situ hybridization shows coexpression of OXT and IPCEF1. (D–F) Expression of NTRK (D), EGFR (E), and LTK (F) in subsets of HCs. (G–I) Double color in situ hybridization for NTKR/ EGFR (G), LTK/ NTRK (H), and LTK /EGFR (I). (J–L) In situ hybridization of E16 en face sections for NTRK (J), EGFR (K), and LTK (L) showing mosaics of each type. Bar in L, 5 µm for C, G–I; 10 µm for D–F, J–L.
Figure 4—figure supplement 1.
Figure 4—figure supplement 1.. Frequency and regional distributions of horizontal cell types.
(A) Frequency distribution of horizontal cells (HCs). Cluster numbers are from Figure 4A,B. (B–M) In situ hybridization for OXT and IPCEF1 in central and peripheral retina at E14, E18, and E20. Bar in M, 10 µm for all parts. (N, O, P) Feature plots of E12 HCs, showing expression of markers that label HC types at E18.
Figure 5.
Figure 5.. Classification and characterization of bipolar cells (BCs).
(A) Clustering of E18 BCs visualized by UMAP. (B) Dot plots showing expression of selected genes expressed in all or subsets of BCs. Numbers correspond to clusters in A. Dendrogram above dots shows transcriptional relationships of clusters. Putative ON and OFF types, based on markers in C, are indicated by color. (C) Expression of genes selectively expressed by ON (TRPM1, ISL1), OFF (GRIK1, FEZF1) and rod (PRKCA) BCs in rodents. OTX1 and SOX5 are uniquely expressed in putative ON clusters. (D–H) eCHIKIN-mediated labeling of cells expressing IRX3 (BC12, (D)), TPBGL (BC6, (E)), RRAD (BC7, (F)), SLC6A4 (BC15, (G)), and ANGPT2 (BC1, (H)). E14 sections at E14 were stained with anti-GFP. Each lamination was confirmed in 3–10 cases. Bar 10 µm. (I–K) Immunostaining with anti-TBBGL (I), anti-SLC6A4 (J), and anti-PRKCA (K). Bar 10 µm. (L) Summary of BC soma positions in INL and terminal positions in IPL.
Figure 5—figure supplement 1.
Figure 5—figure supplement 1.. Frequency distribution and laminar position of bipolar cell types.
(A) Frequency distribution of bipolar cells (BCs). Cluster numbers are from Figure 5A,B. (B–O) In situ hybridization or immunostaining of E16 retina with indicated probes. (B,C) GRIK1 (B) and TRPM1 (B), which mark OFF and ON BC populations, respectively, in mammals. (D,E) Double staining with anti-VSX2 (D) and anti-OTX1 (E). (F–O) Expression of markers for BC subsets. In situ hyridization for ERBB4 (F), TPBGL (G), STRA6 (H), RRAD (I), SLC6A4 (K), PRKCA (L), MMEL1 (M), PENK (N), DACT2 (O). Immunostaining with anti-SOX5 (J). Positions of the BCs expressing ERBB4, SOX5, PENK, and DACT2 are indicated by asterisk because these are also expressed by amacrine cells (ACs) or horizontal cells (HCs). (P) Position of BC somata in the INL, calculated from micrographs such as those in B–Q. Positions of soma (dots) were measured, and plotted using the ggplot2 (R) showing the five number summary (the sample minimum, the lower quartile, the median, the upper quartile, and the sample maximum). Edge of OPL is 0% and edge of IPL is 100%. (Q, R) Section (E16) stained with anti-ERBB4 (Q), anti-STRA6 (R). Bar in O, 10 µm for A–O. Bar in R, 5 µm for Q, R.
Figure 6.
Figure 6.. Classification and characterization of amacrine cells (ACs).
(A) Clustering of E18 ACs using UMAP. (B) Dot plots showing expression of the housekeeping gene, GAPDH; pan-AC genes PAX6 and SLC32A1; genes diagnostic of GABAergic ACs (SLC6A1, GAD1, GAD2) and glycinergic ACs (SLC6A9); and TFAP2 isoforms, TFAP2A and TFAP2B. Numbers correspond to clusters in A. Dendrogram above dots shows transcriptional relationships of clusters. (C) Genes expressed by subsets of ACs. (D,E) Immunostaining of E16 retina for TFAP2A (D) and TFAP2B (E). TFAP2A is expressed by multiple amacrine types in INL but not in GCL. (F) Immunostaining of E16 retina for CHAT, which is expressed by ON and OFF starburst ACs. Bar in E is 10 µm for D,E. Bar in F is 10 µm for F.
Figure 6—figure supplement 1.
Figure 6—figure supplement 1.. Frequency distribution and morphological analysis of amacrine cell types.
(A) Frequency distribution of amacrine cells (ACs). Cluster Numbers are from Figure 6A,B. B–D, Immunostaining for NMB in AC17 (B), CHODL in AC40 (C), NPY in AC52 (D). (E–H) Double color in situ hybridization for NPY and NTS (E). NTS and PENK (F), NTS and MAFA (G) and PENK and MAFA (H). (I) Expression of NTS, PENK, MAFA, and NPY in selected AC clusters. (J,K) eCHIKIN-mediated labeling of NTS ACs. Two types of cells are labeled: PENK-expressing AC31 populate the top of the AC layer, and send arbors in S1–S3 (I), and MAFA-expressing AC58 is at the edge of IPL, and ramifies along S5 (J). Retinas are from E16 (B–H) or E14 (J,K). Bar in H is 10 µm for B–H. Bar in K is 10 µm for J and K.
Figure 6—figure supplement 2.
Figure 6—figure supplement 2.. Molecular and morphological analysis of key amacrine cell types.
(A) Violin plots showing differentially expressed genes in two clusters of E18 chick starburst ACs which are characterized by similar expression of CHAT and ISL1. (B) Dot plots of SLC17A8 (VGLUT3), SDK2, SDK1, and ERBB4 expression in amacrine cells (ACs). (C,D) Double-color in situ hybridization of E16 retina for SLC17A8 (arrowheads) plus SDK2 (C), or SDK1 (D). (E) eCHIKIN-mediated GFP insertion in ERBB4 at E14. The visualized cell stratifies along S2/S4 (arrowheads) which correspondes to SDK2 localization (Yamagata et al., 2002). See Figure 5—figure supplement 1F for overall expression pattern of ERBB4. Bar in D is 5 µm for C,D. Bar in E is 10 µm.
Figure 7.
Figure 7.. Classification and characterization of RGCs.
(A) Clustering of E16 RGCs using UMAP. (B) Dot plots showing expression of selected genes expressed in all or subsets of RGCs. Numbers correspond to clusters in A. Dendrogram above dots shows transcriptional relationships of clusters. (C) Dot plots showing expression of genes selectively expressed in RGC clusters. (D, E) Immunostaining of E16 retina for SATB2 and BRN3A/POU4F1 (D) and for SATB1 and SATB2 (E). (F–H) RGCs labeled by eCHIKIN-mediated GFP insertion in TFAP2D (GC23; F), MC5R (GC18; G), and ETV1 (GC15; H). Bars in E and H, 10 µm.
Figure 7—figure supplement 1.
Figure 7—figure supplement 1.. Frequency distribution and morphological analysis of retinal ganglion cell types.
(A) Frequency distribution of RGCs. Cluster numbers are from Figure 7A,B. (B–I) In situ hybridization of E16 retina for MODX1 in GC34 (B), LOC419389 in GC32 (C), ZIC1 in GC3 (D), ETV1 in GC15 or 21 (E), RUNX1 in GC36 (F), RUNX2 in GC1 (G), MC5R in GC23 (H), and OPN4.1 in GC41 (I). Bar, 10 µm.
Figure 7—figure supplement 2.
Figure 7—figure supplement 2.. Markers expressed and co-expressed by key retinal ganglion cell types.
Double-color in situ hybridization on E16 retina for RGC markers. Blue, DAPI.
Figure 8.
Figure 8.. Transcriptomic map of topographic position in Müller glia.
(A) Clustering of E18 MGs using UMAP. Inset shows relationship between clusters and retinal position. (B,C) Violin (B) and feature (C) plots of genes differentially expressed among MG clusters. B also shows that pan-MG genes SLC1A3 and RLBP1 are expressed at similar levels among clusters. (D, E) In situ hybridization for WIF1 (D) and CHRDL1(E) on whole mounts at E13 photographed from the posterior (top panels) or anterior (bottom panels). The black structure at the ventral edge in the bottom panels is the intrinsically pigmented pecten oculi. Bar, 1 mm. (F–Q) In situ hybridization on sections from indicated retinal regions to show position-selective of genes from C in Müller glia. F-I WIF1 and CHRDL1 on E16 dorsal and ventral sections. CHRDL1 is also in a subset of amacrine cells throughout the retina. (J–M) FOXG1 and FOXI2 on E14 nasal and temporal sections. (N–Q) PSCA and TMEM123 on E16 central and peripheral sections. Bar, 10 µm. (R) Summary of position-dependent expression of genes in Müller glia at E16, based on images such as those in D-Q.
Figure 8—figure supplement 1.
Figure 8—figure supplement 1.. Regional distributions of Müller glial cell positional variants.
(A–F) In situ hybridization for WIF1 (A), CHRDL1(B) at E16, FOXG1 (C), FOXI2 (D) at E14, PSCA (E), TMEM123 (F) at E16. Sections were co-stained with anti-glutamate synthetase (anti-GS), showing that these genes are selectively expressed in Muller glia. Bar, 10 µm.
Figure 8—figure supplement 2.
Figure 8—figure supplement 2.. Co-expression of positional markers in Müller glia.
Co-expression in E18 (A) and E12 (B) retina. The x-axis and y-axis are the expression level of the marker genes, and each dot represents one Müller glial cell. Histogram plots on the top and right of each panel show the overall expression level of the two genes.
Figure 8—figure supplement 3.
Figure 8—figure supplement 3.. Developmental trajectories of Müller glial cell variants.
(A) Feature plots with a set of positional genes at E12 (see Figure 8C for expression at E18). (B) In situ hybridization for FGF8 and PSCA at E16, showing co-expression of FGF8 and PSCA at the high acuity area (area centralis). The PSCA+ domain is broader than the FGF8 domain (arrowheads). Bar, 20 µm. (C) Schematic representation for expression of PSCA, FGF8, and TMEM123. Between E12 and E20, TMEM123 is progressively restricted to peripheral retina and is then downregulated; FGF8 is present in central retina then downregulated; and PSCA appears in central retina between E14 and E16.
Figure 9.
Figure 9.. Developmental trajectory of oligodendrocytes.
(A) Clustering of E18 oligodendrocytes viewed in UMAP. (B) Dot plots showing expression of selected genes expressed in all or subsets of oligodendrocytes. Numbers correspond to clusters in A. (C-K) Double-label in situ hybridization showing that BCAS1 and PLP1 are co-expressed in the ganglion cell layer (C) while PDGFR and PLP1 exhibit nonoverlapping expression (I-K). (E-L) Graded distribution of BCAS1+ and PDGFR+ oligodendrocytes along the central-to-peripheral axis at E16. Positions of sections (E–L) are shown in D.
Figure 9—figure supplement 1.
Figure 9—figure supplement 1.. Frequency distribution and molecular analysis of oligodendrocyte variants.
(A) Frequency distribution of oligodendrocytes. Cluster Numbers are from Figure 9A,B. (B,C) Feature plots showing expression of oligodendrocyte-characteristic genes that have been studied in mammals (B) and that we found to be selectively expressed in chicks (C).
Figure 10.
Figure 10.. Conserved transcriptomic identity of cell classes in mammals and chicks.
(A) UMAP visualization of pooled cells from chick, mouse, macaque following unsupervised clustering. Colors distinguish classes identified by reference to canonical markers (C) and labels previously assigned to each species separately (D). (B) The same as A, but colors indicate species. (C) Feature plot showing the canonical markers of each retina cell class. (D) Confusion matrix comparing the class identity by clustering of pooled cells (on y-axis) to the class annotation when each dataset was analyzed individually (x-axis). (E) Dendrogram based on the transcriptomic similarity of cell classes from each species. (F) Dendrogram based on overall retinal cell transcriptomic similarity among the four species.
Figure 11.
Figure 11.. Conserved transcriptomic identity of photoreceptor (PR), horizontal (HC), and bipolar cell (BC) types in mammals and chicks.
Consensus dendrogram tree for PR (A), HC (B), and BC (C) types from chick, mouse, macaque, and human single-cell dataset. In C, ON and OFF types are globally separated by a dotted line, but three exceptions from chick BC types are indicated by asterisk.
Figure 11—figure supplement 1.
Figure 11—figure supplement 1.. Cross-species comparisons of amacrine cell types.
(A) UMAP visualization of pooled amacrine cells (ACs) from chick, mouse, macaque, and human retina following unsupervised clustering. (B) The same as A, but colors code for species. (C) Relationship of clusters from A to AC types identified in each species separately. Consensus dendrogram tree, built as in Figure 11, is shown at the left. Three groups (VG3, SEG, and SAC) conserved between chick and mammals are highlighted.
Figure 11—figure supplement 2.
Figure 11—figure supplement 2.. Cross-species comparisons of retinal ganglion cell types.
(A) UMAP visualization of pooled RGCs from chick, mouse, macaque and human retina following unsupervised clustering. (B) The same as A, but colors code for species. (C) Relationship of clusters from A to RGC types identified in each species separately. Consensus dendrogram tree, built as in Figure 11, is shown at the left. A group of ipRGC types conserved among chick and mammals is highlighted.
Figure 12.
Figure 12.. Down-sampling test of chick bipolar cells (BCs), amacrine cells (ACs), and RGCs.
Graphs show the number of cell clusters identified when using 10–90% of total cells, 10 repeats each (Mean ± SD). (A) BCs. (B) ACs. (C) RGCs.

References

    1. Adler R. A model of retinal cell differentiation in the chick embryo. Progress in Retinal and Eye Research. 2000;19:529–557. doi: 10.1016/S1350-9462(00)00008-2. - DOI - PubMed
    1. Baden T. Vertebrate vision: lessons from non-model species. Seminars in Cell & Developmental Biology. 2020;106:1–4. doi: 10.1016/j.semcdb.2020.05.028. - DOI - PubMed
    1. Baden T, Euler T, Berens P. Understanding the retinal basis of vision across species. Nature Reviews Neuroscience. 2020;21:5–20. doi: 10.1038/s41583-019-0242-1. - DOI - PubMed
    1. Baden T, Osorio D. The retinal basis of vertebrate color vision. Annual Review of Vision Science. 2019;5:177–200. doi: 10.1146/annurev-vision-091718-014926. - DOI - PubMed
    1. Bassett EA, Pontoriero GF, Feng W, Marquardt T, Fini ME, Williams T, West-Mays JA. Conditional deletion of activating protein 2alpha (AP-2alpha) in the developing retina demonstrates non-cell-autonomous roles for AP-2alpha in optic cup development. Molecular and Cellular Biology. 2007;27:7497–7510. doi: 10.1128/MCB.00687-07. - DOI - PMC - PubMed

Publication types

Associated data