

Modulation of epileptic networks by transient interictal epileptic activity: A dynamic approach to simultaneous EEG-fMRI
- PMID: 33395963
- PMCID: PMC7645285
- DOI: 10.1016/j.nicl.2020.102467
Modulation of epileptic networks by transient interictal epileptic activity: A dynamic approach to simultaneous EEG-fMRI
Abstract
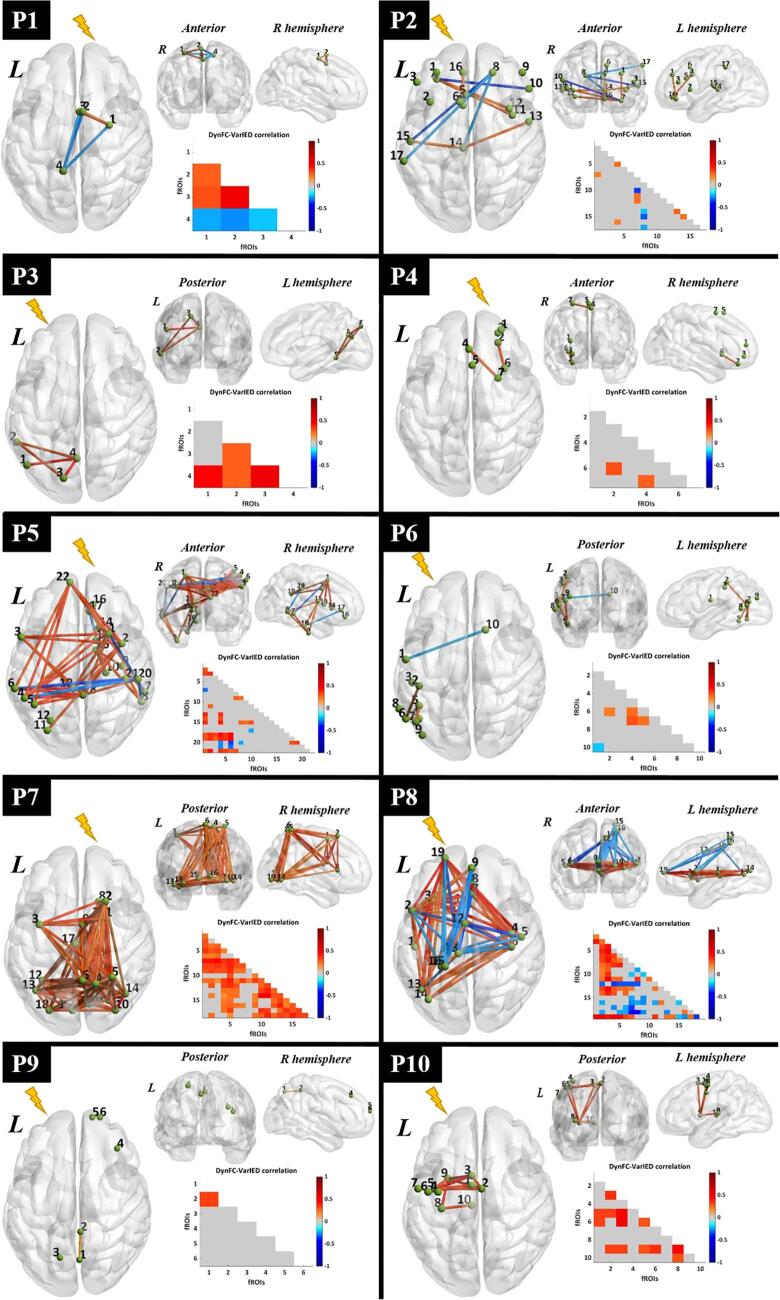
Epileptic networks, defined as brain regions involved in epileptic brain activity, have been mapped by functional connectivity in simultaneous electroencephalography and functional magnetic resonance imaging (EEG-fMRI) recordings. This technique allows to define brain hemodynamic changes, measured by the Blood Oxygen Level Dependent (BOLD) signal, associated to the interictal epileptic discharges (IED), which together with ictal events constitute a signature of epileptic disease. Given the highly time-varying nature of epileptic activity, a dynamic functional connectivity (dFC) analysis of EEG-fMRI data appears particularly suitable, having the potential to identify transitory features of specific connections in epileptic networks. In the present study, we propose a novel method, defined dFC-EEG, that integrates dFC assessed by fMRI with the information recorded by simultaneous scalp EEG, in order to identify the connections characterised by a dynamic profile correlated with the occurrence of IED, forming the dynamic epileptic subnetwork. Ten patients with drug-resistant focal epilepsy were included, with different aetiology and showing a widespread (or multilobar) BOLD activation, defined as involving at least two distinct clusters, located in two different lobes and/or extended to the hemisphere contralateral to the epileptic focus. The epileptic focus was defined from the IED-related BOLD map. Regions involved in the occurrence of interictal epileptic activity; i.e., forming the epileptic network, were identified by a general linear model considering the timecourse of the fMRI-defined focus as main regressor. dFC between these regions was assessed with a sliding-window approach. dFC timecourses were then correlated with the sliding-window variance of the IED signal (VarIED), to identify connections whose dynamics related to the epileptic activity; i.e., the dynamic epileptic subnetwork. As expected, given the very different clinical picture of each individual, the extent of this subnetwork was highly variable across patients, but was but was reduced of at least 30% with respect to the initially identified epileptic network in 9/10 patients. The connections of the dynamic subnetwork were most commonly close to the epileptic focus, as reflected by the laterality index of the subnetwork connections, reported higher than the one within the original epileptic network. Moreover, the correlation between dFC timecourses and VarIED was predominantly positive, suggesting a strengthening of the dynamic subnetwork associated to the occurrence of IED. The integration of dFC and scalp IED offers a more specific description of the epileptic network, identifying connections strongly influenced by IED. These findings could be relevant in the pre-surgical evaluation for the resection or disconnection of the epileptogenic zone and help in reaching a better post-surgical outcome. This would be particularly important for patients characterised by a widespread pathological brain activity which challenges the surgical intervention.
Keywords: Dynamic functional connectivity; EEG-fMRI; Epilepsy; Pre-surgical planning.
Copyright © 2020 The Authors. Published by Elsevier Inc. All rights reserved.
Conflict of interest statement
The authors declare that they have no known competing financial interests or personal relationships that could have appeared to influence the work reported in this paper.
Figures


References
-
- Abreu R., Leal A., Lopes da Silva F., Figueiredo P. EEG synchronization measures predict epilepsy-related BOLD-fMRI fluctuations better than commonly used univariate metrics. Clin Neurophysiol. 2018;129:618–635. - PubMed
-
- Abreu R., Nunes S., Leal A., Figueiredo P. Physiological noise correction using ECG-derived respiratory signals for enhanced mapping of spontaneous neuronal activity with simultaneous EEG- fMRI. Neuroimage. 2017;154:115–127. - PubMed
-
- Allen P.J., Josephs O., Turner R. A method for removing imaging artifact from continuous EEG recorded during functional MRI. Neuroimage. 2000;12:230–239. - PubMed
-
- Allen P.J., Polizzi G., Krakow K., Fish D.R., Lemieux L. Identification of EEG events in the MR scanner: the problem of pulse artifact and a method for its subtraction. Neuroimage. 1998;8:229–239. - PubMed
Publication types
MeSH terms
LinkOut - more resources
Full Text Sources
Medical
Research Materials
