Multicenter Study
. 2020:28:102495.
doi: 10.1016/j.nicl.2020.102495. Epub 2020 Nov 11.

Multimodal MRI analysis of basal forebrain structure and function across the Alzheimer's disease spectrum

Affiliations
Multicenter Study

Multimodal MRI analysis of basal forebrain structure and function across the Alzheimer's disease spectrum

Meret Herdick et al. Neuroimage Clin. 2020.

Abstract

Background: Dysfunction of the cholinergic basal forebrain (cBF) is associated with cognitive decline in Alzheimer's disease (AD). Multimodal MRI allows for the investigation of cBF changes in-vivo. In this study we assessed alterations in cBF functional connectivity (FC), mean diffusivity (MD), and volume across the spectrum of AD. We further assessed effects of amyloid pathology on these changes.

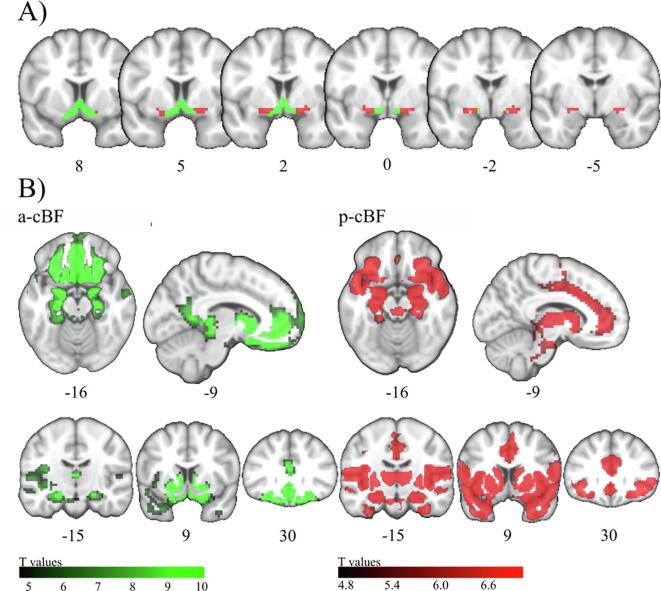
Methods: Participants included healthy controls, and subjects with subjective cognitive decline (SCD), mild cognitive impairment (MCI), or AD dementia (ADD) from the multicenter DELCODE study. Resting-state functional MRI (rs-fMRI) and structural MRI data was available for 477 subjects, and a subset of 243 subjects also had DTI data available. Differences between diagnostic groups were investigated using seed-based FC, volumetric, and MD analyses of functionally defined anterior (a-cBF) and posterior (p-cBF) subdivisions of a cytoarchitectonic cBF region-of-interest. In complementary analyses groups were stratified according to amyloid status based on CSF Aβ42/40 biomarker data, which was available in a subset of participants.

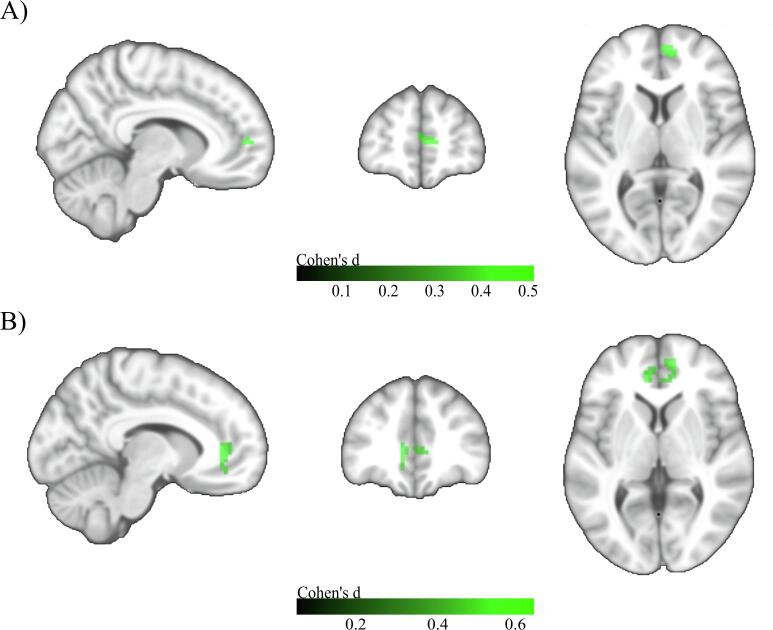
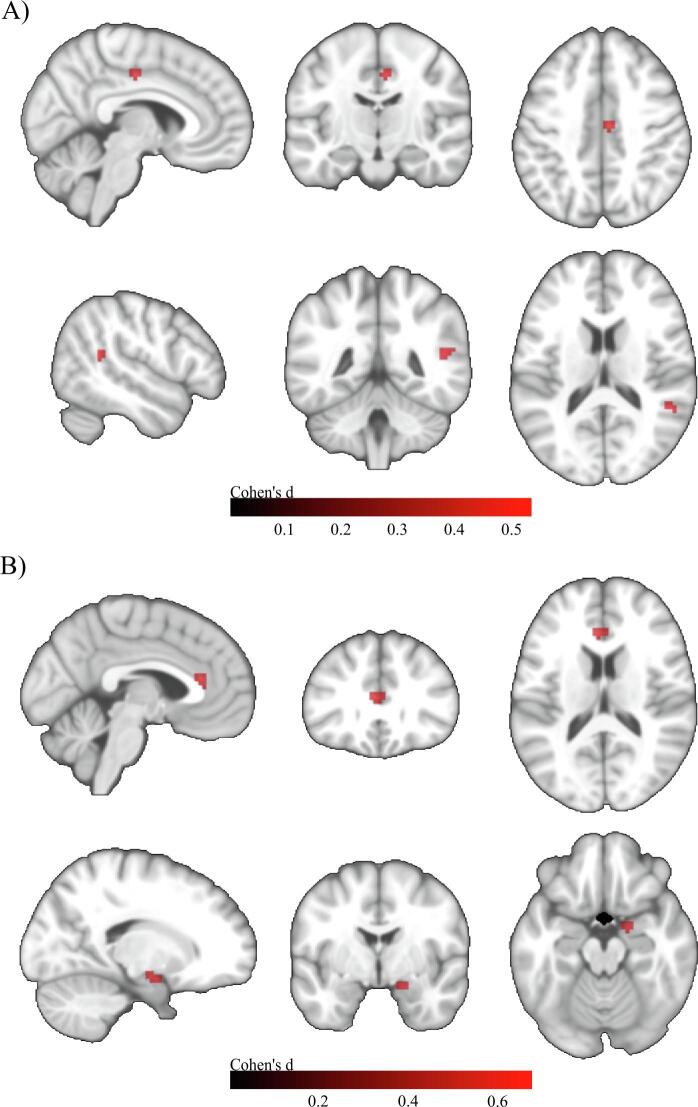
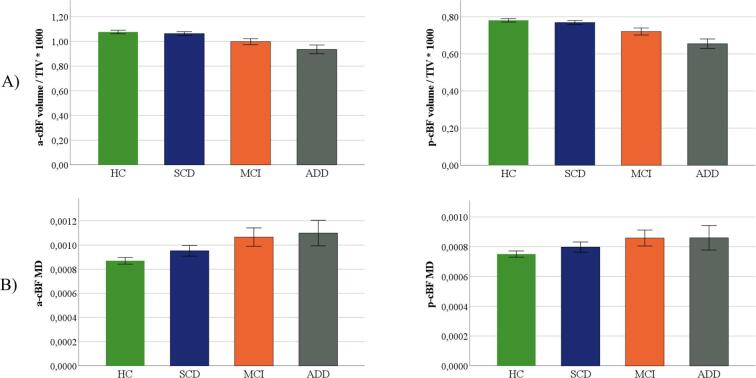
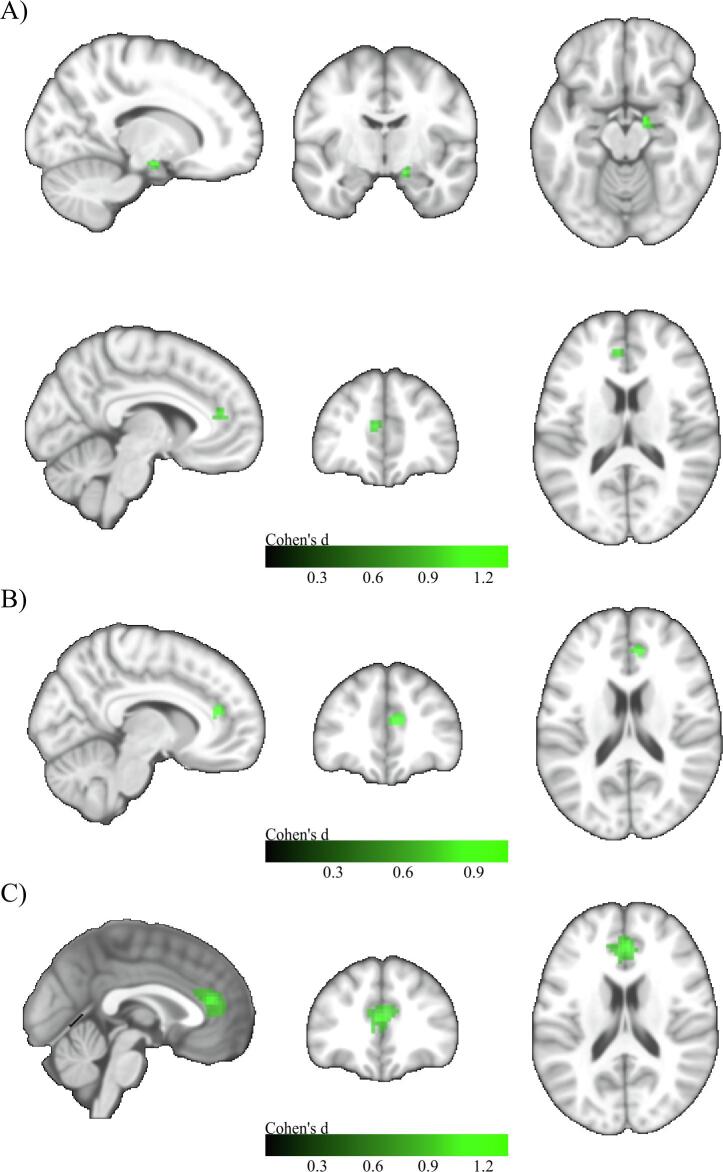
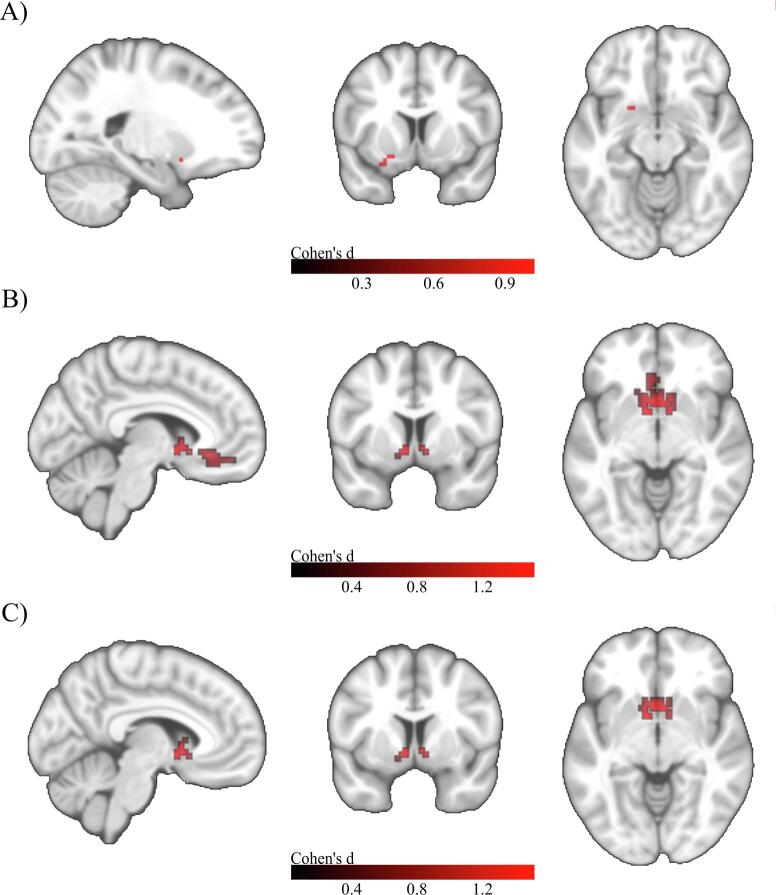
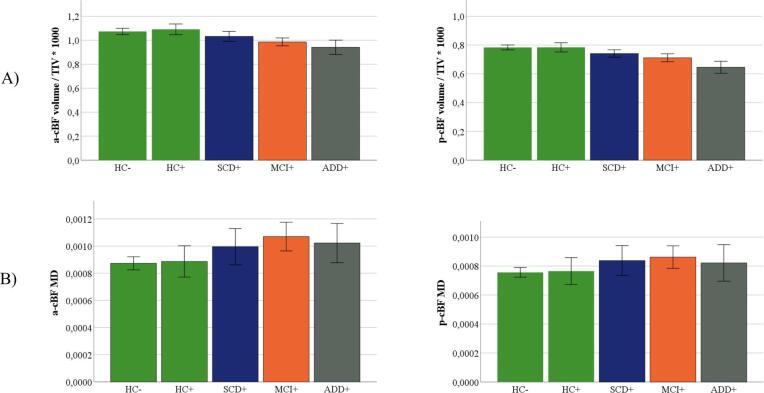
Results: a-cBF and p-cBF subdivisions showed regional FC profiles that were highly consistent with previously reported patterns, but there were only minimal differences between diagnostic groups. Compared to controls, cBF volumes and MD were significantly different in MCI and ADD but not in SCD. The Aβ42/40 stratified analyses largely matched these results.

Conclusions: We reproduced subregion-specific FC profiles of the cBF in a clinical sample spanning the AD spectrum. At least in this multicentric cohort study, cBF-FC did not show marked changes along the AD spectrum, and multimodal MRI did not provide more sensitive measures of AD-related cBF changes compared to volumetry.

Keywords: Alzheimer’s Disease; Cholinergic Basal Forebrain; Functional Connectivity; Mean Diffusivity; Resting-state fMRI; Subjective Cognitive Decline.


Conflict of interest statement

The authors declare that they have no known competing financial interests or personal relationships that could have appeared to influence the work reported in this paper.

Figures

Fig. 1
Fig. 1
Anatomic location and functional connectivity profiles of the cBF. A) Coronal slices from anterior to posterior showing the anterior-medial (a-cBF, green) and posterior-lateral (p-cBF, red) cBF regions of interest on representative coronal sections. B) Functional connectivity across all groups for a-cBF and p-cBF regions of interest on representative axial, mid-sagittal, and three coronal sections. Numbers below the brain sections indicate Montreal Neurological Institute (MNI) standard space coordinates. Colorbar indicates T-values (p < 0.05 [FWE]). (For interpretation of the references to colour in this figure legend, the reader is referred to the web version of this article.)
Fig. 2
Fig. 2
Voxel-wise group differences in a-cBF functional connectivity. A) Group differences between HC and MCI. MNI coordinates: X = 9, Y = 54, Z = 6. B) Group differences between HC and ADD. MNI coordinates: X = -9, Y = 39, Z = 3. Two sample t-tests controlled for age, gender, years of education, and acquisition site. Colorbar indicates Cohen’s d effect size values. Results are shown at an uncorrected voxel-wise threshold of p < 0.001 with a cluster-size threshold of k > 10 voxels.
Fig. 3
Fig. 3
Voxel-wise group differences in p-cBF functional connectivity. A) Group differences between HC and MCI. MNI coordinates: X = 51, Y = -45, Z = 15. B) Group differences between HC and ADD. Upper row: MNI coordinates: X = -3, Y = 30, Z = 15. Lower row: MNI coordinates: X = 18, Y = -3, Z = -18. Two sample t-tests controlled for age, gender, years of education, and acquisition site. Colorbar indicates Cohen’s d effect size values. Results are shown at an uncorrected voxel-wise threshold of p < 0.001 with a cluster-size threshold of k > 10 voxels.
Fig. 4
Fig. 4
Group differences in a-cBF and p-cBF volume and MD. Subregional volumes (A), and MD (B) for HC, SCD, MCI and ADD groups. Volume was normalized with total intracranial volume (TIV). Displayed are group wise means and standard errors of TIV-normalized volumes and MD.
Fig. 5
Fig. 5
Voxel-wise group differences in a-cBF functional connectivity in the amyloid stratified subgroups. A) Group differences between HC– and SCD + . Upper row: MNI coordinates: X = 15, Y = -9, Z = -15; Lower row: MNI coordinates: X = -6, Y = 42, Z = 15. B) Group differences between HC– and MCI + . MNI coordinates: X = 9, Y = 39, Z = 18. C) Group differences between HC– and ADD + . MNI coordinates: X = 0, Y = 36, Z = 18. Two sample t-tests controlled for age, gender, years of education, and acquisition site. Colorbar indicates Cohen’s d effect size values. Results are shown at an uncorrected voxel-wise threshold of p < 0.001 with a cluster-size threshold of k > 10 voxels.
Fig. 6
Fig. 6
Voxel-wise group differences in p-cBF functional connectivity in the amyloid stratified subgroups. A) Group differences between HC– and SCD + . MNI coordinates: X = -21, Y = 9, Z = -12. B) Group differences between HC– and MCI + . MNI coordinates: X = -6, Y = 6, Z = -6. C) Group differences between HC– and ADD + . MNI coordinates: X = -6, Y = 6, Z = -6. Two sample t-tests controlled for age, gender, years of education, and acquisition site. Colorbar indicates Cohen’s d effect size values. Results are shown at an uncorrected voxel-wise threshold of p < 0.001 with a cluster-size threshold of k > 10 voxels.
Fig. 7
Fig. 7
Group differences in a-cBF and p-cBF volume and MD in the amyloid-stratified subgroups. Subregional volumes (A), and MD (B) for diagnostic groups stratified by amyloid status as determined by the CSF Aβ42/40-ratio. Volume was normalized with total intracranial volume (TIV). Displayed are the group wise means and standard errors of TIV-normalized volumes and MD.

References

    1. Albert M.S., DeKosky S.T., Dickson D., Dubois B., Feldman H.H., Fox N.C., Gamst A., Holtzman D.M., Jagust W.J., Petersen R.C., Snyder P.J., Carrillo M.C., Thies B., Phelps C.H. The diagnosis of mild cognitive impairment due to Alzheimer's disease: Recommendations from the National Institute on Aging-Alzheimer's Association workgroups on diagnostic guidelines for Alzheimer's disease. Alzheim. Demen. 2011;7(3):270–279. doi: 10.1016/j.jalz.2011.03.008. - DOI - PMC - PubMed
    1. Ashburner J. A fast diffeomorphic image registration algorithm. NeuroImage. 2007;38(1):95–113. doi: 10.1016/j.neuroimage.2007.07.007. - DOI - PubMed
    1. Basser P.J., Mattiello J., Lebihan D. Estimation of the Effective Self-Diffusion Tensor from the NMR Spin Echo. J. Magn. Reson., Ser B. 1994;103(3):247–254. doi: 10.1006/jmrb.1994.1037. - DOI - PubMed
    1. Biswal B., Zerrin Yetkin F., Haughton V.M., Hyde J.S. Functional connectivity in the motor cortex of resting human brain using echo-planar mri. Magn. Reson. Med. 1995;34(4):537–541. doi: 10.1002/mrm.1910340409. - DOI - PubMed
    1. Bohnen N.I., Grothe M.J., Ray N.J., Müller M.L.T.M., Teipel S.J. Recent Advances in Cholinergic Imaging and Cognitive Decline—Revisiting the Cholinergic Hypothesis of Dementia. Curr Geri Rep. 2018;7(1):1–11. doi: 10.1007/s13670-018-0234-4. - DOI - PMC - PubMed

Publication types

MeSH terms