. 2020:28:102499.
doi: 10.1016/j.nicl.2020.102499. Epub 2020 Nov 11.

Progressive multifocal leukoencephalopathy lesion and brain parenchymal segmentation from MRI using serial deep convolutional neural networks

Affiliations

Progressive multifocal leukoencephalopathy lesion and brain parenchymal segmentation from MRI using serial deep convolutional neural networks

Omar Al-Louzi et al. Neuroimage Clin. 2020.

Abstract

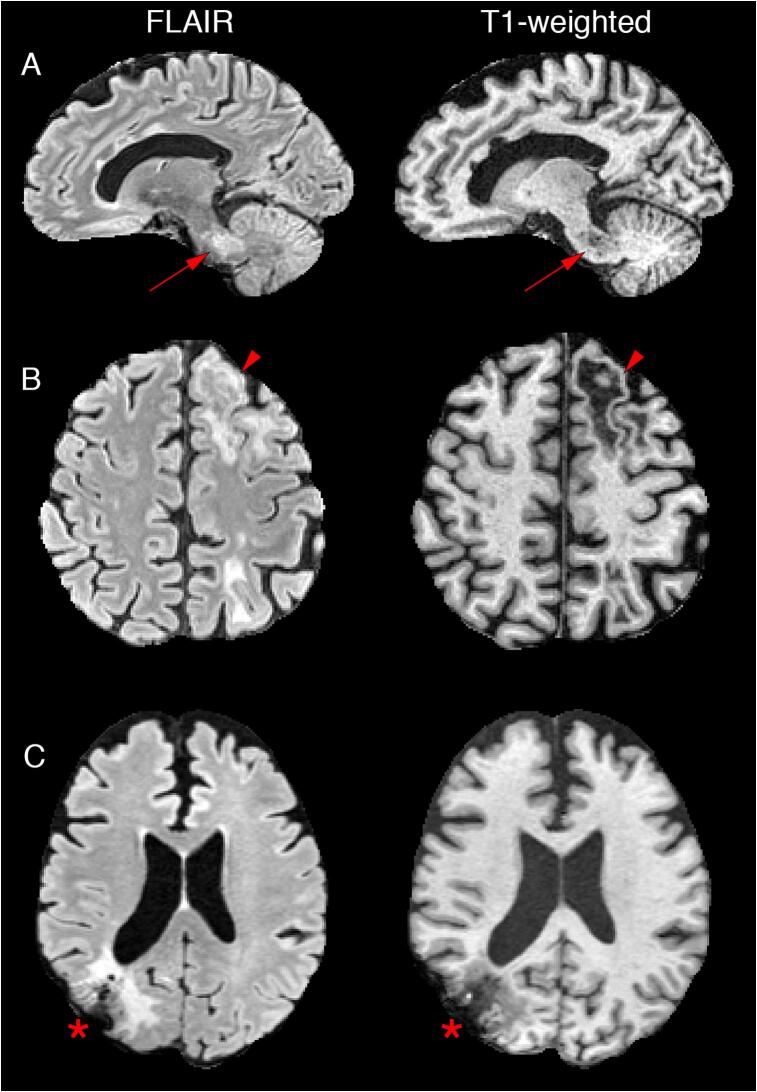
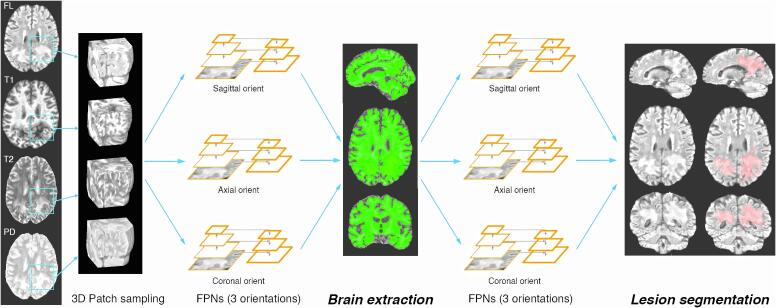
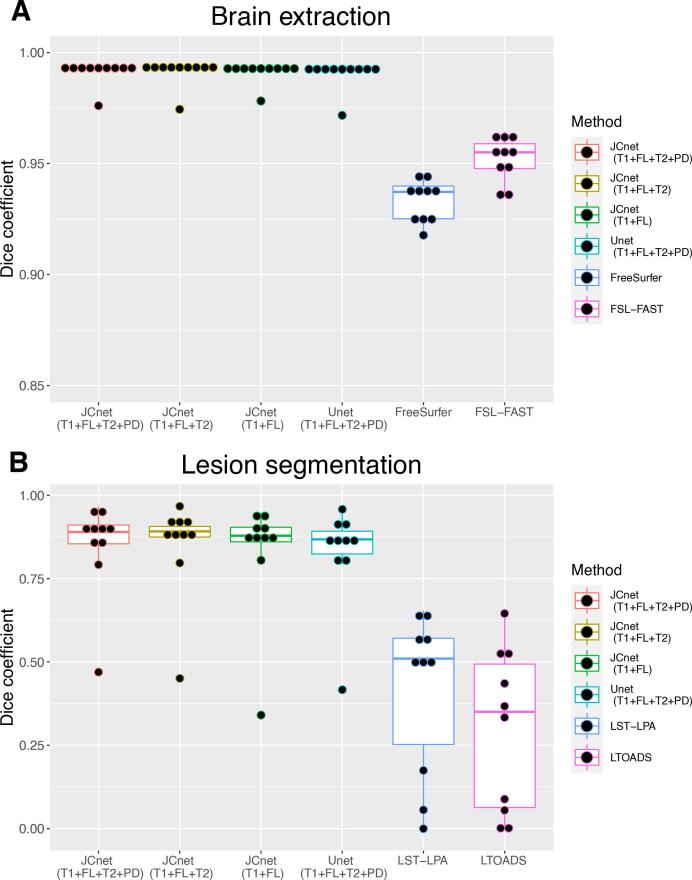
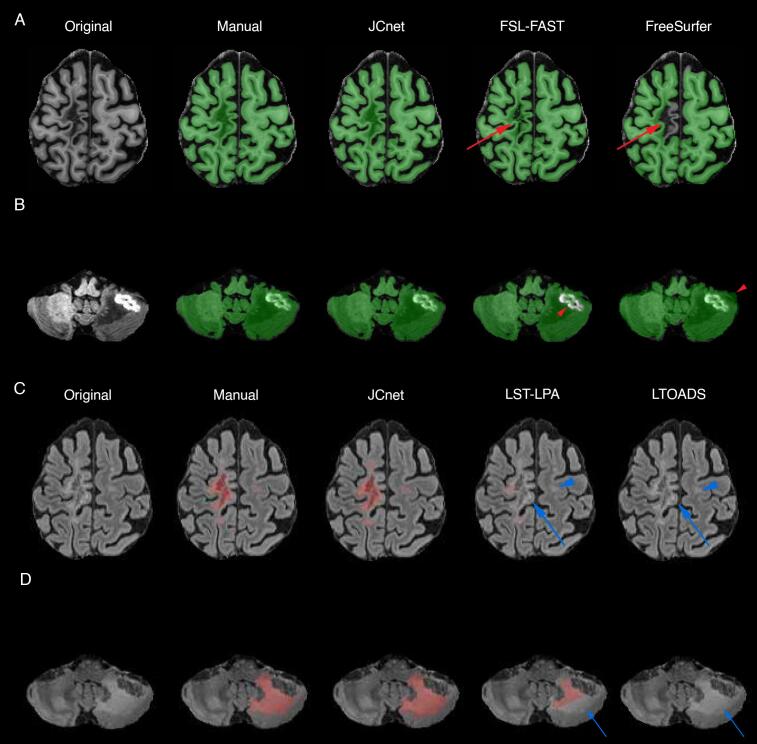
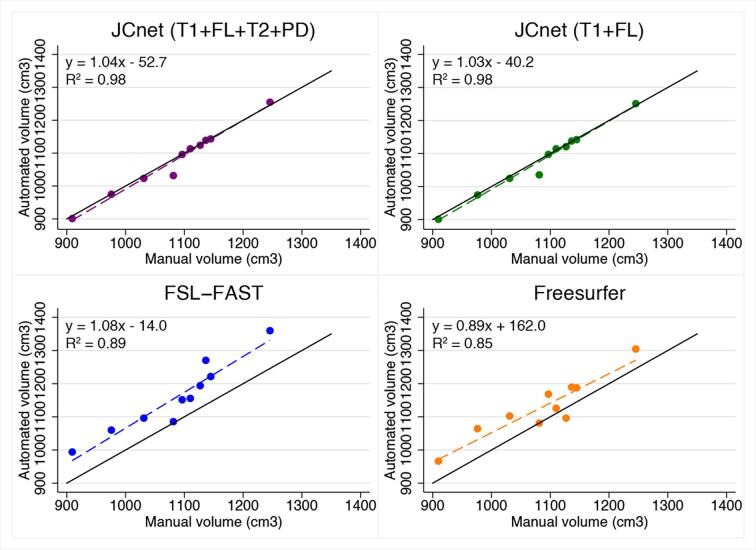
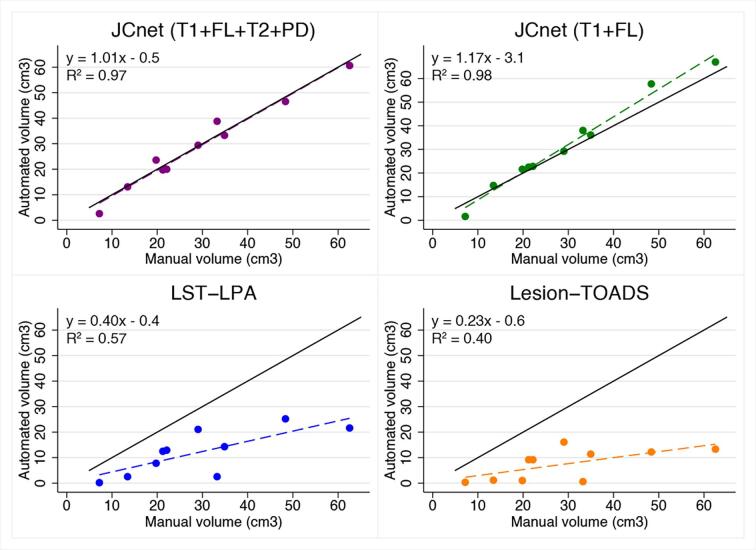
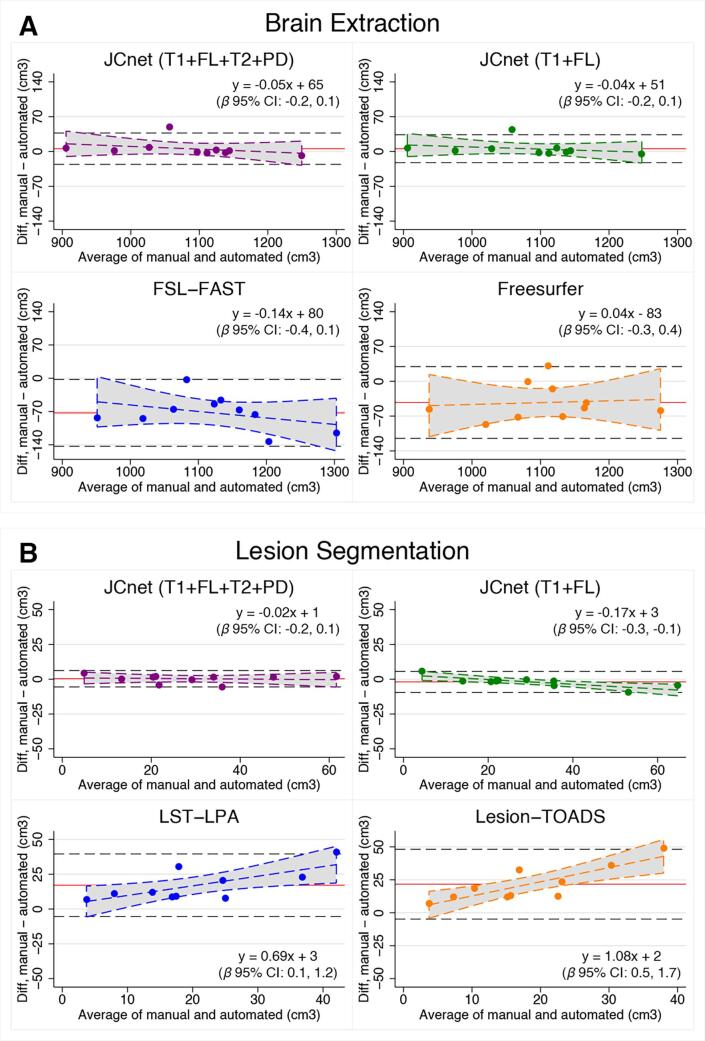
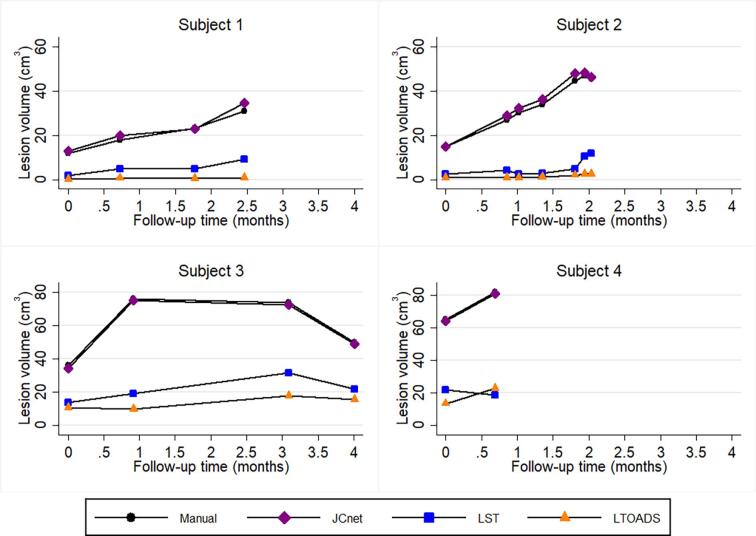
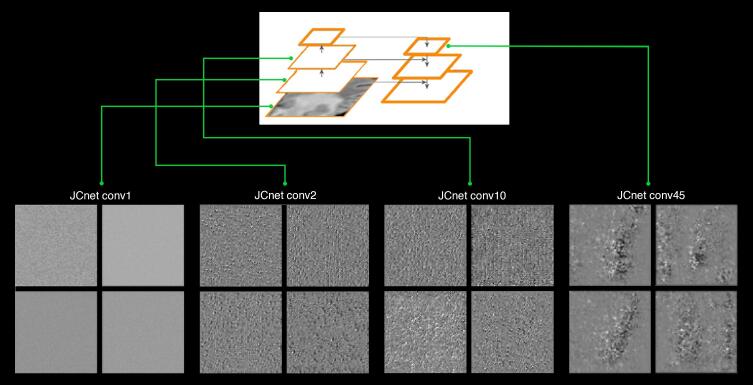
Progressive multifocal leukoencephalopathy (PML) is a rare opportunistic brain infection caused by the JC virus and associated with substantial morbidity and mortality. Accurate MRI assessment of PML lesion burden and brain parenchymal atrophy is of decisive value in monitoring the disease course and response to therapy. However, there are currently no validated automatic methods for quantification of PML lesion burden or associated parenchymal volume loss. Furthermore, manual brain or lesion delineations can be tedious, require the use of valuable time resources by radiologists or trained experts, and are often subjective. In this work, we introduce JCnet (named after the causative viral agent), an end-to-end, fully automated method for brain parenchymal and lesion segmentation in PML using consecutive 3D patch-based convolutional neural networks. The network architecture consists of multi-view feature pyramid networks with hierarchical residual learning blocks containing embedded batch normalization and nonlinear activation functions. The feature maps across the bottom-up and top-down pathways of the feature pyramids are merged, and an output probability membership generated through convolutional pathways, thus rendering the method fully convolutional. Our results show that this approach outperforms and improves longitudinal consistency compared to conventional, state-of-the-art methods of healthy brain and multiple sclerosis lesion segmentation, utilized here as comparators given the lack of available methods validated for use in PML. The ability to produce robust and accurate automated measures of brain atrophy and lesion segmentation in PML is not only valuable clinically but holds promise toward including standardized quantitative MRI measures in clinical trials of targeted therapies. Code is available at: https://github.com/omarallouz/JCnet.

Keywords: Brain parenchymal fraction; Convolutional neural networks; Deep learning; Lesion segmentation; Magnetic resonance imaging; Progressive multifocal leukoencephalopathy.


Figures

Fig. 1
Fig. 1
Illustration of the different challenges unique to progressive multifocal leukoencephalopathy (PML) lesion and brain segmentation on fluid attenuated inversion recovery (FLAIR) and T1-weighted MRI sequences. Given the multifocal nature of PML, there is often a preponderance of infratentorial structure involvement, including the middle cerebellar peduncles (Panel A, red arrows). PML lesions are often associated with confluent areas of T1 hypointensity with overlying cortical thinning, as seen in the left anterior frontal lobe in Panel B (red arrowheads), which can be readily misclassified as cerebrospinal fluid by conventional methods. Many patients with PML undergo brain biopsies as part of their diagnostic work-up, resulting in further cranial and outer brain parenchymal distortions on imaging, as illustrated in the right parietooccipital cortex and subcortical white matter in Panel C (asterisk). (For interpretation of the references to colour in this figure legend, the reader is referred to the web version of this article.)
Fig. 2
Fig. 2
Overview of the proposed two stage approach of JCnet. Three-dimensional patch samples are extracted from input skull-stripped contrast modalities, reoriented, and used to train three multi-view feature pyramid networks (FPNs) to identify the brain parenchyma as foreground, with meninges and cerebrospinal fluid spaces as background. The second stage utilizes a similar neural network architecture to perform PML lesion segmentation, illustrated in light red. Abbreviations: FPNs = feature pyramid networks; orient = orientation. (For interpretation of the references to colour in this figure legend, the reader is referred to the web version of this article.)
Fig. 3
Fig. 3
Mean Dice similarity coefficients and 95% confidence intervals of brain extraction and lesion segmentation displayed by input patch size across the PML testing set. For brain extraction, models with a variety of patch sizes performed similarly using a threshold range of 0.5–0.6, but a more rapid drop-off in accuracy at the tails of the membership distribution was noted for the 80x80x80 patch size model. For lesion segmentation at the best performing threshold for each model, the 64x64x64 model performed better than the smaller 32x32x32 patch size model (mean DSC difference 0.022; p = 0.01). Otherwise, pairwise comparisons between the lesion segmentation models at their best performing threshold were not statistically significant.
Fig. 4
Fig. 4
Box plots of Dice similarity coefficients (DSC) between JCnet with different input contrast specifications and the comparator methods for brain extraction (Panel A) and lesion segmentation (Panel B) across 10 PML subject test cases. The single outlier subject with a DSC < 0.5 using JCnet, and DSC < 0.05 on LST-LPA and LTOADS, had the smallest lesion size of all the test subjects (7.2 cm3). Abbreviations: FL = fluid-attenuated inversion recovery image; FSL-FAST = FMRIB's Automated Segmentation Tool; Lesion-TOADS = Lesion-TOpology-preserving Anatomical Segmentation; LST-LPA = Lesion Segmentation Tool - Lesion prediction algorithm; PD = proton density image; T1 = T1-weighted image; T2 = T2-weighted image.
Fig. 5
Fig. 5
Visual depictions of the performance of the proposed and comparator methods on 2 PML test subjects. Rows A and B demonstrate T1-weighted images with binary brain parenchymal masks overlaid in green, whereas Rows C and D demonstrate FLAIR images with lesion segmentation results overlaid in light red. JCnet displayed improved brain extraction results in areas of underlying T1-hypointensity, particularly near the cortical mantle (Row A, red arrows). Similarly, regions of post-biopsy related signal changes, as seen in the left cerebellum in Row B, showed a reduction of false negative voxels within the biopsy bed compared to FSL-FAST and false positive voxels outside the meningeal folds compared to FreeSurfer (red arrowheads). An improvement in PML lesion delineation was seen across the spectrum of supratentorial and infratentorial lesions (Rows C and D, blue arrows). There was also a concomitant improvement in the detection of lesions that were entirely missed by the other methods (blue arrowheads). Abbreviations: FLAIR = fluid-attenuated inversion recovery; PML = progressive multifocal leukoencephalopathy. (For interpretation of the references to colour in this figure legend, the reader is referred to the web version of this article.)
Fig. 6
Fig. 6
Scatter plots of automated versus manual brain parenchymal volumes for JCnet with 4 input contrasts compared to FSL-FAST, and JCnet with 2 input contrasts compared to FreeSurfer. Solid black lines represent the identity lines. Dashed lines represent the linear regression fit for each method. Abbreviations: FL = fluid-attenuated inversion recovery image; FSL-FAST = FMRIB's Automated Segmentation Tool; PD = proton density image; T1 = T1-weighted image; T2 = T2-weighted image.
Fig. 7
Fig. 7
Scatter plots of automated versus manual lesion masks comparing JCnet, LST-LPA, and Lesion-TOADS . Solid black lines represent y = x identity lines. Dashed lines represent linear regression fit for each method. Abbreviations: FL = fluid-attenuated inversion recovery image; Lesion-TOADS = Lesion-TOpology-preserving Anatomical Segmentation; LST-LPA = Lesion Segmentation Tool - Lesion prediction algorithm; PD = proton density image; T1 = T1-weighted image; T2 = T2-weighted image.
Fig. 8
Fig. 8
Bland-Altman plots comparing manual delineations with all other methods included in our analysis for brain extraction (Panel A) and lesion segmentation (Panel B). The red horizontal line represents the mean of the differences and the black dashed horizontal lines represent the upper and lower limits of agreement, calculated as the mean ± 1.96SD. The dashed colored lines for each method represent the linear regression fit and 95% confidence intervals (shaded gray region), with the regression parameters and 95% confidence interval of the slope (i.e. β coefficient) included in the inset for each method. Abbreviations: FL = fluid-attenuated inversion recovery image; FSL-FAST = FMRIB's Automated Segmentation Tool; Lesion-TOADS = Lesion-TOpology-preserving Anatomical Segmentation; LST-LPA = Lesion Segmentation Tool - Lesion prediction algorithm; PD = proton density image; T1 = T1-weighted image; T2 = T2-weighted image. (For interpretation of the references to colour in this figure legend, the reader is referred to the web version of this article.)
Fig. 9
Fig. 9
Longitudinal lesion profile plots of 4 PML test subjects comparing the consistency of JCnet (purple), LST-LPA (blue), and LTOADS (orange) with those of manual delineations (black). Dynamic lesion volume changes over time were better captured using convolutional neural networks trained on PML cases (JCnet), compared to other methods developed for multiple sclerosis lesion segmentation (LST-LPA and LTOADS) which did not fully reflect the extent of lesion accumulation over time in Subjects 1, 2, and 4. Abbreviations: LTOADS = Lesion-TOpology-preserving Anatomical Segmentation; LST-LPA = Lesion Segmentation Tool - Lesion prediction algorithm; PML = progressive multifocal leukoencephalopathy. (For interpretation of the references to colour in this figure legend, the reader is referred to the web version of this article.)
Fig. 10
Fig. 10
Examples of filter activation patterns within successive layers of increasing depth within the JCnet lesion segmentation convolutional neural network extracted from the midpoint slice of the 3D FLAIR input channel. Only 4 representative filters are displayed per layer from the entire set of available filters. In shallow layers, these resemble hyperfine texture patterns and then evolve to checker-like or polka-dot patterns in intermediate layers. In deeper layers (far right), more abstract visual patterns start to emerge, which arguably bear some resemblance to discrete or confluent PML lesions. Abbreviations: conv = convolutional layer.

Similar articles

Cited by

References

    1. Avants B.B., Tustison N.J., Song G., Cook P.A., Klein A., Gee J.C. A reproducible evaluation of ANTs similarity metric performance in brain image registration. NeuroImage. 2011;54(3):2033–2044. doi: 10.1016/j.neuroimage.2010.09.025. - DOI - PMC - PubMed
    1. Berger J.R., Aksamit A.J., Clifford D.B., Davis L., Koralnik I.J., Sejvar J.J., Bartt R., Major E.O., Nath A. PML diagnostic criteria: Consensus statement from the AAN Neuroinfectious Disease Section. Neurology. 2013;80(15):1430–1438. doi: 10.1212/WNL.0b013e31828c2fa1. - DOI - PMC - PubMed
    1. Carson, K.R., Evens, A.M., Richey, E.A., Habermann, T.M., Focosi, D., Seymour, J.F., Laubach, J., Bawn, S.D., Gordon, L.I., Winter, J.N., Furman, R.R., Vose, J.M., Zelenetz, A.D., Mamtani, R., Raisch, D.W., Dorshimer, G.W., Rosen, S.T., Muro, K., Gottardi-Littell, N.R., Talley, R.L., Sartor, O., Green, D., Major, E.O., Bennett, C.L., 2009. Progressive multifocal leukoencephalopathy after rituximab therapy in HIV-negative patients: A report of 57 cases from the Research on Adverse Drug Events and Reports project. Blood 113, 4834–4840. https://doi.org/10.1182/blood-2008-10-186999. - PMC - PubMed
    1. Chollet F. Manning. Manning Publications Co.; Shelter Island NY: 2017. Deep Learning with Python.
    1. Çiçek Ö., Abdulkadir A., Lienkamp S.S., Brox T., Ronneberger O. 3D U-Net: Learning Dense Volumetric Segmentation from Sparse Annotation. Lect. Notes Comput. Sci. (including Subser. Lect. Notes Artif. Intell. Lect. Notes Bioinformatics) 2016;9901 LNCS:424–432.

Publication types

MeSH terms