

Global Genome Conformational Programming during Neuronal Development Is Associated with CTCF and Nuclear FGFR1-The Genome Archipelago Model
- PMID: 33396256
- PMCID: PMC7795191
- DOI: 10.3390/ijms22010347
Global Genome Conformational Programming during Neuronal Development Is Associated with CTCF and Nuclear FGFR1-The Genome Archipelago Model
Abstract
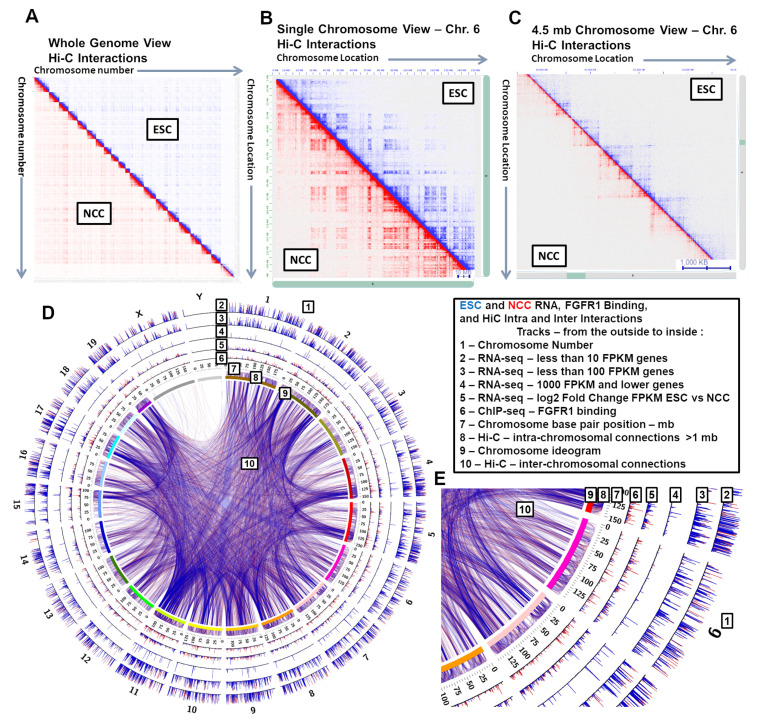
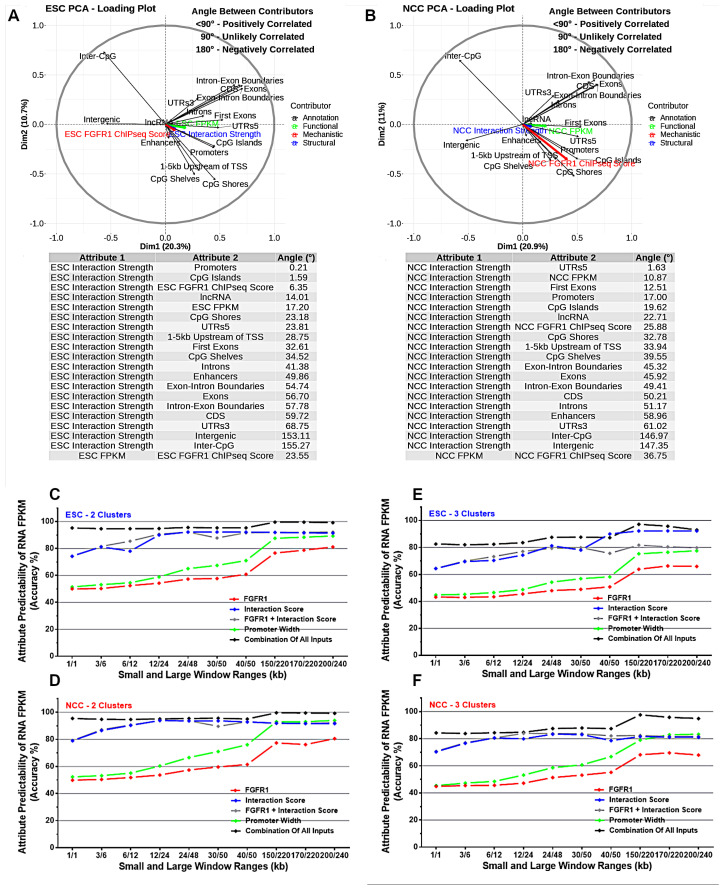
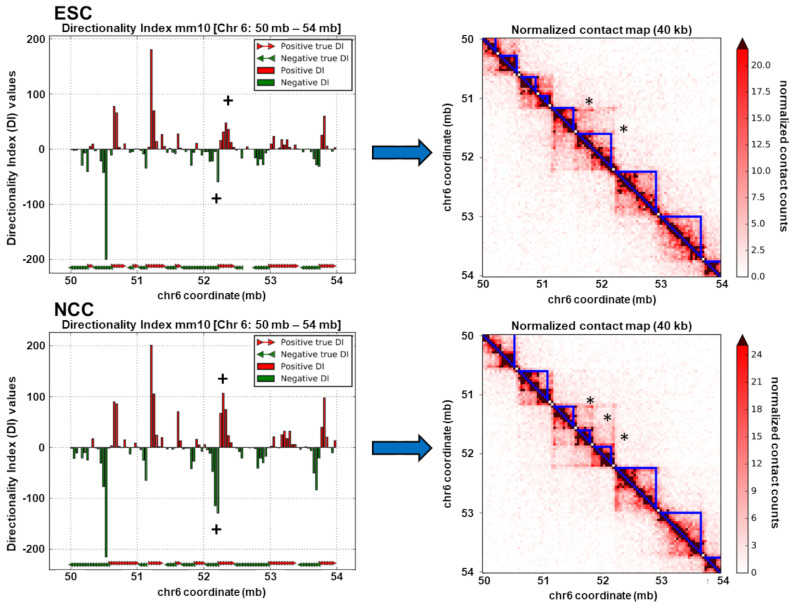
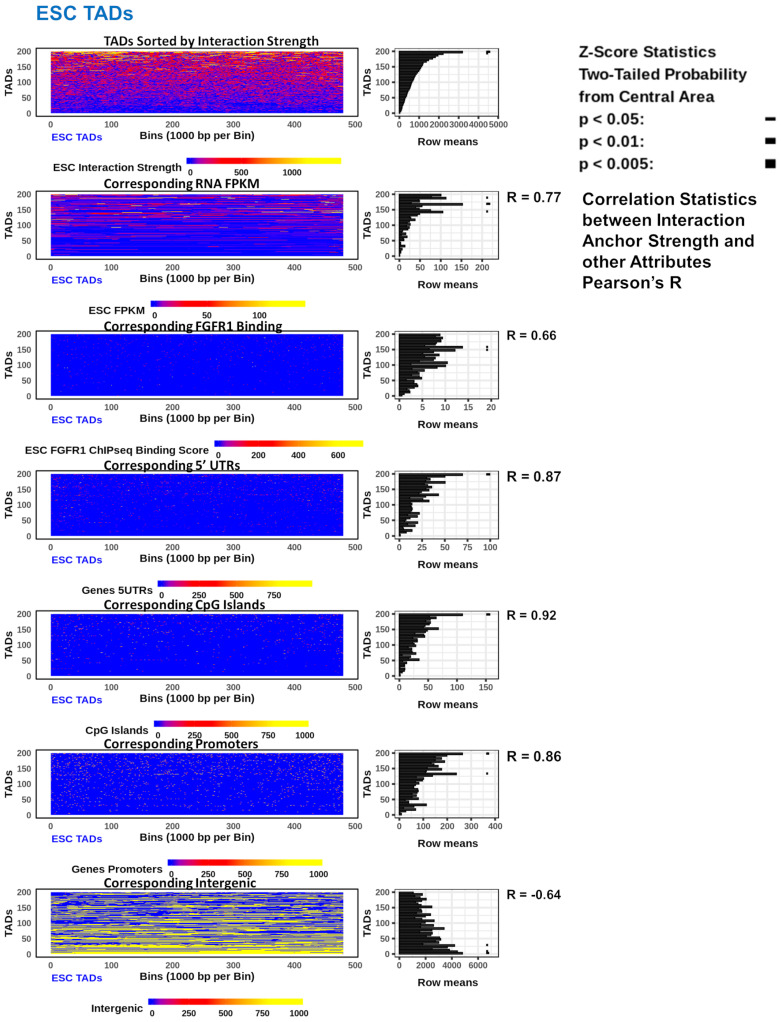
During the development of mouse embryonic stem cells (ESC) to neuronal committed cells (NCC), coordinated changes in the expression of 2851 genes take place, mediated by the nuclear form of FGFR1. In this paper, widespread differences are demonstrated in the ESC and NCC inter- and intra-chromosomal interactions, chromatin looping, the formation of CTCF- and nFGFR1-linked Topologically Associating Domains (TADs) on a genome-wide scale and in exemplary HoxA-D loci. The analysis centered on HoxA cluster shows that blocking FGFR1 disrupts the loop formation. FGFR1 binding and genome locales are predictive of the genome interactions; likewise, chromatin interactions along with nFGFR1 binding are predictive of the genome function and correlate with genome regulatory attributes and gene expression. This study advances a topologically integrated genome archipelago model that undergoes structural transformations through the formation of nFGFR1-associated TADs. The makeover of the TAD islands serves to recruit distinct ontogenic programs during the development of the ESC to NCC.
Keywords: FGFR1; HoxA; chromatin structure; embryonic stem cells; neuronal committed cells.
Conflict of interest statement
The authors declare no conflict of interest.
Figures
 ; p < 0.01
 ; p < 0.005
 .
. ; p < 0.01; p < 0.005.
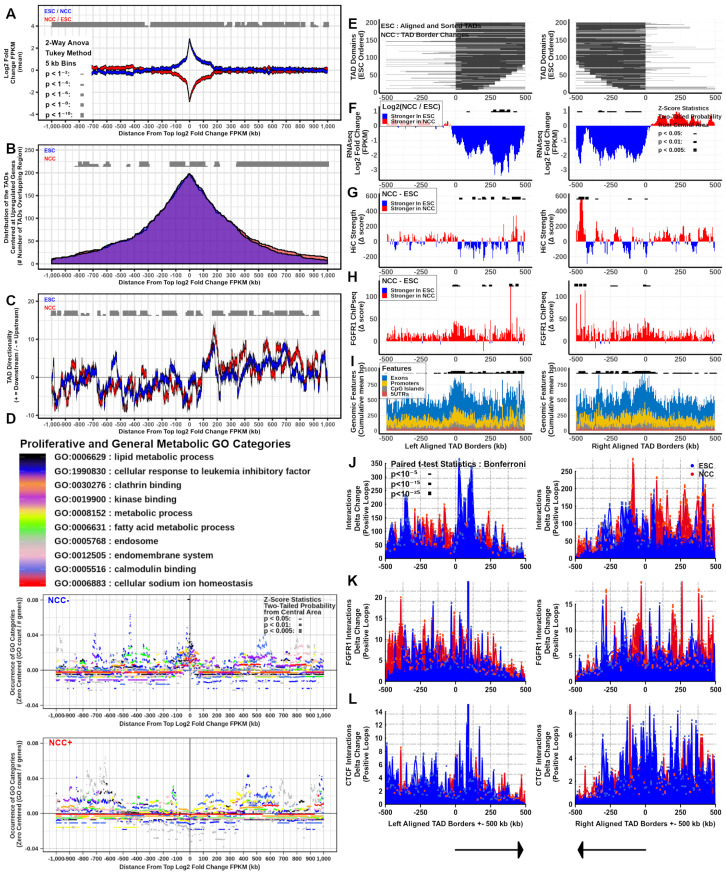 ; p < 1−4; p < 1−6; p < 1−8
 ; p < 1−10
 . At TAD borders aligned left and right based on regulated gene directionality (adjusted p < 0.05): (E) TAD reorganization. (F) Differential gene expression. (G) Differential interaction anchor strength. (H) Differential nFGFR1 binding. (I) Differential gene coding and regulator feature enrichment. Z-Score statistics indicate bins which are outside the mean of all bins p < 0.05; p < 0.01; p < 0.005. (J) Differential chromatin looping. (K) Differential nFGFR1 looping. (L) Differential CTCF looping. Paired T-Test Bonferroni adjusted p < 10−5; p < 10−15; p < 10−25.
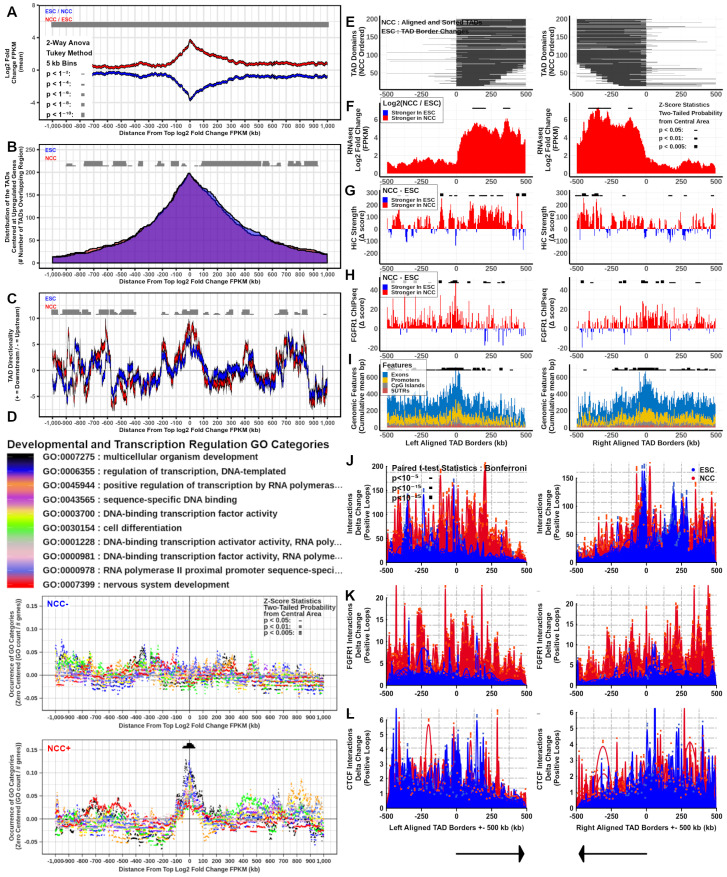 ; p < 1−4; p < 1−6; p < 1−8; p < 1−10. At TAD borders aligned left and right based on regulated gene directionality (adjusted p < 0.05): (E) TAD reorganization. (F) Differential gene expression. (G) Differential interaction anchor strength. (H) Differential nFGFR1 binding. (I) Differential gene coding and regulator feature enrichment. Z-Score statistics indicate bins which are outside the mean of all bins p < 0.05; p < 0.01; p < 0.005. (J) Differential chromatin looping. (K) Differential nFGFR1 looping. (L) Differential CTCF looping. Paired T-Test Bonferroni adjusted p < 10−5; p < 10−15; p < 10−25.
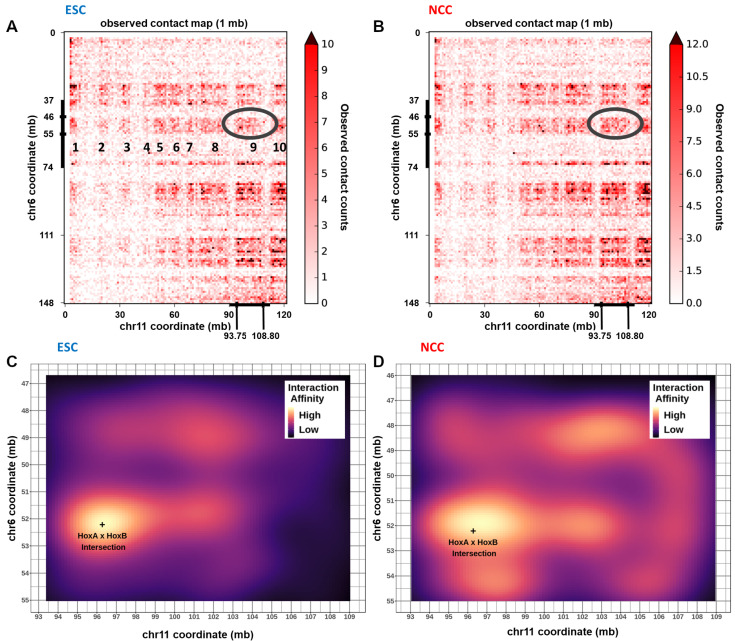
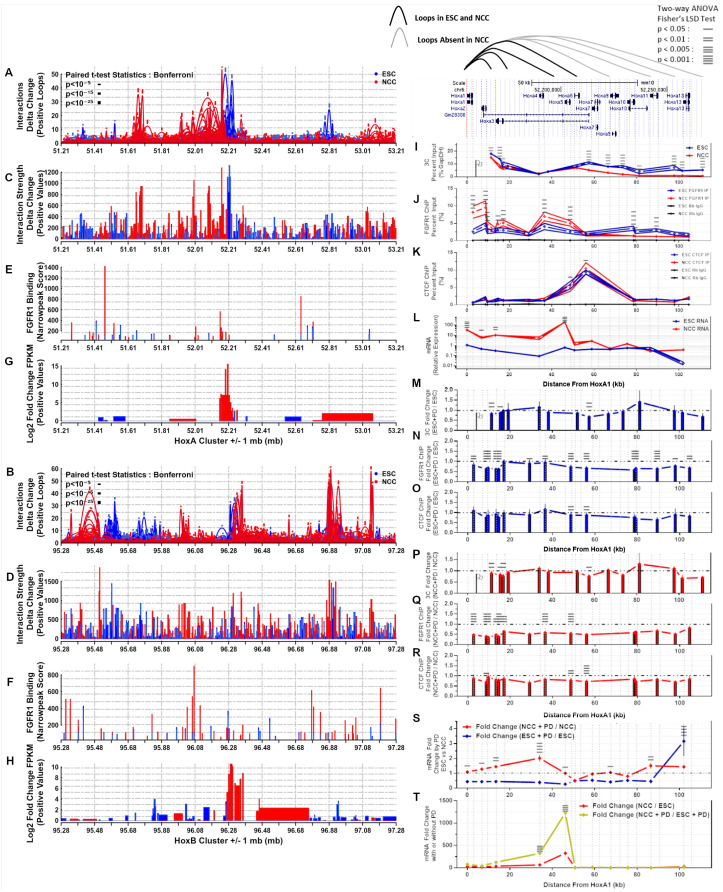 ; p < 10−15; p < 10−25. (C,D) Differential interaction anchor strength. (E,F) nFGFR1 binding. (G,H) Differential gene expression. (I) Interactions of HoxA1 with downstream HoxA2-A13. (J) nFGFR1 binding. (K) CTCF binding. (L) Gene expression. (M,P) PD fold change of HoxA1:HoxA2-A13 interactions. (N,Q) PD fold change of nFGFR1 binding. (O,R) PD fold change of CTCF binding. (S) PD fold change of gene expression. (T) ESC to NCC fold change with and without PD. Two-way ANOVA Fisher’s LSD Test: p < 0.05 —p < 0.01 =, p < 0.005 ≡, p < 0.001 ≡.
References
-
- Terranova C., Narla S.T., Lee Y.W., Bard J., Parikh A., Stachowiak E.K., Tzanakakis E.S., Buck M.J., Birkaya B., Stachowiak M.K. Global Developmental Gene Programing Involves a Nuclear Form of Fibroblast Growth Factor Receptor-1 (FGFR1) PLoS ONE. 2015;10:e0123380. doi: 10.1371/journal.pone.0123380. - DOI - PMC - PubMed
-
- Stachowiak E.K., Benson C.A., Narla S.T., Dimitri A., Chuye L.E.B., Dhiman S., Harikrishnan K., Elahi S., Freedman D., Brennand K.J., et al. Cerebral organoids reveal early cortical maldevelopment in schizophrenia—Computational anatomy and genomics, role of FGFR1. Transl. Psychiatry. 2017;7:6. doi: 10.1038/s41398-017-0054-x. - DOI - PMC - PubMed
MeSH terms
Substances
Grants and funding
LinkOut - more resources
Full Text Sources
Molecular Biology Databases
Miscellaneous
