. 2020 Dec 31;13(1):102.
doi: 10.3390/cancers13010102.

Acriflavine, a Potent Inhibitor of HIF-1α, Disturbs Glucose Metabolism and Suppresses ATF4-Protective Pathways in Melanoma under Non-Hypoxic Conditions

Affiliations

Acriflavine, a Potent Inhibitor of HIF-1α, Disturbs Glucose Metabolism and Suppresses ATF4-Protective Pathways in Melanoma under Non-Hypoxic Conditions

Román Martí-Díaz et al. Cancers (Basel). .

Abstract

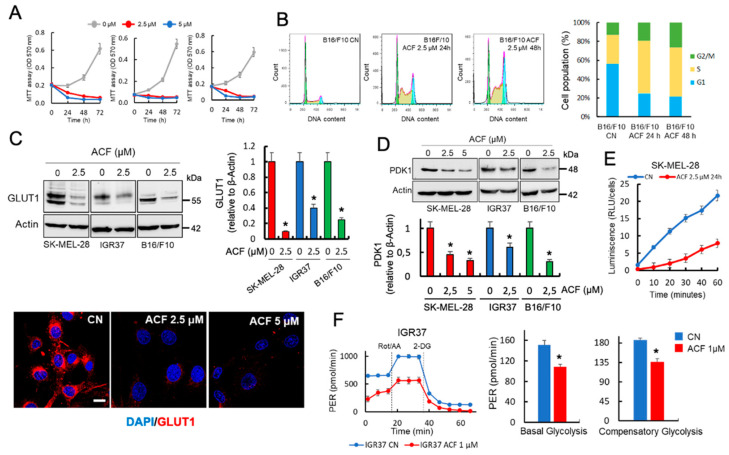
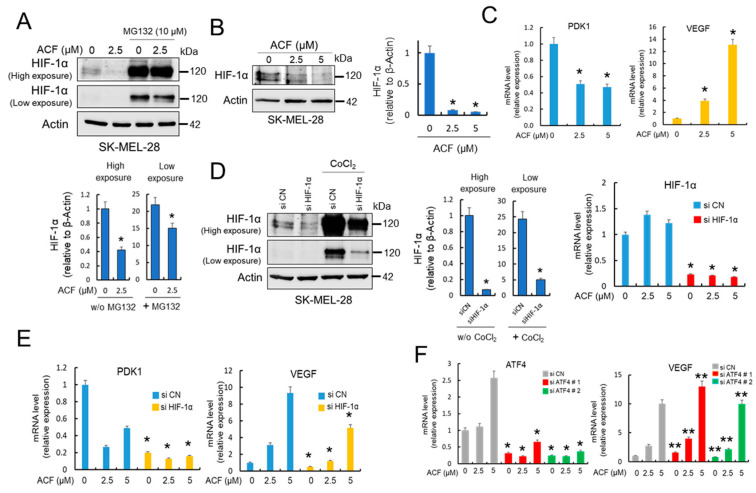
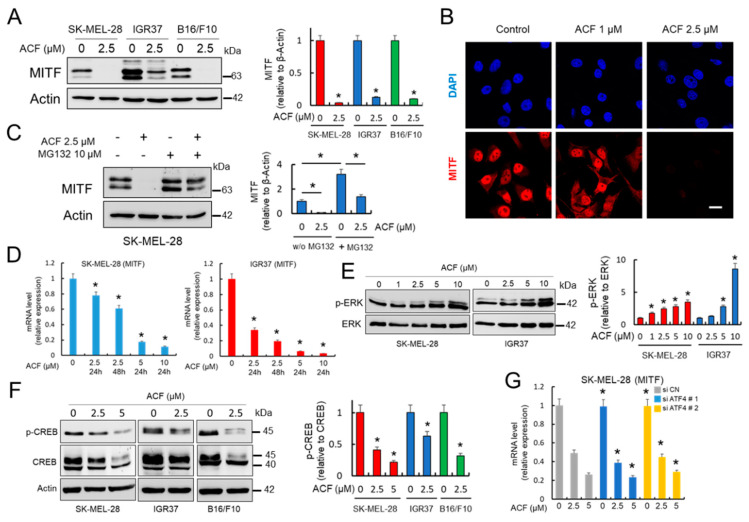
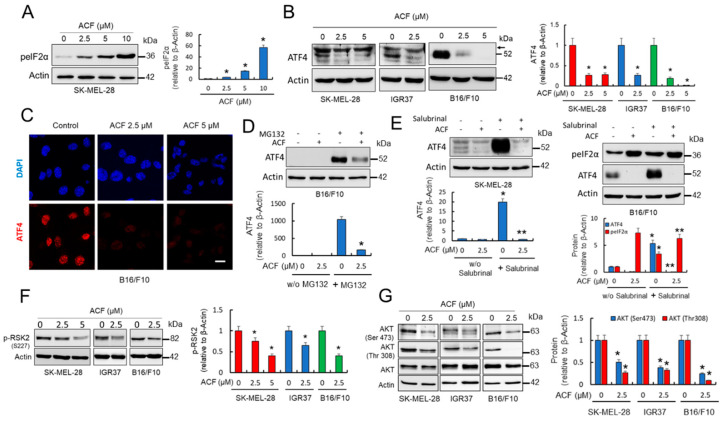
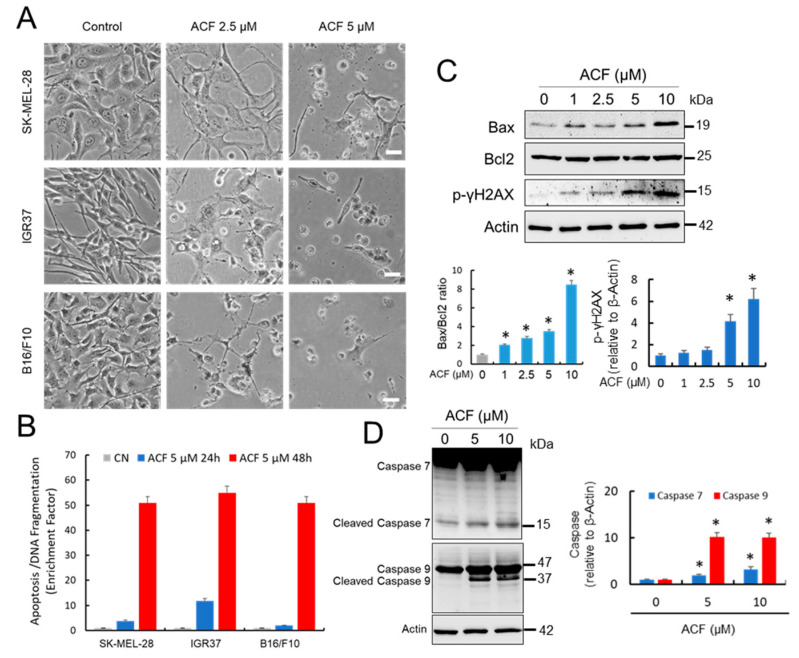
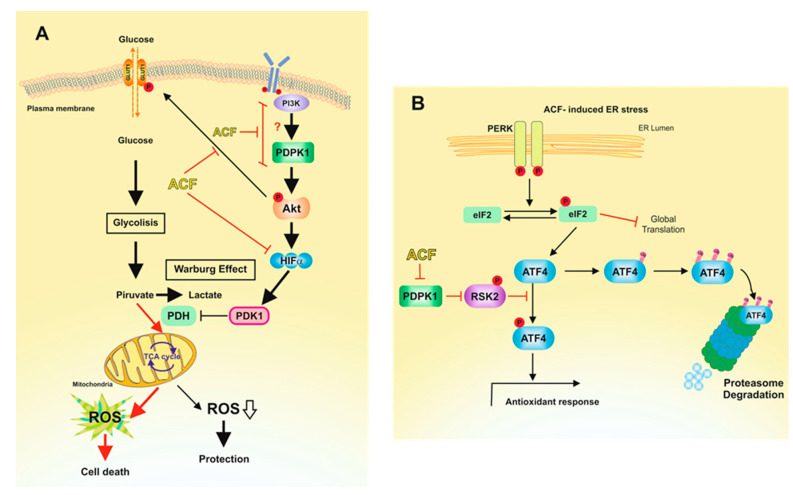
Hypoxia-inducible factor (HIF)-1α is constitutively expressed in melanoma cells under normoxic conditions and its elevated expression correlates with the aggressiveness of melanoma tumors. Here, we used acriflavine, a potent inhibitor of HIF-1α dimerization, as a tool to investigate whether HIF-1α-regulated pathways contribute to the growth of melanoma cells under normoxia. We observed that acriflavine differentially modulated HIF-1α-regulated targets in melanoma under normoxic conditions, although acriflavine treatment resulted in over-expression of vascular endothelial growth factor (VEGF), its action clearly downregulated the expression of pyruvate dehydrogenase kinase 1 (PDK1), a well-known target of HIF-1α. Consequently, downregulation of PDK1 by acrifavine resulted in reduced glucose availability and suppression of the Warburg effect in melanoma cells. In addition, by inhibiting the AKT and RSK2 phosphorylation, acriflavine also avoided protective pathways necessary for survival under conditions of oxidative stress. Interestingly, we show that acriflavine targets activating transcription factor 4 (ATF4) for proteasomal degradation while suppressing the expression of microphthalmia-associated transcription factor (MITF), a master regulator of melanocyte development and a melanoma oncogene. Since acriflavine treatment results in the consistent death of melanoma cells, our results suggest that inhibition of HIF-1α function in melanoma could open new avenues for the treatment of this deadly disease regardless of the hypoxic condition of the tumor.

Keywords: ATF4; HIF-1α; MITF; acriflavine; glucose metabolism; melanoma; oxygen homeostasis.


Conflict of interest statement

The authors declare no conflict of interest.

Figures

Figure 1
Figure 1
Acriflavine (ACF) restricts glucose availability and suppresses the Warburg effect in melanoma cells. (A) Effects of ACF on the growth of indicated melanoma cells. Viability was determined by the MTT assay. The number of surviving cells is directly proportional to the level of the formazan product created and the color can then be quantified at 570 nm. The data values represent the mean from two independent experiments performed in triplicate. (B) Cell cycle assays were performed using flow cytometry of B16/F10 cells following ACF indicated treatments. Assays were performed in triplicate, and differences in the cell cycle populations were found to be statistically significant (p < 0.05) when treated cells were compared with control cells (CN). (C) Western blot (upper panels) and confocal microscopy (63X magnification) (lower panels) showing the expression of GLUT1 in indicated melanoma cells subjected to ACF treatments. The results are representative of three independent experiments. Scale bar, 27 μM. GLUT1 protein expression (histogram) was estimated by integrated optical density (IOD) in western blots after normalization to the β-actin IOD. * p < 0.05 when compared with ACF-untreated controls. (D) The total levels of PDK1 was examined in indicated melanoma cells using western blot analysis following the indicated ACF treatments. The IOD values (histogram) represent the mean from two experiments performed in triplicate. * p < 0.05 when compared with ACF-untreated control experiments. (E) Results of the Glucose Uptake-Glo Assay when SK-MEL-28 melanoma cells were treated with ACF. The values represent the mean from two experiments performed in triplicate and the reduction on glucose uptake after ACF was statistically significant at all-time tested (p < 0.05). (F) Glycolytic proton efflux rate (glycoPER) comparing untreated and ACF-treated IGR37 melanoma cells. The histograms represent individual parameters for basal glycolysis and compensatory glycolysis. IGR37 cells were treated with 1 μM ACF for 24 h and then incubated for 1 h in XF base medium. Each data point represents an ECAR measurement. Data are expressed as means ± SD, n = 5 technical replicates. The graphs are representative of three biological replicates. P values for significant differences (Student’s t-test) are summarized by one asterisk (* p < 0.001) and groups are compared to ACF-untreated samples.
Figure 2
Figure 2
ACF differentially modulates PDK1 and VEGF transcription in melanoma cells. (A) Western blot experiments for the effect of ACF on HIF-1α expression in the absence or the presence of MG132. SK-MEL-28 cells were treated for 12 h with ACF alone or simultaneously co-treated with ACF and MG132. High and low exposure make reference to the exposure time during development of the chemiluminescent signal. HIF-1α expression in the absence of MG132 (w/o MG132) was quantified on high exposure membranes, while that of HIF-1α expression in the presence of MG132 was evaluated on low exposure membranes to avoid overexposure (histograms). In both cases, relative HIF-1α content in the ACF-treated samples was compared with untreated controls in membranes developed under the respective exposure conditions (* p < 0.05). (B) Dose-dependent effect of ACF (24 h) on HIF-1α and IOD quantification (histogram; * p < 0.05). (C) Semiquantitative determination of PDK1 and VEGF mRNAs in SK-MEL-28 cells. Relative levels of mRNA (with respect to β-actin) in ACF-treated samples (24 h) were compared to the expression levels in untreated controls (* p < 0.05). (D) Effective silencing of HIF-1α was determined by both western blot experiments and mRNA determinations in SK-MEL-28 melanoma cells. To visualize the silencing of HIF-1α in western blots, the protein was stabilized with CoCl2 (200 µM). Images were obtained under high and low exposure as indicated in Figure 2A and quantified in indicated membranes (histograms) in the absence (w/o CoCl2) or the presence of CoCl2 (* p < 0.05). HIF-1α-mRNA in silenced samples were compared with their respective ACF treatments (24 h) in siControls (siCN) samples and differences were found statistically significant (* p < 0.05). (E) Semiquantitative determination of PDK1 and VEGF mRNAs in HIF-1α-silenced SK-MEL-28 cells. HIF-1α-mRNA in silenced samples were compared with their respective treatments in siCN samples (* p < 0.05). Although VEGF-mRNA decrease in siHIF-1α cells was found to be statistically significant with respect to siCNs, silencing of HIF-1α did not completely abolish ACF-dependent induction of VEGF. Cells were treated with ACF for 24 h. (F) Effective silencing of ATF4 with two different siRNAs (left panel) did not influence VEGF-mRNA expression in SK-MEL-28 cells. * p < 0.05 and ** not significant when compared with siATF4 samples with their respective treatments in siCN samples. When indicated, cells were treated with ACF for 24 h.
Figure 3
Figure 3
ACF decreases MITF expression in melanoma cells. (A) Effect of ACF (24 h) on MITF expression in melanoma cells analyzed by western blot. IOD quantification is shown (histogram; * p < 0.05 when compared with untreated controls). (B) Confocal microscopy analysis (63X magnification) of MITF in SK-MEL-28 melanoma cells under indicated conditions (cells were treated with ACF for 24 h). Bars, 27 μM. (C) Western blot experiments for the effect of ACF on MITF expression in the absence or the presence of MG132. SK-MEL-28 cells were treated for 12 h with ACF alone or simultaneously co-treated with ACF and MG132. * p < 0.05 when comparing indicated data groups. (D) qRT-PCR analysis of MITF mRNA in indicated melanoma cells before and after ACF treatments (24 h). Relative mRNA expression in treated cells was normalized with respect to untreated cells. * p < 0.05. (E) Effect of ACF (24 h) on the phosphorylation of ERK1/2 (p-ERK) in melanoma cells analyzed by western blot. Specific antibodies recognized the diphosphorylated forms of ERK1/2 (Thr183 and Tyr185 based in ERK2 nomenclature). Constitutive total ERK was used as a reference for p-ERK expression. IOD quantification is shown (histogram; * p < 0.05 when compared with untreated controls). (F) Effect of ACF (24 h) on Ser133 phosphorylation in CREB (p-CREB). Western blot of total CREB showed two clear bands at 40 and 45 kDa, corresponding to the upper band to phosphorylated CREB. IOD quantification is shown (histogram; * p < 0.05 when compared with untreated controls). (G) Effective silencing of ATF4 with two different siRNAs (Figure 2F) did not influence MITF-mRNA expression in SK-MEL-28 cells. * not significant when compared to siATF4 samples with their respective treatments in siCN samples. When indicated, cells were treated with ACF for 24 h.
Figure 4
Figure 4
ACF compromises ATF4 protein stability in melanoma cells. (A) Effect of ACF (24 h) on p-eIF2α expression in SK-MEL-28 melanoma cells analyzed by western blot. IOD quantification is shown (histogram; * p < 0.05 when compared with untreated control). (B) Western blot analysis of ATF4 in melanoma cells under indicated conditions (cells were treated with ACF for 24 h). Histogram represents ATF4 protein levels (detected as a band at 52 kDa) estimated by IOD in western blots after normalization to the β-actin IOD. The values represent the mean from two experiments performed in triplicate. * p < 0.05 when compared with ACF-untreated control experiments. Arrow indicates a nonspecific band observed in human samples at 58 kDa. (C) Confocal microscopy analysis (63X magnification) of ATF4 in control B16/F10 cells and those subjected to indicated ACF (24 h) treatments (bars, 27 μM). (D) Western blot experiments for the effect of ACF (2.5 µM) on ATF4 expression in the absence or the presence of MG132 (10 µM). SK-MEL-28 cells were treated for 12 h with ACF alone or simultaneously co-treated with ACF and MG132. MG132 significantly increased ATF4 in ACF-treated cells (* p < 0.05). (E) Western blot experiments for the effect of ACF (2.5 µM) on ATF4 expression in the absence or the presence of salubrinal (20 µM). Melanoma cells were treated during 24 h with ACF alone or simultaneously co-treated with ACF and salubrinal. As observed, ACF impedes ATF4 stabilization under forced stabilization of p-eIF2α * p < 0.05 and ** not significant when compared salubrinal treatments with their respective treatments without salubrinal (w/o salubrinal). (F) Effect of ACF (24 h) on the phosphorylation of RSK2 (p-RSK2) in melanoma cells analyzed by western blot. p-RSK2 (histogram) was estimated by integrated optical density (IOD) in western blots after normalization to the β-actin IOD. The values represent the mean from two experiments performed in triplicate. * p < 0.05 when compared with the ACF-untreated control experiments. (G) AKT phosphorylation was examined in melanoma cell extracts and compared with the expression levels of total AKT and β-actin. IOD quantification is shown (histogram; * p < 0.05 when compared with their respective untreated controls).
Figure 5
Figure 5
ACF induces apoptotic cell death in melanoma cells. (A) Morphological aspect of untreated melanoma cells compared with those subjected to 2-days of treatment with indicated concentrations of ACF (bars, 100 μM). 40× magnification (B) Apoptosis determination at different ACF concentrations in indicated melanoma cells after 24 and 48 h of treatment. Data were obtained in triplicate in two independent experiments. Differences in apoptosis in ACF-treated cells were significant with respect to untreated controls for each drug concentration and at any time (p < 0.05). (C) Western blots showing the effect of ACF on Bax, Bcl2, and p-γH2AX proteins. SK-MEL-28 cells were treated with different concentrations of ACF for two days. The ratios between Bax and Bcl2 and relative p-γH2AX are presented in the histograms (* p < 0.05 when compared with the untreated control). (D) Western blot analysis of caspase 7 and caspase 9 in the control SK-MEL-28 cells and those treated with indicated doses of ACF. IOD quantification is shown (histogram; * p < 0.05 when compared with their respective untreated controls).
Figure 6
Figure 6
Proposed mechanisms for the action of ACF on melanoma cells under normoxic conditions. (A) This picture reproduces the adaptation of melanoma cells to physiological concentrations of glucose. Restriction of glucose availability to physiological concentrations induces the production of ROS [16], which activate HIF-1α [46]. Activated HIF-1α induces glycolysis upregulation in cancer cells, a phenomenon known as the Warburg effect [47]. Thus, by increasing the conversion of pyruvate to lactate, the Warburg effect reduces ROS production by the mitochondrial OXPHOS. Activated AKT pathway contributed to glucose transport through GLUT1 plasmatic membrane translocation and activation of HIF-1α. ACF, by inhibiting HIF-1α, impedes PDK1 transcription, resulting in enhanced ROS production. In this metabolic scenario, ACF blocks the PI3K/PDPK1 pathway, resulting in impaired phosphorylation of AKT. Consistently with our results (Figure 2A), inhibition of AKT phosphorylation by ACF would also result in reduced expression of HIF-1α [31] under normoxic conditions. Red arrows indicate favored pathways in the presence of ACF. (B) Increased ROS levels induces ER stress, leading to the UPR [48]. Although ACF induces the phosphorylation of eIF2α, this is not traduced in elevated expression of ATF4. Since protein stability of ATF4 is dependent of an operative PDPK1/RSK2 pathway [29], ACF induces the destabilization of ATF4 and, therefore, the inactivation of ATF4-adaptative pathways.

References

    1. Majmundar A.J., Wong W.J., Simon M.C. Hypoxia-inducible factors and the response to hypoxic stress. Mol. Cell. 2010;40:294–309. doi: 10.1016/j.molcel.2010.09.022. - DOI - PMC - PubMed
    1. Jun J.C., Rathore A., Younas H., Gilkes D., Polotsky V.Y. Hypoxia-Inducible Factors and Cancer. Curr. Sleep Med. Rep. 2017;3:1–10. doi: 10.1007/s40675-017-0062-7. - DOI - PMC - PubMed
    1. Wigerup C., Påhlman S., Bexell D. Therapeutic targeting of hypoxia and hypoxia-inducible factors in cancer. Pharmacol. Ther. 2016;164:152–169. doi: 10.1016/j.pharmthera.2016.04.009. - DOI - PubMed
    1. Powis G., Kirkpatrick L. Hypoxia inducible factor-1alpha as a cancer drug target. Mol. Cancer Ther. 2004;3:647–654. - PubMed
    1. Strowitzki M.J., Cummins E.P., Taylor C.T. Protein Hydroxylation by Hypoxia-Inducible Factor (HIF) Hydroxylases: Unique or Ubiquitous? Cells. 2019;8:384. doi: 10.3390/cells8050384. - DOI - PMC - PubMed

LinkOut - more resources