

Development and Validation of an Automated Radiomic CT Signature for Detecting COVID-19
- PMID: 33396587
- PMCID: PMC7823620
- DOI: 10.3390/diagnostics11010041
Development and Validation of an Automated Radiomic CT Signature for Detecting COVID-19
Abstract
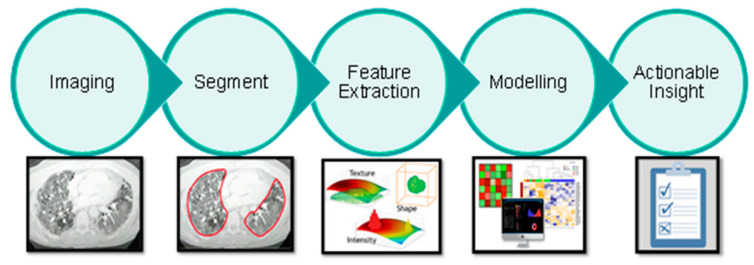
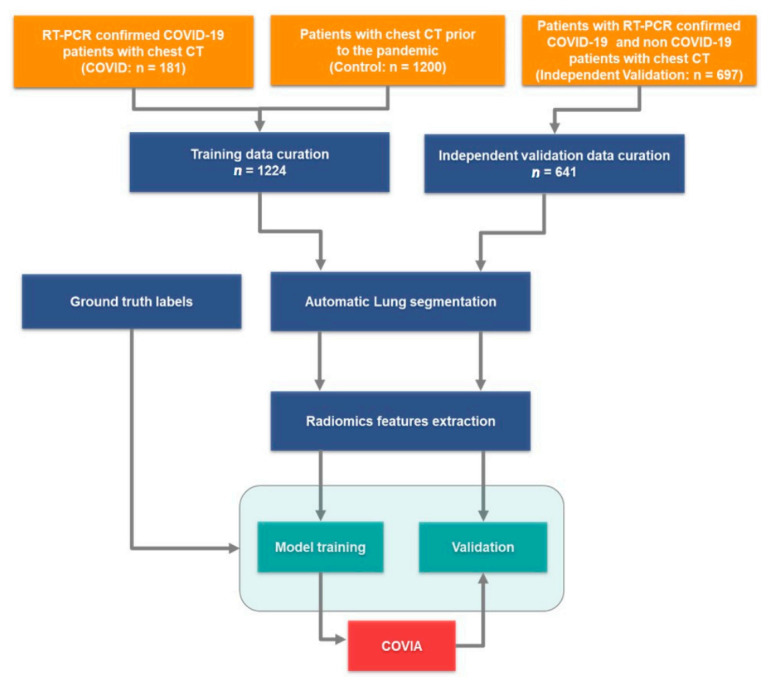
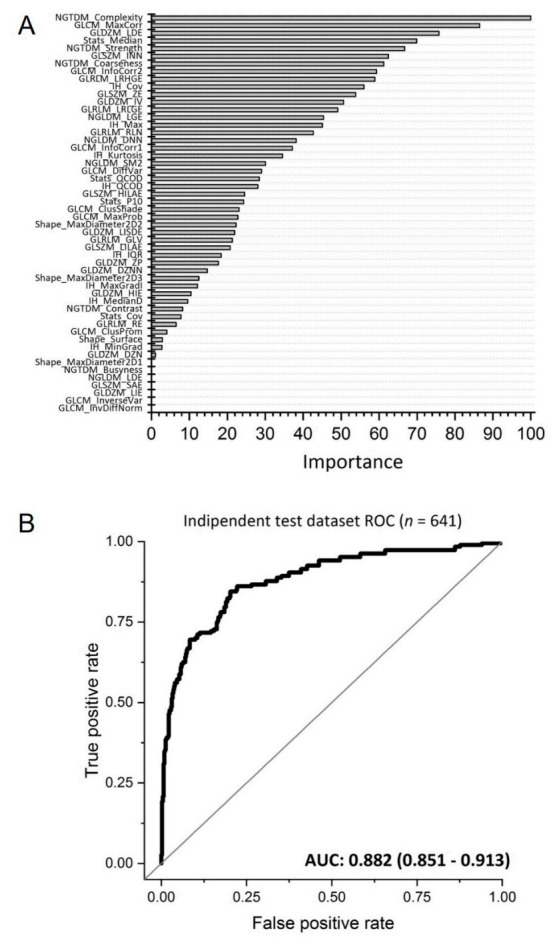
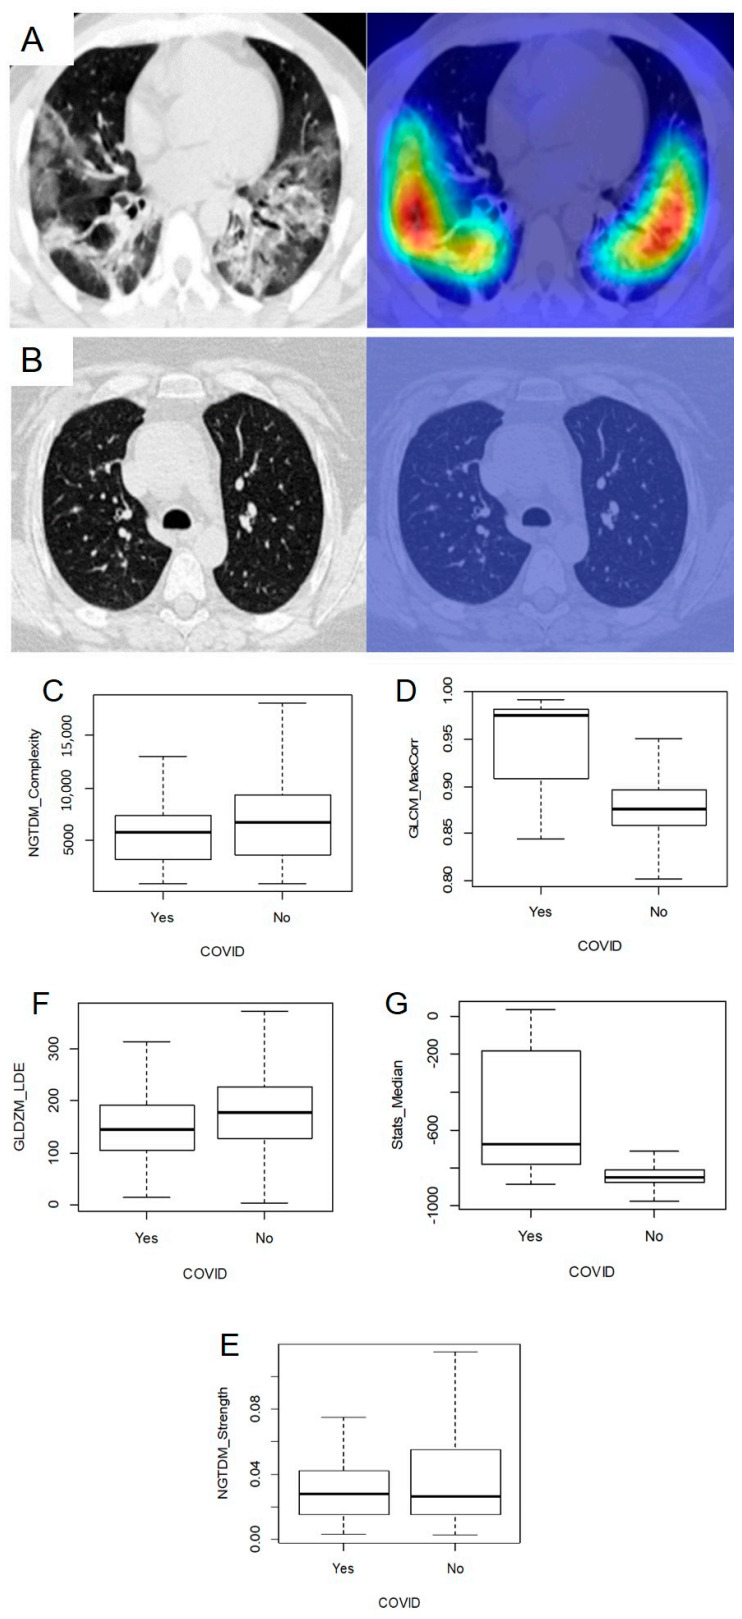
The coronavirus disease 2019 (COVID-19) outbreak has reached pandemic status. Drastic measures of social distancing are enforced in society and healthcare systems are being pushed to and beyond their limits. To help in the fight against this threat on human health, a fully automated AI framework was developed to extract radiomics features from volumetric chest computed tomography (CT) exams. The detection model was developed on a dataset of 1381 patients (181 COVID-19 patients plus 1200 non COVID control patients). A second, independent dataset of 197 RT-PCR confirmed COVID-19 patients and 500 control patients was used to assess the performance of the model. Diagnostic performance was assessed by the area under the receiver operating characteristic curve (AUC). The model had an AUC of 0.882 (95% CI: 0.851-0.913) in the independent test dataset (641 patients). The optimal decision threshold, considering the cost of false negatives twice as high as the cost of false positives, resulted in an accuracy of 85.18%, a sensitivity of 69.52%, a specificity of 91.63%, a negative predictive value (NPV) of 94.46% and a positive predictive value (PPV) of 59.44%. Benchmarked against RT-PCR confirmed cases of COVID-19, our AI framework can accurately differentiate COVID-19 from routine clinical conditions in a fully automated fashion. Thus, providing rapid accurate diagnosis in patients suspected of COVID-19 infection, facilitating the timely implementation of isolation procedures and early intervention.
Keywords: COVID-19; artificial intelligence; computed tomography; machine learning; radiomics.
Conflict of interest statement
The authors declare the following financial interests/personal relationships which may be considered as potential competing interests: A.V., F.Z., B.M., N.T. are salaried employees ofOncoradiomicsSA. P.L. (Philippe Lambin) reports, within and outside the submitted work, grants/sponsored research agreements from Varian medical, Oncoradiomics, ptTheragnostic/DNAmito, Health Innovation Ventures. He received an advisor/presenter fee and/or reimbursement of travel costs/external grant writing fee and/orin kindmanpower contribution fromOncoradiomics, BHV, Merck, Varian, Elekta, ptTheragnosticand Convert pharmaceuticals. P.L. (Philippe Lambin) has shares in the companyOncoradiomicsSA, Convert pharmaceuticals SA and The Medical Cloud Company SPRL and is co-inventor of two issued patents with royalties on radiomics (PCT/NL2014/050248, PCT/NL2014/050728) licensed toOncoradiomicsand one issue patent onmtDNA(PCT/EP2014/059089) licensed toptTheragnostic/DNAmito, three non-patented invention (softwares) licensed toptTheragnostic/DNAmito, Oncoradiomicsand Health Innovation Ventures and three non-issues, non licensedpatents on Deep Learning-Radiomics and LSRT (N2024482, N2024889, N2024889. R.T.H.L. has shares in the companyOncoradiomicsand is co-inventor of an issued patent with royalties on radiomics (PCT/NL2014/050728) licensed toOncoradiomics. S.W. and W.V. have shares in the companyOncoradiomics. The rest of the co-authors have no known competing financial interests or personal relationships to declare.
Figures


Similar articles
-
Machine learning-based CT radiomics model distinguishes COVID-19 from non-COVID-19 pneumonia.BMC Infect Dis. 2021 Sep 8;21(1):931. doi: 10.1186/s12879-021-06614-6. BMC Infect Dis. 2021. PMID: 34496794 Free PMC article.
-
Machine learning-based prognostic modeling using clinical data and quantitative radiomic features from chest CT images in COVID-19 patients.Comput Biol Med. 2021 May;132:104304. doi: 10.1016/j.compbiomed.2021.104304. Epub 2021 Mar 3. Comput Biol Med. 2021. PMID: 33691201 Free PMC article.
-
Using Artificial Intelligence to Detect COVID-19 and Community-acquired Pneumonia Based on Pulmonary CT: Evaluation of the Diagnostic Accuracy.Radiology. 2020 Aug;296(2):E65-E71. doi: 10.1148/radiol.2020200905. Epub 2020 Mar 19. Radiology. 2020. PMID: 32191588 Free PMC article.
-
Thoracic imaging tests for the diagnosis of COVID-19.Cochrane Database Syst Rev. 2020 Sep 30;9:CD013639. doi: 10.1002/14651858.CD013639.pub2. Cochrane Database Syst Rev. 2020. Update in: Cochrane Database Syst Rev. 2020 Nov 26;11:CD013639. doi: 10.1002/14651858.CD013639.pub3. PMID: 32997361 Updated.
-
Universal screening for SARS-CoV-2 infection: a rapid review.Cochrane Database Syst Rev. 2020 Sep 15;9(9):CD013718. doi: 10.1002/14651858.CD013718. Cochrane Database Syst Rev. 2020. PMID: 33502003 Free PMC article.
Cited by
-
Long Term Evaluation of Quantitative Cumulative Irradiation in Patients Suffering from ILDs.Diagnostics (Basel). 2024 Sep 26;14(19):2136. doi: 10.3390/diagnostics14192136. Diagnostics (Basel). 2024. PMID: 39410540 Free PMC article.
-
An original deep learning model using limited data for COVID-19 discrimination: A multicenter study.Med Phys. 2022 Jun;49(6):3874-3885. doi: 10.1002/mp.15549. Epub 2022 Apr 18. Med Phys. 2022. PMID: 35305027 Free PMC article.
-
Comparing Visual and Software-Based Quantitative Assessment Scores of Lungs' Parenchymal Involvement Quantification in COVID-19 Patients.Diagnostics (Basel). 2024 May 8;14(10):985. doi: 10.3390/diagnostics14100985. Diagnostics (Basel). 2024. PMID: 38786283 Free PMC article.
-
A Promising Approach: Artificial Intelligence Applied to Small Intestinal Bacterial Overgrowth (SIBO) Diagnosis Using Cluster Analysis.Diagnostics (Basel). 2021 Aug 10;11(8):1445. doi: 10.3390/diagnostics11081445. Diagnostics (Basel). 2021. PMID: 34441379 Free PMC article.
-
Developing medical imaging AI for emerging infectious diseases.Nat Commun. 2022 Nov 18;13(1):7060. doi: 10.1038/s41467-022-34234-4. Nat Commun. 2022. PMID: 36400764 Free PMC article.
References
-
- WHO Landing Page. [(accessed on 20 December 2020)]; Available online: https://www.who.int/
-
- Johns Hopkins University & Medicine Coronavirus Resource Center. [(accessed on 20 December 2020)]; Available online: https://coronavirus.jhu.edu/map.html.
-
- Yang S., Shi Y., Lu H., Xu J., Li F., Qian Z., Hua X., Ding X., Song F., Shen J., et al. Clinical and CT features of early-stage patients with COVID-19: A retrospective analysis of imported cases in Shanghai, China. Eur. Respir. J. 2020:2000407. doi: 10.1183/13993003.00407-2020. - DOI - PMC - PubMed
Grants and funding
LinkOut - more resources
Full Text Sources
Medical
