. 2020 Dec 30;23(1):46.
doi: 10.3390/e23010046.

Spatiotemporal Intermittency in Pulsatile Pipe Flow

Affiliations

Spatiotemporal Intermittency in Pulsatile Pipe Flow

Daniel Feldmann et al. Entropy (Basel). .

Abstract

Despite its importance in cardiovascular diseases and engineering applications, turbulence in pulsatile pipe flow remains little comprehended. Important advances have been made in the recent years in understanding the transition to turbulence in such flows, but the question remains of how turbulence behaves once triggered. In this paper, we explore the spatiotemporal intermittency of turbulence in pulsatile pipe flows at fixed Reynolds and Womersley numbers (Re=2400, Wo=8) and different pulsation amplitudes. Direct numerical simulations (DNS) were performed according to two strategies. First, we performed DNS starting from a statistically steady pipe flow. Second, we performed DNS starting from the laminar Sexl-Womersley flow and disturbed with the optimal helical perturbation according to a non-modal stability analysis. Our results show that the optimal perturbation is unable to sustain turbulence after the first pulsation period. Spatiotemporally intermittent turbulence only survives for multiple periods if puffs are triggered. We find that puffs in pulsatile pipe flow do not only take advantage of the self-sustaining lift-up mechanism, but also of the intermittent stability of the mean velocity profile.

Keywords: helical instability; puff dynamics; turbulence intermittency; unsteady shear flow.


Conflict of interest statement

The authors declare no conflict of interest.

Figures

Figure 1
Figure 1
Instantaneous representation of localised turbulent structures in a statistically steady pipe flow (Re=2400, A=0.0). Grey surfaces represent low-speed streaks (uz=0.4ub) and blue/red surfaces represent positive/negative axial vorticity (ωz=±6ubD). (a) Puff splitting. (b) Single puff. (c) Weak slug. The exact location and time for each snapshot are indicated in Figure 2a. The direction of the mean bulk flow (us) is always from left to right.
Figure 2
Figure 2
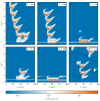
Spatiotemporal representation of the turbulence activity in the computational pipe domain based on the cross-sectional average of the streamwise vorticity (ωz) plotted on a logarithmic scale and in a co-moving reference frame. Steady (A=0, a) and pulsatile (bf) pipe flow at Re=2400, Wo=8, and different amplitudes A. Initial conditions for all A0 were either taken from the steady case at time tT=0.25 (bd,f) or composed of a localised helical perturbation on top of the laminar Sexl–Womersley velocity profile (e).
Figure 3
Figure 3
Sexl–Womersley (SW) flow and its optimal perturbation for (Re=2400, Wo=8, A=1.0). (a) Time-dependent velocity profile (uSW) for 20 equispaced points within one pulsation period (T). Circles denote the maximum and minimum peak flow (PF), whereas upward- and downward-facing triangles denote phases of acceleration (AC) and deceleration (DC), respectively. (b) Optimal helical perturbation during DC (tT=0.2) according to our transient growth analysis based on the linearised Navier–Stokes equations. To be used as initial condition in our direct numerical simulation (DNS) (Section 3.3), the helix is scaled to an amplitude of 4 × 10⁻² us. (c) Evolution of the optimal perturbation under the constraints of the linearised Navier–Stokes equations at the later time of maximal energy amplification. Note that, in the framework of transient growth analysis, the absolute amplitude of the initial helix is not important; only the relative growth rate is of interest. The dashed lines correspond to the Stoke layer thickness (δ).
Figure 4
Figure 4
Geometric representation of the perturbation force (Fp) in terms of iso-surfaces (black) of the localisation function for fp=0.5. (a) Axisymmetric contraction. (b) Localised bump. (c) Tilted bump. See Table 1 for details. The direction of the mean bulk flow (us) is always from left to right.
Figure 5
Figure 5
Turbulent fraction (Ft) in the computational pipe domain based on the axial vorticity data shown in Figure 2 and Figure 7. The threshold to distinguish turbulent from laminar regions is set to ωz2r,θ=4×10². (a) Time series of the turbulent fraction for several amplitudes A (line styles) and different numerical set-ups (symbols and colours from those in (b)). (b) Time-averaged turbulent fraction Ftt>2 for four different set-ups: The statistically steady pipe flow (SSPF) serves as reference data and as initial condition (IC) for the first set-up. The IC for the second set-up are composed out of the analytical Sexl–Womersley (SW) velocity profile superimposed with an optimal perturbation (OP). The third set-up is initialised with an unperturbed SW flow and then permanently perturbed using a localised body force (see Section 3.6).
Figure 6
Figure 6
Instantaneous representation of localised turbulent structures in a pulsatile pipe flow (Re=2400, Wo=8, A=0.5). Grey surfaces represent low-speed streaks (uz=0.4us) and blue/red surfaces represent positive/negative axial vorticity (ωz=±8usD). (a) Death of downstream puff. (b) Splitting event. (c) Growing puff. (d) Isolated puff. The exact location and time for each snapshot are as indicated in Figure 2d. The direction of the mean bulk flow (us) is always from left to right.
Figure 7
Figure 7
Spatiotemporal representation of the turbulence activity in the pipe domain based on the cross-sectional average of the streamwise vorticity (ωz) plotted on a logarithmic scale and in a co-moving reference frame (z*). For pulsatile pipe flow at (Re=2400, Wo=8). (ae) For different pulsation amplitudes A, always using the SWOP initial condition. Note that the optimal time of perturbation slightly changes with A. The horizontal straight lines mark regions for which three-dimensional representations of the localised flow structures are shown in Figure 8. (f) For a permanent body force and the unperturbed SW velocity profile as initial condition. The curved black line represents the fixed location of the highly localised body force viewed from the co-moving reference frame. The direction of the mean bulk flow (us) is always from left to right.
Figure 8
Figure 8
Instantaneous representation of localised turbulent structures in a pulsatile pipe flow DNS at Re=2400, Wo=8, and two different amplitudes. (ad) Growth and decay of an initial helix at A=1.0. (eh) Development of a puff at A=0.5. Both DNS were initialised at tT=0.2 using the SWOP initial condition. Grey surfaces represent low-speed streaks (uz=0.4us) and blue/red surfaces represent positive/negative axial vorticity (ωz=±8usD). The exact location for each snapshot is as indicated in Figure 2e and Figure 7c, respectively. (a) Decay. (b) Breakdown into turbulence. (c) Amplification of helix. (d) Localised optimal helix perturbation. (e,f) Birth of a downstream puff. (g) Amplification of helix. (h) Localised optimal helix perturbation. Note that the initial perturbation is two orders of magnitude smaller. The direction of the mean bulk flow (us) is always from left to right.
Figure 9
Figure 9
Instantaneous streamwise velocity profiles (uz) at five axial locations along the pipe for an IC SWOP simulation at Re=2400, Wo=8, and A=0.5. To not interfere with one another, they are scaled in arbitrary physical units, since, in this representation, only the development in time and deviation from the SW profile are of interest. Thus, the velocity is scaled so its all-time maximum uzr,θ=0,z is equal to 10D. Each profile is compared with the corresponding instantaneous SW profile (grey lines, also scaled) and its inflection point (grey circles) if they fulfil the Fjortoft criterion. The shaded grey area shows the instantaneous cross-sectional average of the streamwise vorticity (ωz2r,θ) scaled so its all-time maximum is equal to 0.5D.
Figure 10
Figure 10
Production (a) and dissipation (b) of turbulent kinetic energy compared for different phases of the pulsation period for A=0.6 using the SWOP initial conditions. Averages are taken over space- and phase-logged time instants (α=θ,z,ϕ) over four periods of puff dynamics, excluding the initial period without puffs. Circles denote the existence and wall-normal location of the inflection points of the corresponding mean profile 2uzϕ,θ,z/2r=0 that satisfy the Fjortoft criterion. The vertical dashed line denotes the Stokes layer.
Figure 11
Figure 11
Production (a) and dissipation (b) of turbulent kinetic energy compared for different phases of the initial pulsation period for A=1 using the SWOP initial conditions.
Figure 12
Figure 12
Spatiotemporal representation of the turbulence activity in the pipe domain based on the cross-sectional average of the streamwise vorticity (ωz) plotted on a logarithmic scale and in a stationary reference frame. Pulsatile pipe flow at Re=2400, Wo=8, and different amplitudes A. Initial conditions are based on the Sexl–Womersley velocity profile, and there is a permanent body force. (ac) Local bump. (d) Tilted bump.
Figure 13
Figure 13
Instantaneous representation of localised turbulent structures in a pulsatile pipe flow DNS at (Re=2400, Wo=8, A=1.4). The DNS was initialised at tT=0.25 using the corresponding SW profile and by introducing a local bump like body force, as described by Equation (3) and Table 1. Grey surfaces represent low-speed streaks (uz=0.2 us) and blue/red surfaces represent positive/negative axial vorticity (ωz=±2usD for all panels except (d) and (h). There, it is ±0.8usD. (ad) Local bump. (eh) Tilted bump. The exact instants in time are given in Figure 12c,d. The direction of the mean bulk flow (us) is always from left to right.

References

    1. Reynolds O. An experimental investigation of the circumstances which determine whether the motion of water shall be direct or sinuous, and of the law of resistance in parallel channels. Proc. R. Soc. Lond. 1883;35:84–99.
    1. Rotta J.C. Experimenteller Beitrag zur Entstehung turbulenter Strömung im Rohr. Ing. Arch. 1956;24:258–281. doi: 10.1007/BF00536526. - DOI
    1. Wygnanski I.J., Champagne F.H. On transition in a pipe. Part 1. The origin of puffs and slugs and the flow in a turbulent slug. J. Fluid Mech. 1973;59:281–335. doi: 10.1017/S0022112073001576. - DOI
    1. Wygnanski I., Sokolov M., Friedman D. On transition in a pipe. Part 2. The equilibrium puff. J. Fluid Mech. 1975;69:283–304. doi: 10.1017/S0022112075001449. - DOI
    1. Avila K., Moxey D., De Lozar A., Avila M., Barkley D., Hof B. The onset of turbulence in pipe flow. Science. 2011;333:192–196. doi: 10.1126/science.1203223. - DOI - PubMed

LinkOut - more resources