Alternative adjustment for seasonality and long-term time-trend in time-series analysis for long-term environmental exposures and disease counts
- PMID: 33397295
- PMCID: PMC7780665
- DOI: 10.1186/s12874-020-01199-1
Alternative adjustment for seasonality and long-term time-trend in time-series analysis for long-term environmental exposures and disease counts
Abstract
Background: Time-series analysis with case-only data is a prominent method for the effect of environmental determinants on disease events in environmental epidemiology. In this analysis, adjustment for seasonality and long-term time-trend is crucial to obtain valid findings. When applying this analysis for long-term exposure (e.g., months, years) of which effects are usually studied via survival analysis with individual-level longitudinal data, unlike its application for short-term exposure (e.g., days, weeks), a standard adjustment method for seasonality and long-term time-trend can extremely inflate standard error of coefficient estimates of the effects. Given that individual-level longitudinal data are difficult to construct and often available to limited populations, if this inflation of standard error can be solved, rich case-only data over regions and countries would be very useful to test a variety of research hypotheses considering unique local contexts.
Methods: We discuss adjustment methods for seasonality and time-trend used in time-series analysis in environmental epidemiology and explain why standard errors can be inflated. We suggest alternative methods to solve this problem. We conduct simulation analyses based on real data for Seoul, South Korea, 2002-2013, and time-series analysis using real data for seven major South Korean cities, 2006-2013 to identify whether the association between long-term exposure and health outcomes can be estimated via time-series analysis with alternative adjustment methods.
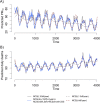
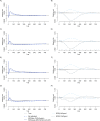
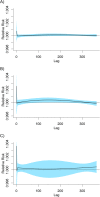
Results: Simulation analyses and real-data analysis confirmed that frequently used adjustment methods such as a spline function of a variable representing time extremely inflate standard errors of estimates for associations between long-term exposure and health outcomes. Instead, alternative methods such as a combination of functions of variables representing time can make sufficient adjustment with efficiency.
Conclusions: Our findings suggest that time-series analysis with case-only data can be applied for estimating long-term exposure effects. Rich case-only data such as death certificates and hospitalization records combined with repeated measurements of environmental determinants across countries would have high potentials for investigating the effects of long-term exposure on health outcomes allowing for unique contexts of local populations.
Keywords: Case-only data; Environmental exposure; Long-term exposure; Seasonality; Time-series analysis; Time-trend.
Conflict of interest statement
The authors declare there is no any competing interests.
Figures


References
-
- Sera F, Armstrong B, Tobias A, Vicedo-Cabrera AM, Åström C, Bell ML, Chen B-Y, de Sousa Zanotti Stagliorio Coelho M, Matus Correa P, Cruz JC. How urban characteristics affect vulnerability to heat and cold: a multi-country analysis. Int J Epidemiol. 2019;48(4):1101–1112. doi: 10.1093/ije/dyz008. - DOI - PubMed
Publication types
MeSH terms
Substances
Grants and funding
LinkOut - more resources
Full Text Sources
Other Literature Sources
Medical

