. 2021 Jan 4;22(1):10.
doi: 10.1186/s13059-020-02238-2.

scMC learns biological variation through the alignment of multiple single-cell genomics datasets

Affiliations

scMC learns biological variation through the alignment of multiple single-cell genomics datasets

Lihua Zhang et al. Genome Biol. .

Abstract

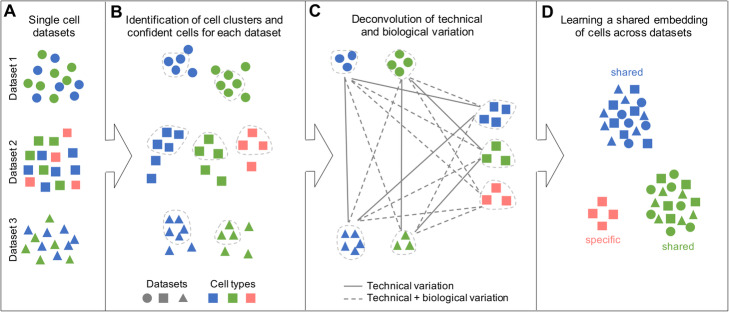
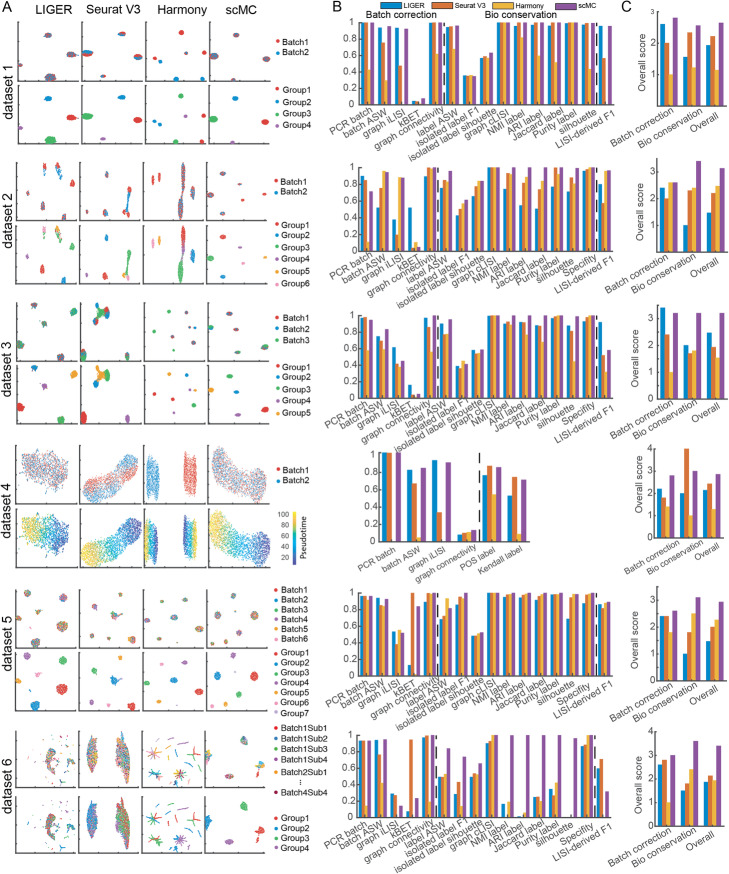
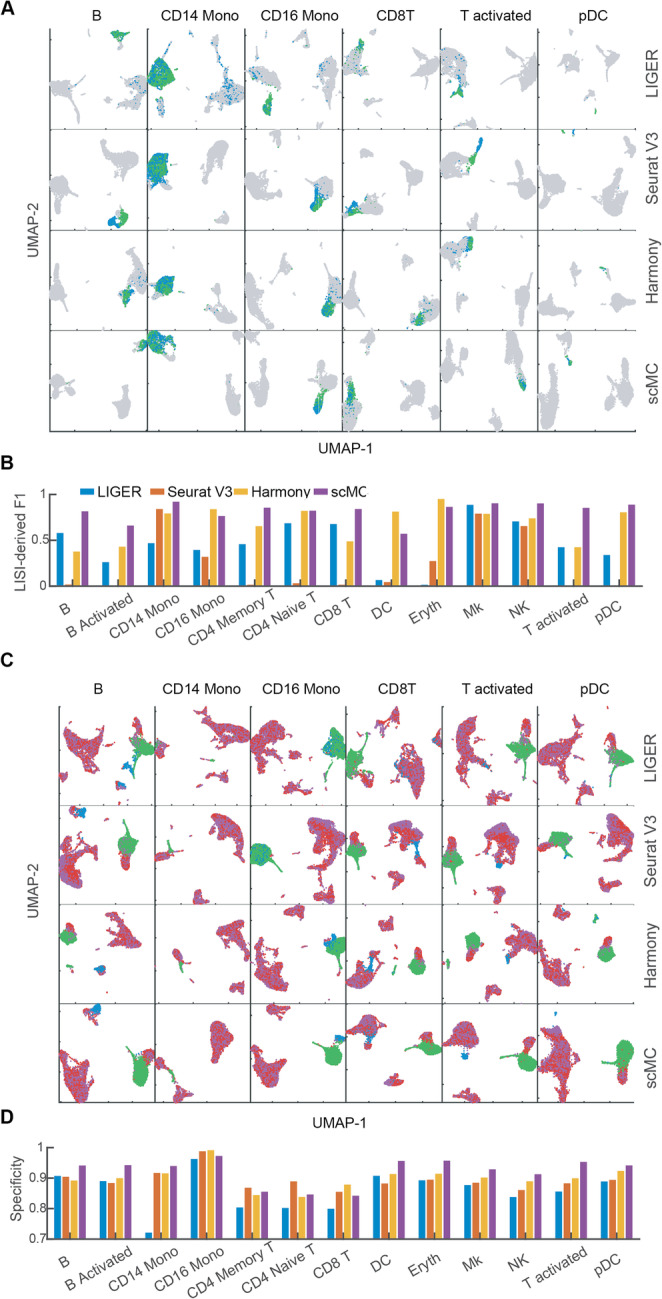
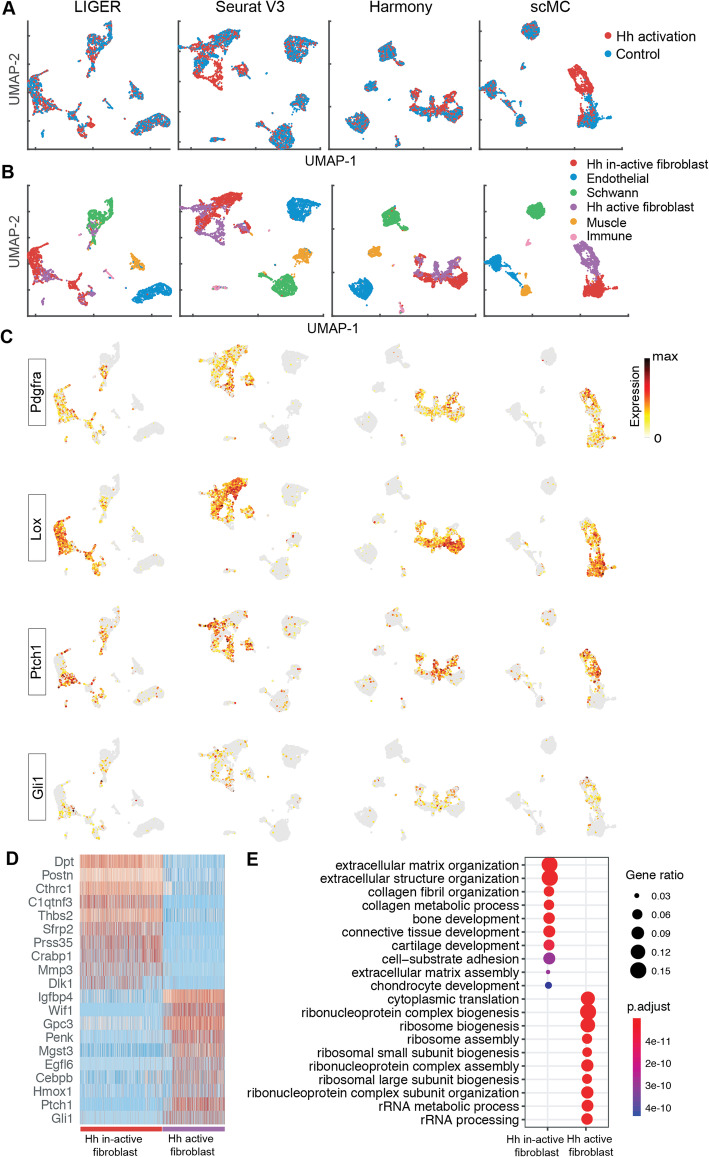
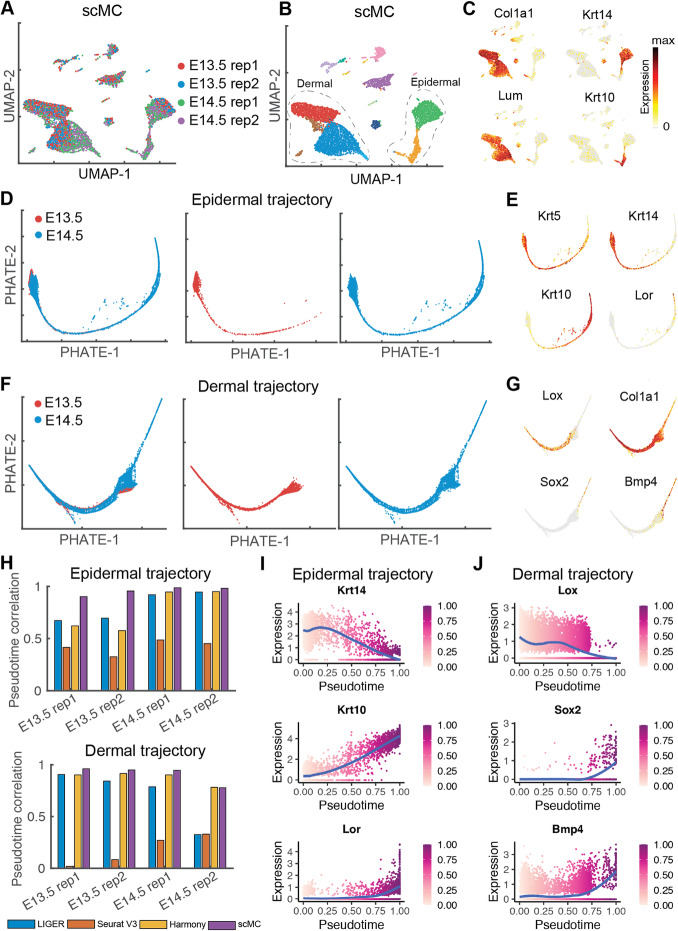
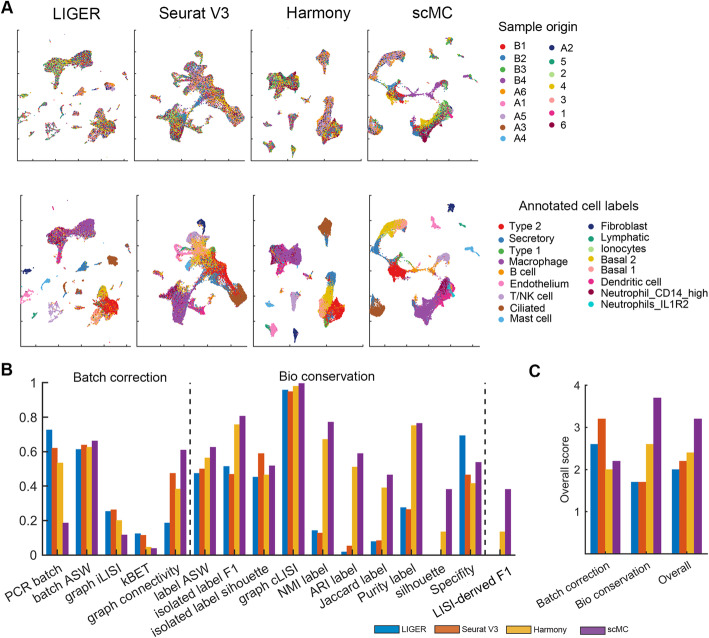
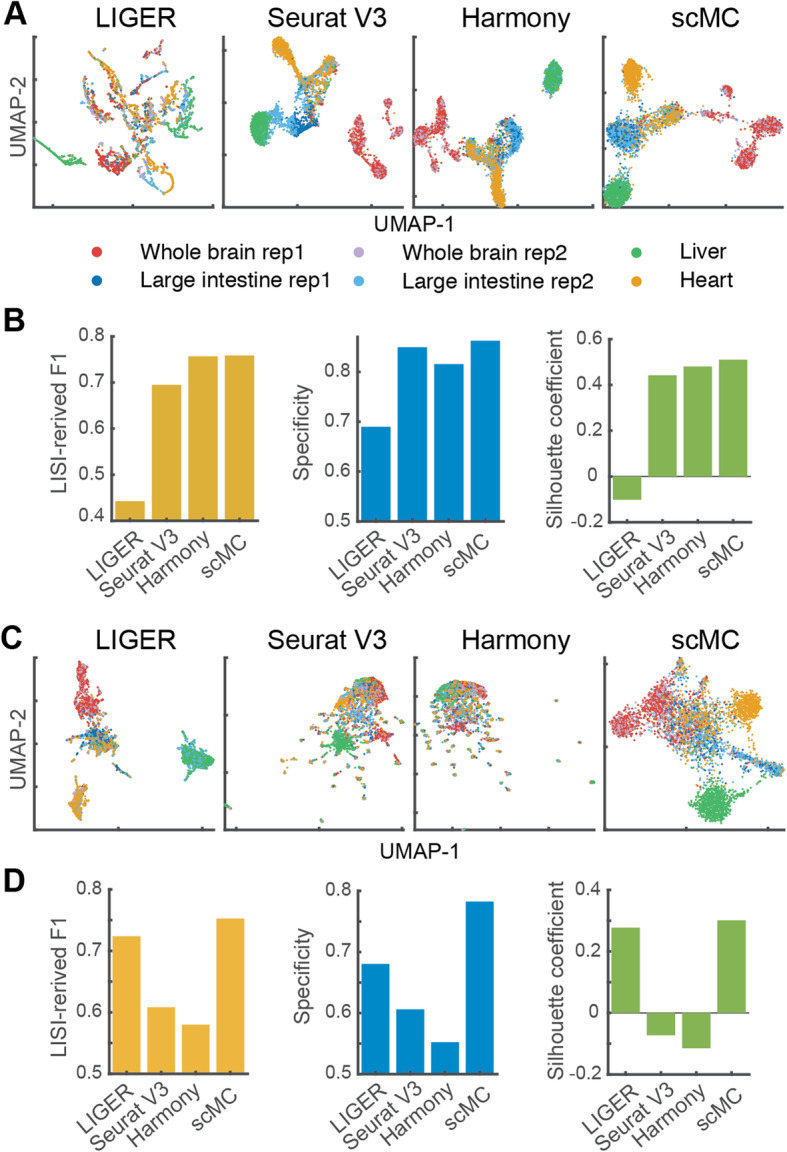
Distinguishing biological from technical variation is crucial when integrating and comparing single-cell genomics datasets across different experiments. Existing methods lack the capability in explicitly distinguishing these two variations, often leading to the removal of both variations. Here, we present an integration method scMC to remove the technical variation while preserving the intrinsic biological variation. scMC learns biological variation via variance analysis to subtract technical variation inferred in an unsupervised manner. Application of scMC to both simulated and real datasets from single-cell RNA-seq and ATAC-seq experiments demonstrates its capability of detecting context-shared and context-specific biological signals via accurate alignment.

Keywords: Single-cell genomics data, Data integration, Biological variation, Technical variation, Batch effect removal.


Conflict of interest statement

The authors declare no competing interests.

Figures

Fig. 1
Fig. 1
Overview of scMC. a scMC takes multiple single-cell genomics datasets as input. Datasets and cell types are represented by different shapes and colors, respectively. b scMC identifies putative cell clusters for each dataset using a Leiden algorithm-based consensus approach and defines a set of confident cells in each cell cluster, as indicated by the cells inside the dashed lines. c scMC deconvolutes technical variation by identifying all pairs of shared cell clusters across any two datasets based on their similarity. The differences between any other pairs of cell clusters are attributed to both technical and biological variation, as indicated by the dashed lines. d scMC learns a shared embedding of cells by subtracting the inferred technical variation using variance analysis. In this shared embedding space, cells are grouped by cell types rather than dataset batches, allowing detection of dataset-shared and dataset-specific biological signals
Fig. 2
Fig. 2
Comparisons of scMC against other methods on six simulation scenarios. a UMAP visualization of the corrected data from LIGER, Seurat V3, Harmony, and scMC. For each dataset, cells are colored by batch labels (top row) and gold standard cell labels or pseudotime (bottom row). b Evaluation of integration methods using 16 metrics in two categories for measuring batch effect removal (i.e., Batch correction) and biological variation conservation (i.e., Bio conservation). LISI-derived F1 score is a summarized metric assessing both batch mixing and cell type separation. The consistency between the inferred pseudotime from the corrected data and the gold standard pseudotime is computed using two metrics POS and Kendall rank correlation coefficient. c Comparison of the overall scores among different methods calculated based on batch effect removal metrics, biological variation conservation metrics, and both batch effect removal and biological variation conservation metrics
Fig. 3
Fig. 3
scMC aligns and preserves condition-specific cell subpopulations on perturbed PBMC datasets. a UMAP of the corrected data from LIGER, Seurat V3, Harmony, and scMC across control and stimulated conditions in the perturbed PBMC datasets. Each row represents one method, and each column represents one perturbed dataset in which only one cell subpopulation was retained in the control condition (indicated on the top). See Additional file 2: Figure S3A for other 7 perturbed datasets. Green: cells retained in the control condition; blue: cells from the corresponding same cell subpopulation in the stimulated condition; gray: other cells in the stimulated condition. b LISI-derived F1 scores of LIGER, Seurat V3, Harmony, and scMC on all 13 perturbed datasets. c UMAP of the corrected data from LIGER, Seurat V3, Harmony, and scMC across control and stimulated conditions. Each column represents one perturbed dataset, where the cell subpopulation removed in the control condition is labeled on the top, and CD14 Mono and DC cell subpopulations were also removed in the stimulated condition for all cases. See Additional file 2: Figure S3B for other 7 perturbed datasets. Green: CD14 Mono and DC cells from the control condition. Red: other cells from the control condition. Blue: cells of the cell subpopulation removed from the control condition in the stimulated condition. Purple: other cells in the stimulated condition. d Specificity scores of LIGER, Seurat V3, Harmony, and scMC on all 13 perturbed datasets
Fig. 4
Fig. 4
scMC reveals specific fibroblast subpopulations in control and Hedgehog activation during mouse skin wound healing. a, b UMAP of the corrected data from LIGER, Seurat V3, Harmony, and scMC across two conditions. a Cells are colored by experimental conditions. b Cells are colored based on the annotated cell labels determined based on the cell clusters identified by scMC by examining the expression patterns of known markers (Additional file 2: Figure S5). c Overlay the expression levels of fibroblasts pan-markers (Pdgfra and Lox) and Hh-active fibroblast markers (Ptch1 and Gil1) onto the UMAP space of LIGER, Seurat V3, Harmony, and scMC, respectively. Dark red and gray colors represent the high and zero expression, respectively. d Heatmap showing the expression patterns of the top 10 marker genes enriched in Hh-inactive and Hh-active fibroblast subpopulations. e The top 10 enriched GO biological processes of the marker genes associated with the Hh-inactive and Hh-active fibroblast subpopulations
Fig. 5
Fig. 5
scMC reveals integrated epidermal and dermal trajectories by simultaneous integration across replicates and time points during skin embryonic development. a, b UMAP of the corrected data from scMC on the time-course scRNA-seq datasets from E13.5 to E14.5. a Cells are colored by the replicates and time points. b Cells are colored by the identified cell subpopulations from the corrected data. Cells inside the dashed line were identified as dermal and epidermal cells based on their known markers. c Overlay the expression levels of markers of dermal (Col1a1 and Lum) and epidermal cells (Krt14 and Krt10) onto the UMAP space. Dark red and gray colors represent the high and zero expression, respectively. d PHATE visualizations for the epidermal cells from both E13.5 and E14.5, only E13.5, and only E14.5, respectively. e Overlay the expression levels of markers of epidermal cells (Krt5, Krt14, Krt10, and Lor) onto the PHATE space. f PHATE visualizations for the dermal cells from both E13.5 and E14.5, only E13.5, and only E14.5, respectively. g Overlay the expression levels of markers of dermal cells (Lox and Col1a1) and DC cells (Sox2 and Bmp4) onto the PHATE space. h Comparison of the recovered trajectories by computing Pearson correlation coefficients between the pseudotime values of cells from each replicate sample before and after integration. i, j Pseudotemporal dynamics of un-differentiation and differentiation marker genes reconstructed from the integrated trajectories. Cells are colored based on the pseudotime values. Blue lines represent the locally weighted smoothing expression. Color bar represents the scaled pseudotime values
Fig. 6
Fig. 6
scMC is able to integrate a complex mouse lung scRNA-seq dataset across 16 batches. a UMAP of the corrected data from LIGER, Seurat V3, Harmony, and scMC on a mouse lung scRNA-seq dataset across 16 batches. Cells are colored by known sample origins (top panel) and annotated cell labels (bottom panel), respectively. b Evaluation of integration methods using 16 metrics, grouped into two categories: batch effect removal (i.e., Batch correction) and biological variation conservation (i.e., Bio conservation). LISI-derived F1 score is a summarized metric assessing both batch mixing and cell type separation. c Comparison of over scores among different methods
Fig. 7
Fig. 7
scMC performs well in integrating scATAC-seq datasets. a UMAP of the corrected data from LIGER, Seurat V3, Harmony, and scMC on an scATAC-seq dataset with the feature matrix transformed by ChromVAR. Cells are colored by known tissue origins. b Quantitative evaluation of removing batch effects, preserving condition-specific tissues, and separating different tissues on the aligned UMAP space from four methods using LISI-derived F1, specificity, and silhouette metrics. The feature matrix was constructed using ChromVAR. c, d The four integration methods applied to the feature matrix transformed by Gene Scoring

Similar articles

Cited by

References

    1. Yuan GC, Cai L, Elowitz M, Enver T, Fan G, Guo G, Irizarry R, Kharchenko P, Kim J, Orkin S, et al. Challenges and emerging directions in single-cell analysis. Genome Biol. 2017;18:84. doi: 10.1186/s13059-017-1218-y. - DOI - PMC - PubMed
    1. Luecken MD, Theis FJ. Current best practices in single-cell RNA-seq analysis: a tutorial. Mol Syst Biol. 2019;15:e8746. doi: 10.15252/msb.20188746. - DOI - PMC - PubMed
    1. Stuart T, Satija R. Integrative single-cell analysis. Nat Rev Genet. 2019;20:257–272. doi: 10.1038/s41576-019-0093-7. - DOI - PubMed
    1. Lahnemann D, Koster J, Szczurek E, McCarthy DJ, Hicks SC, Robinson MD, Vallejos CA, Campbell KR, Beerenwinkel N, Mahfouz A, et al. Eleven grand challenges in single-cell data science. Genome Biol. 2020;21:31. doi: 10.1186/s13059-020-1926-6. - DOI - PMC - PubMed
    1. Kiselev VY, Yiu A, Hemberg M. scmap: projection of single-cell RNA-seq data across data sets. Nat Methods. 2018;15:359–362. doi: 10.1038/nmeth.4644. - DOI - PubMed

Publication types