

Identification of differentially expressed genes, signaling pathways and immune infiltration in rheumatoid arthritis by integrated bioinformatics analysis
- PMID: 33397492
- PMCID: PMC7784358
- DOI: 10.1186/s41065-020-00169-3
Identification of differentially expressed genes, signaling pathways and immune infiltration in rheumatoid arthritis by integrated bioinformatics analysis
Abstract
Background: The disability rate associated with rheumatoid arthritis (RA) ranks high among inflammatory joint diseases. However, the cause and potential molecular events are as yet not clear. Here, we aimed to identify differentially expressed genes (DEGs), pathways and immune infiltration involved in RA utilizing integrated bioinformatics analysis and investigating potential molecular mechanisms.
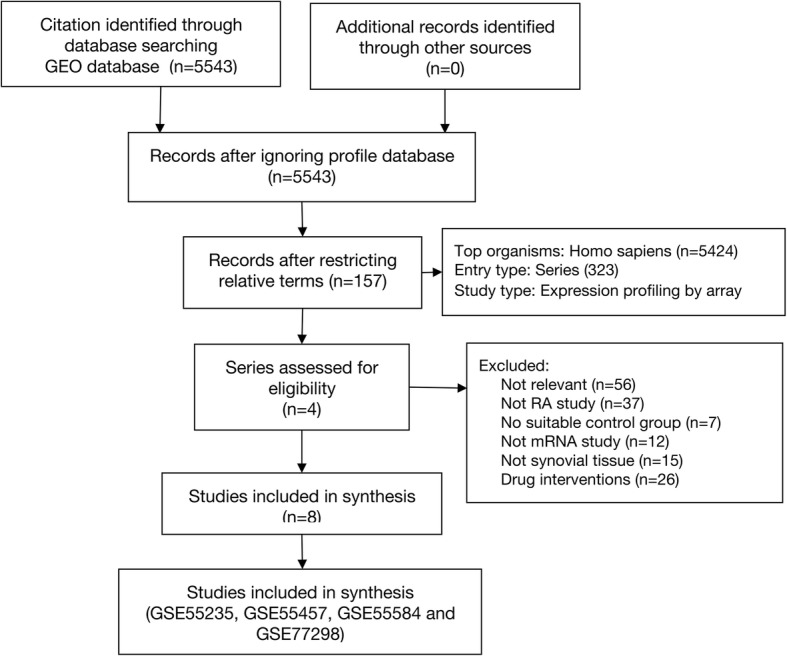
Materials and methods: The expression profiles of GSE55235, GSE55457, GSE55584 and GSE77298 were downloaded from the Gene Expression Omnibus database, which contained 76 synovial membrane samples, including 49 RA samples and 27 normal controls. The microarray datasets were consolidated and DEGs were acquired and further analyzed by bioinformatics techniques. Gene ontology (GO) and Kyoto Encyclopedia of Genes and Genomes (KEGG) pathway enrichment analyses of DEGs were performed using R (version 3.6.1) software, respectively. The protein-protein interaction (PPI) network of DEGs were developed utilizing the STRING database. Finally, the CIBERSORT was used to evaluate the infiltration of immune cells in RA.
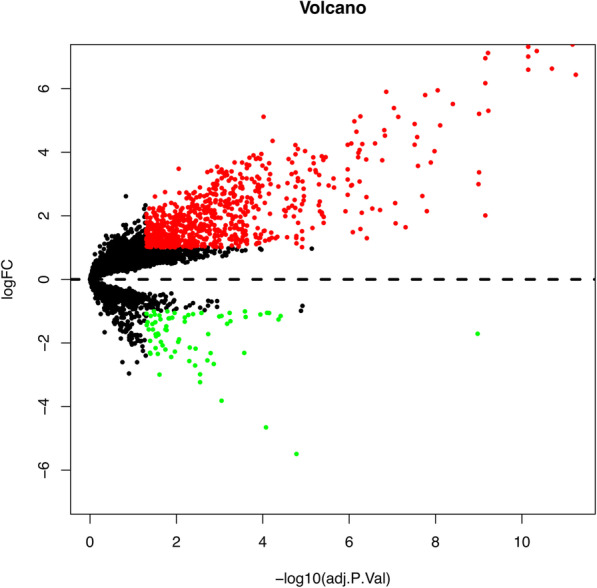
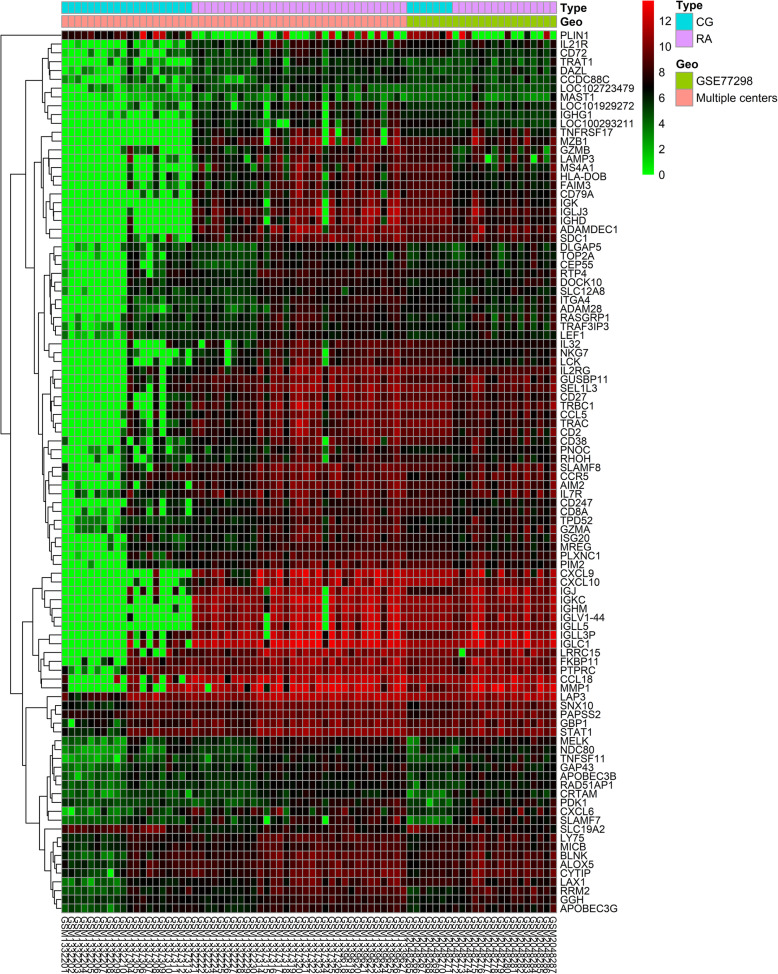
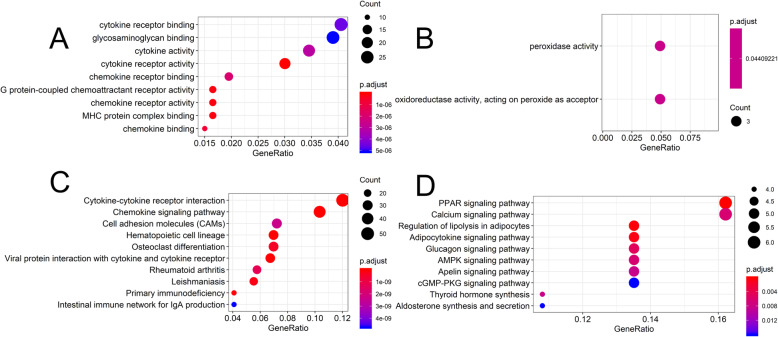
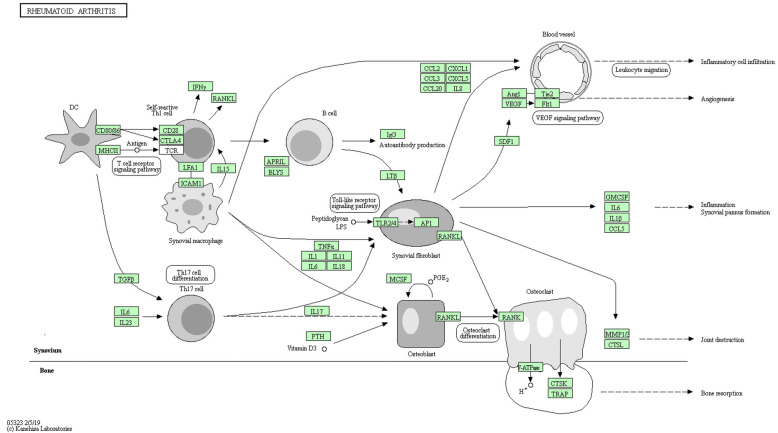
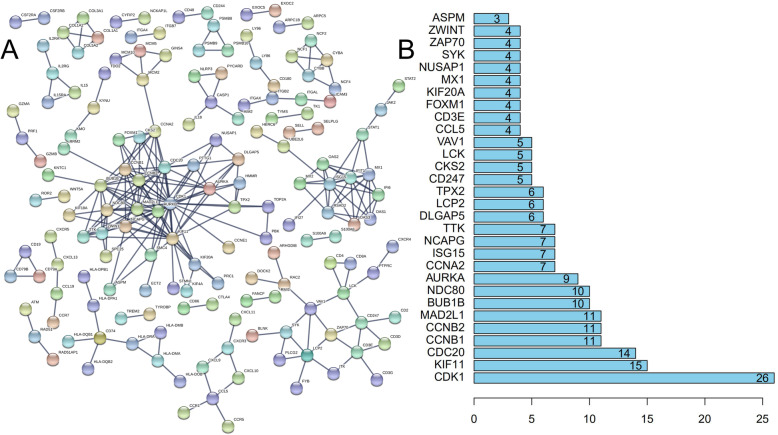
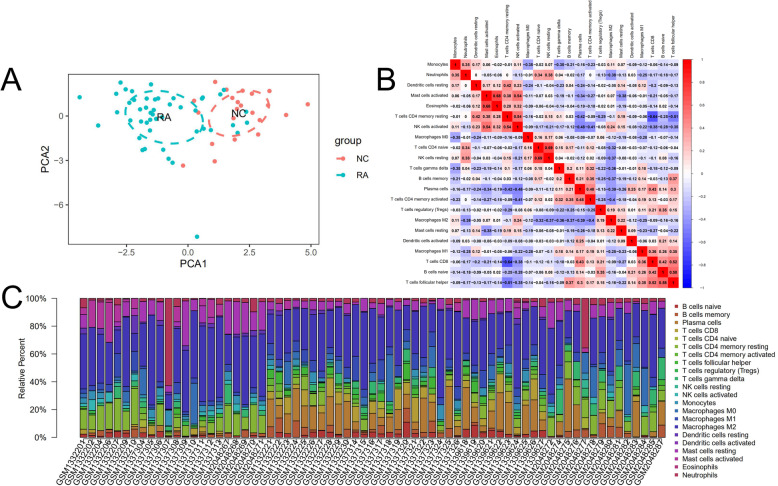
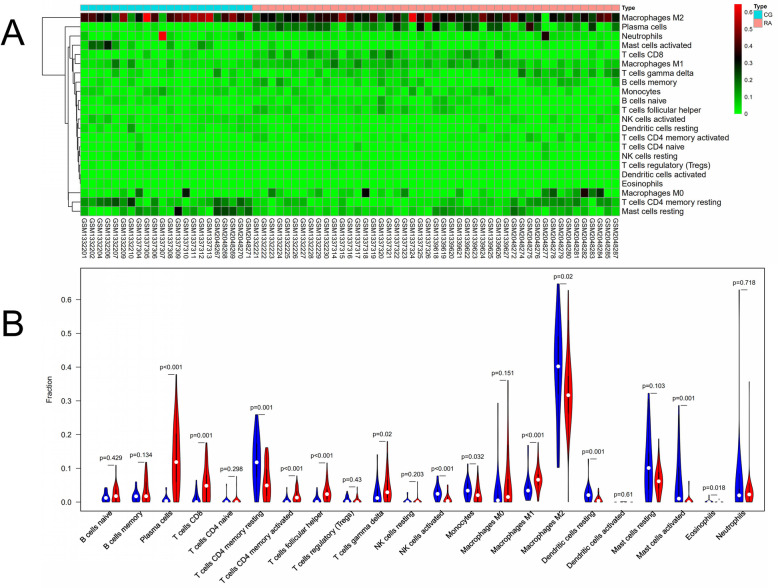
Results: A total of 828 DEGs were recognized, with 758 up-regulated and 70 down-regulated. GO and KEGG pathway analyses demonstrated that these DEGs focused primarily on cytokine receptor activity and relevant signaling pathways. The 30 most firmly related genes among DEGs were identified from the PPI network. The principal component analysis showed that there was a significant difference between the two tissues in infiltration immune.
Conclusion: This study shows that screening for DEGs, pathways and immune infiltration utilizing integrated bioinformatics analyses could aid in the comprehension of the molecular mechanisms involved in RA development. Besides, our study provides valuable data related to DEGs, pathways and immune infiltration of RA and may provide new insight into the understanding of molecular mechanisms.
Keywords: Bioinformatics analysis; Differentially expressed genes; Immune infiltration; Rheumatoid arthritis.
Conflict of interest statement
The authors declare that they have no competing interests.
Figures
Similar articles
-
Identification of differential key biomarkers in the synovial tissue between rheumatoid arthritis and osteoarthritis using bioinformatics analysis.Clin Rheumatol. 2021 Dec;40(12):5103-5110. doi: 10.1007/s10067-021-05825-1. Epub 2021 Jul 5. Clin Rheumatol. 2021. PMID: 34224029
-
Bioinformatics Analysis and Identification of Genes and Molecular Pathways Involved in Synovial Inflammation in Rheumatoid Arthritis.Med Sci Monit. 2019 Mar 27;25:2246-2256. doi: 10.12659/MSM.915451. Med Sci Monit. 2019. PMID: 30916045 Free PMC article.
-
Three hematologic/immune system-specific expressed genes are considered as the potential biomarkers for the diagnosis of early rheumatoid arthritis through bioinformatics analysis.J Transl Med. 2021 Jan 6;19(1):18. doi: 10.1186/s12967-020-02689-y. J Transl Med. 2021. PMID: 33407587 Free PMC article.
-
Effects of dietary curcumin on gene expression: An analysis of transcriptomic data in mice.Pathol Res Pract. 2024 Nov;263:155653. doi: 10.1016/j.prp.2024.155653. Epub 2024 Oct 11. Pathol Res Pract. 2024. PMID: 39426142 Review.
-
A Review of Connecting Bioinformatic Techniques to Rheumatoid Arthritis and its Associated Comorbidities.Curr Rheumatol Rev. 2025;21(1):25-36. doi: 10.2174/0115733971302188240515075547. Curr Rheumatol Rev. 2025. PMID: 38803169 Review.
Cited by
-
Identification of Diagnostic Signatures and Immune Cell Infiltration Characteristics in Rheumatoid Arthritis by Integrating Bioinformatic Analysis and Machine-Learning Strategies.Front Immunol. 2021 Oct 6;12:724934. doi: 10.3389/fimmu.2021.724934. eCollection 2021. Front Immunol. 2021. PMID: 34691030 Free PMC article.
-
Identification of cancer-associated fibroblast subtypes and prognostic model development in breast cancer: role of the RUNX1/SDC1 axis in promoting invasion and metastasis.Cell Biol Toxicol. 2025 Jan 3;41(1):21. doi: 10.1007/s10565-024-09950-w. Cell Biol Toxicol. 2025. PMID: 39753834 Free PMC article.
-
From molecular subgroups to molecular targeted therapy in rheumatoid arthritis: A bioinformatics approach.Heliyon. 2024 Aug 6;10(16):e35774. doi: 10.1016/j.heliyon.2024.e35774. eCollection 2024 Aug 30. Heliyon. 2024. PMID: 39220908 Free PMC article.
-
Comparison of inflammatory molecular mechanisms between osteoarthritis and rheumatoid arthritis via gene microarrays.Mol Biol Res Commun. 2024;13(4):211-222. doi: 10.22099/mbrc.2024.49924.1963. Mol Biol Res Commun. 2024. PMID: 39315289 Free PMC article.
-
Anti-CD20 Therapy Alters the Protein Signature in Experimental Murine AIH, but Not Exclusively towards Regeneration.Cells. 2021 Jun 11;10(6):1471. doi: 10.3390/cells10061471. Cells. 2021. PMID: 34208308 Free PMC article.
References
-
- Groves C, Chandramohan M, Chew NS, Aslam T, Helliwell PS. Clinical examination, ultrasound and mri imaging of the painful elbow in psoriatic arthritis and rheumatoid arthritis: which is better, ultrasound or mr, for imaging enthesitis? Rheumatol Ther. 2017;4(1):71–84. doi: 10.1007/s40744-017-0053-7. - DOI - PMC - PubMed
MeSH terms
Grants and funding
LinkOut - more resources
Full Text Sources
Other Literature Sources
Medical
