. 2021 Feb 17;41(7):1489-1504.
doi: 10.1523/JNEUROSCI.0674-20.2020. Epub 2021 Jan 4.

Photoreceptive Ganglion Cells Drive Circuits for Local Inhibition in the Mouse Retina

Affiliations

Photoreceptive Ganglion Cells Drive Circuits for Local Inhibition in the Mouse Retina

Joseph Pottackal et al. J Neurosci. .

Abstract

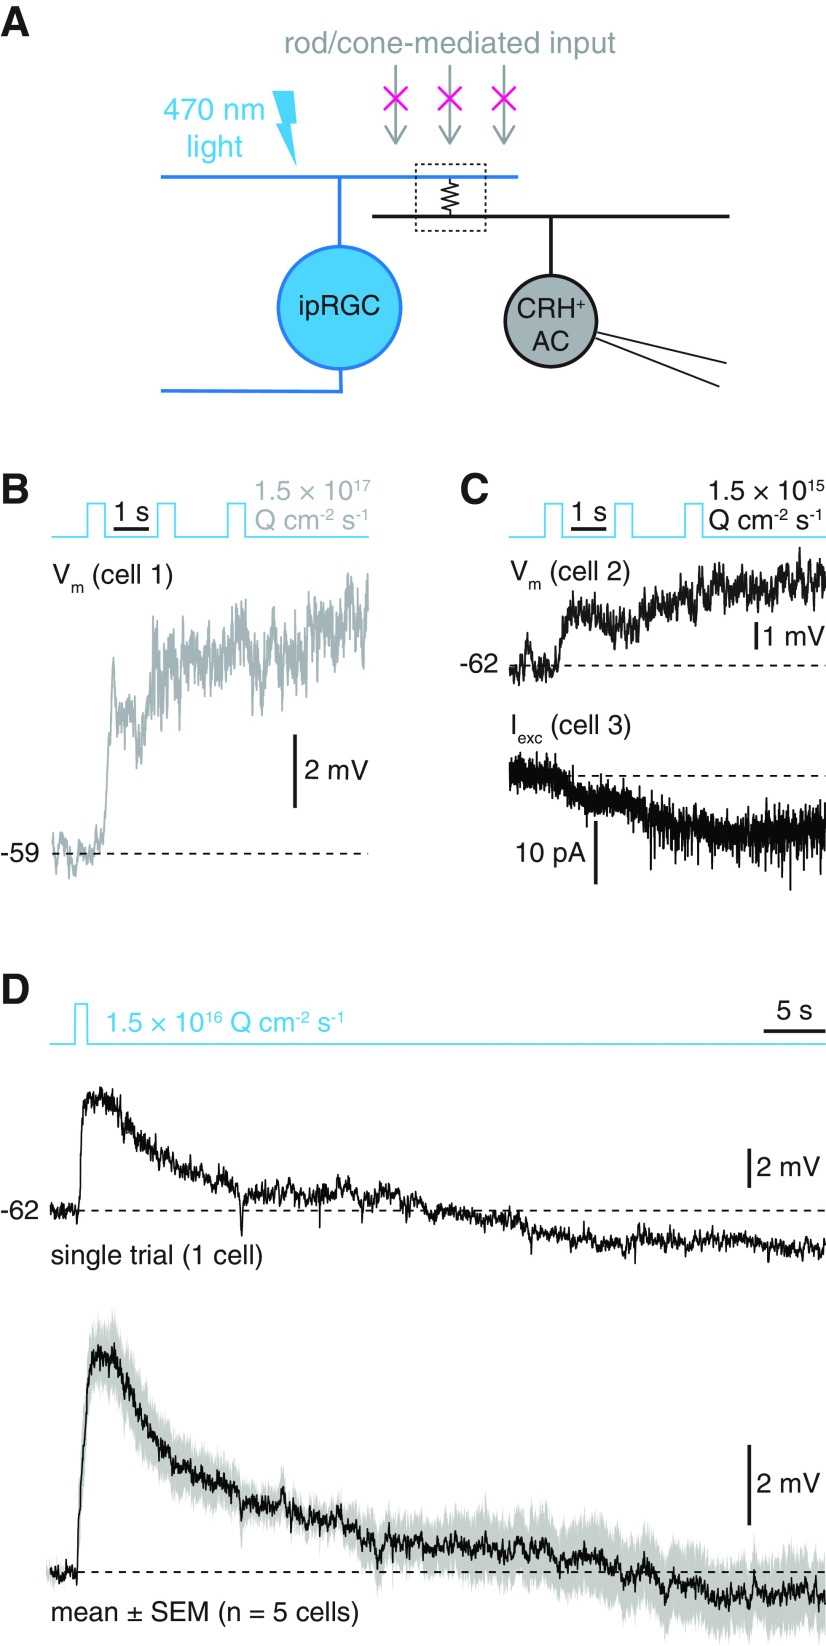
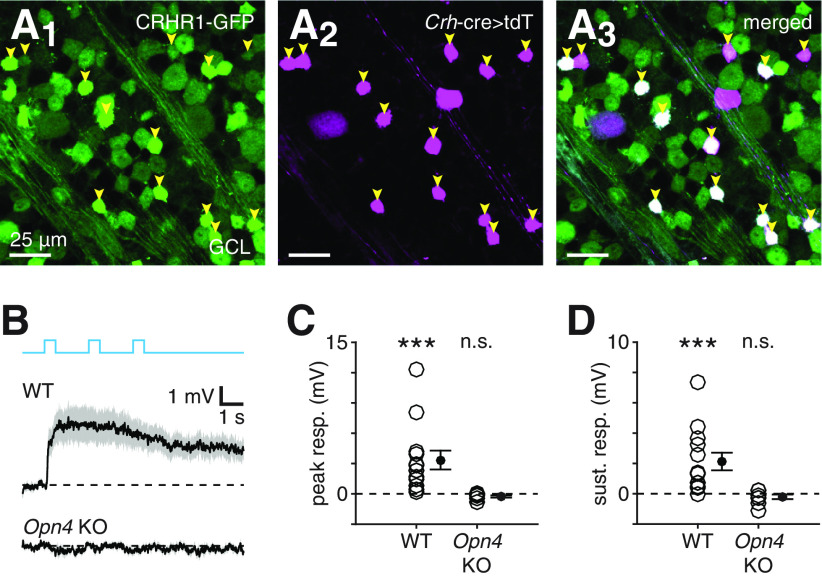
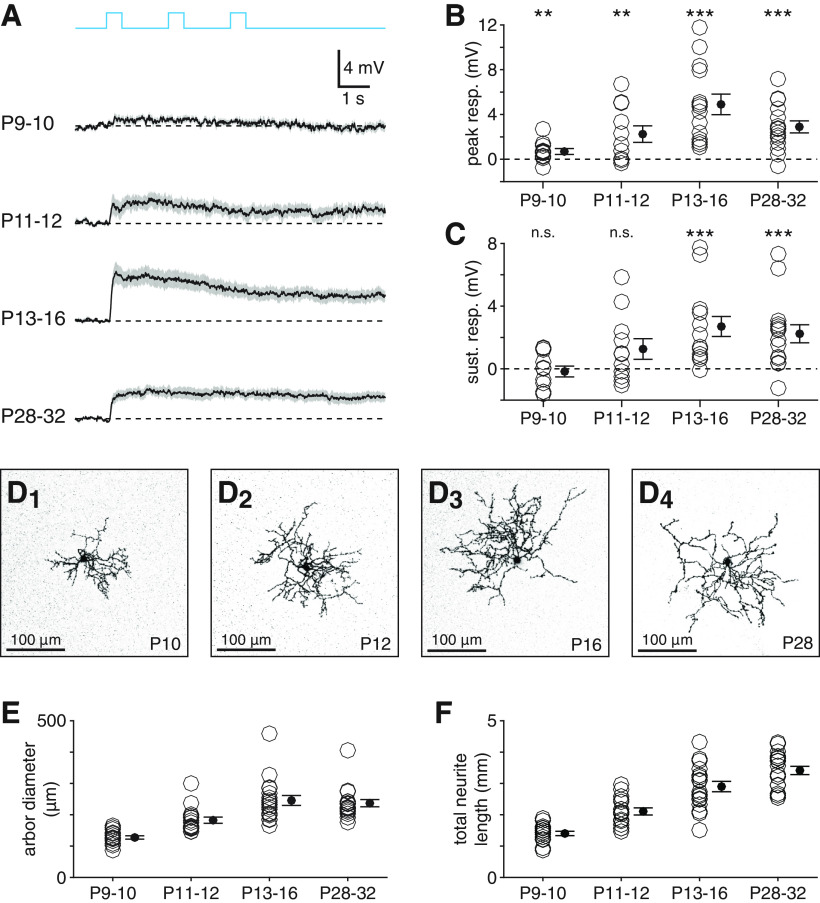
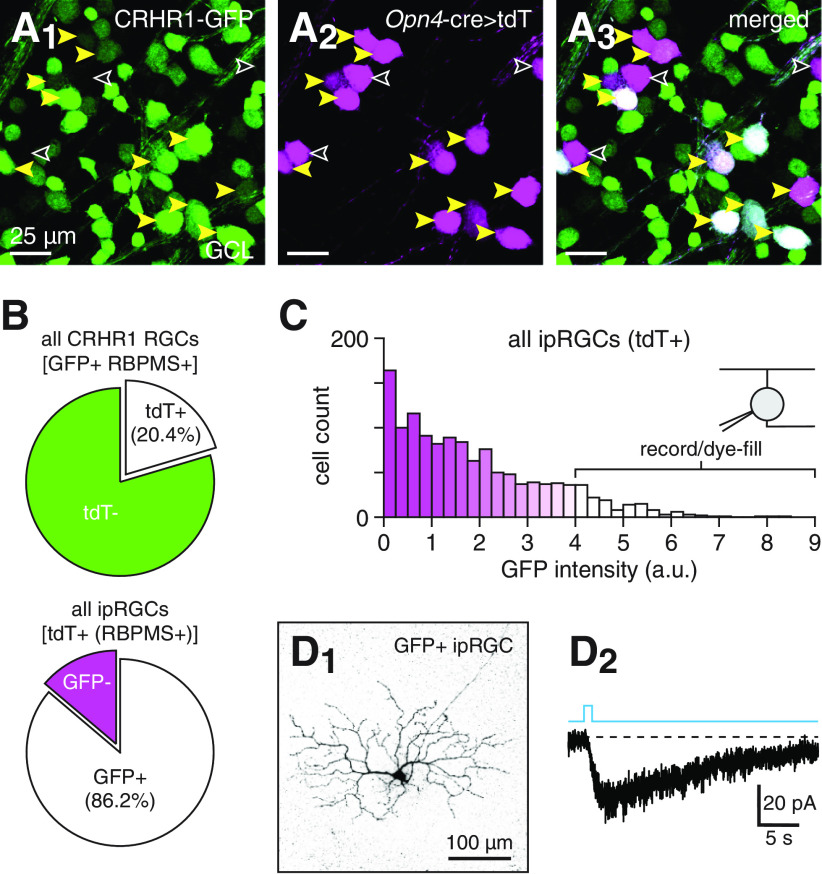
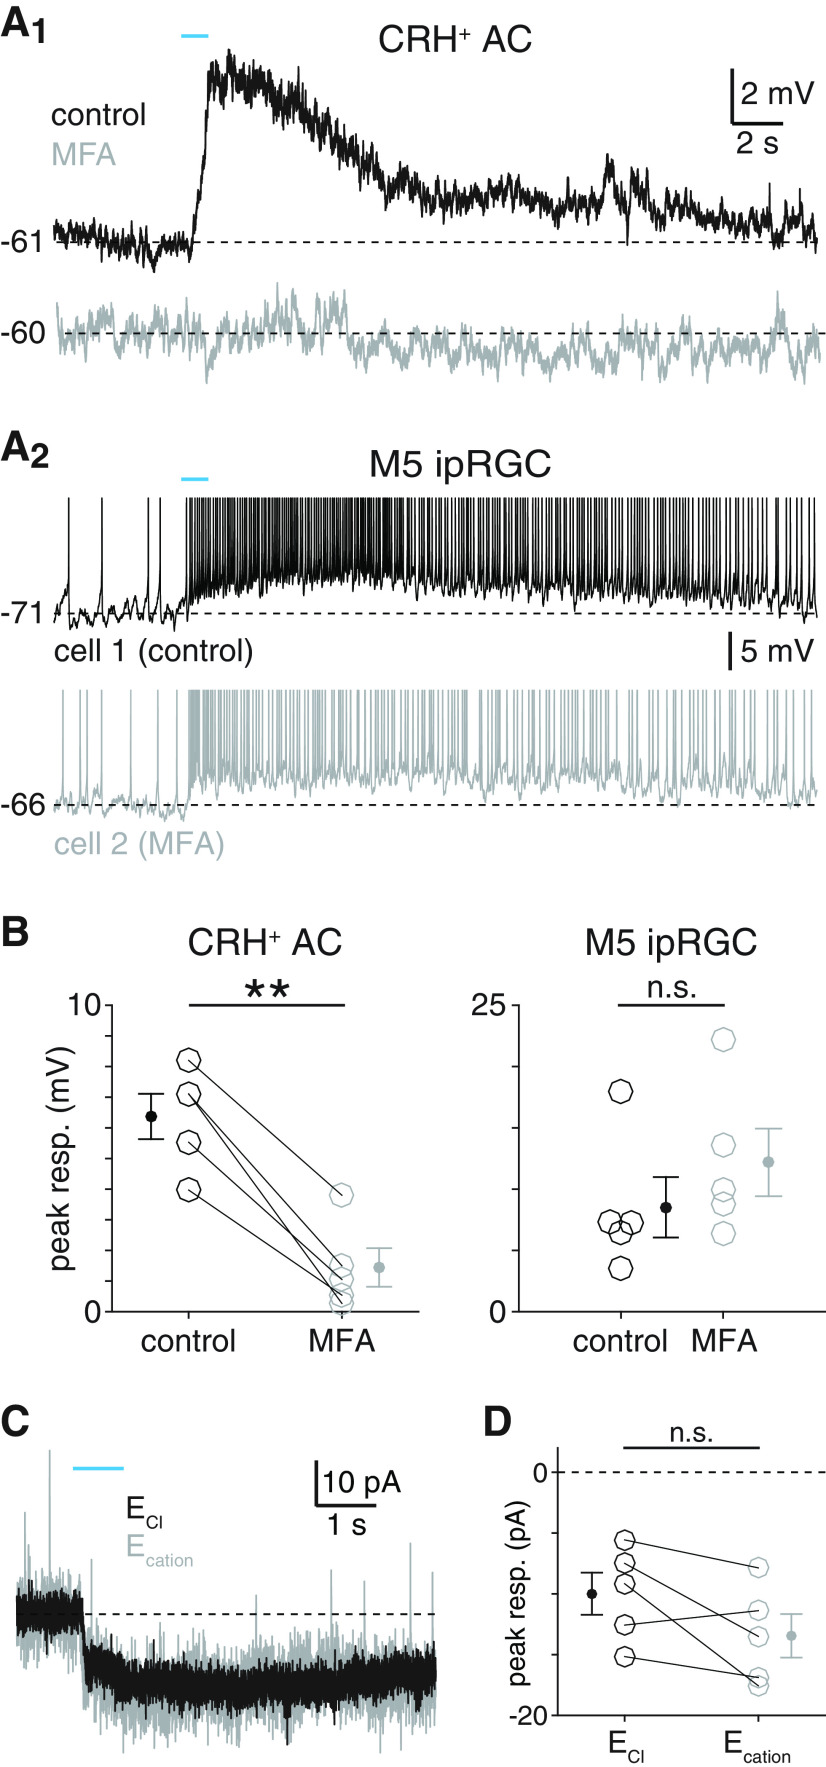
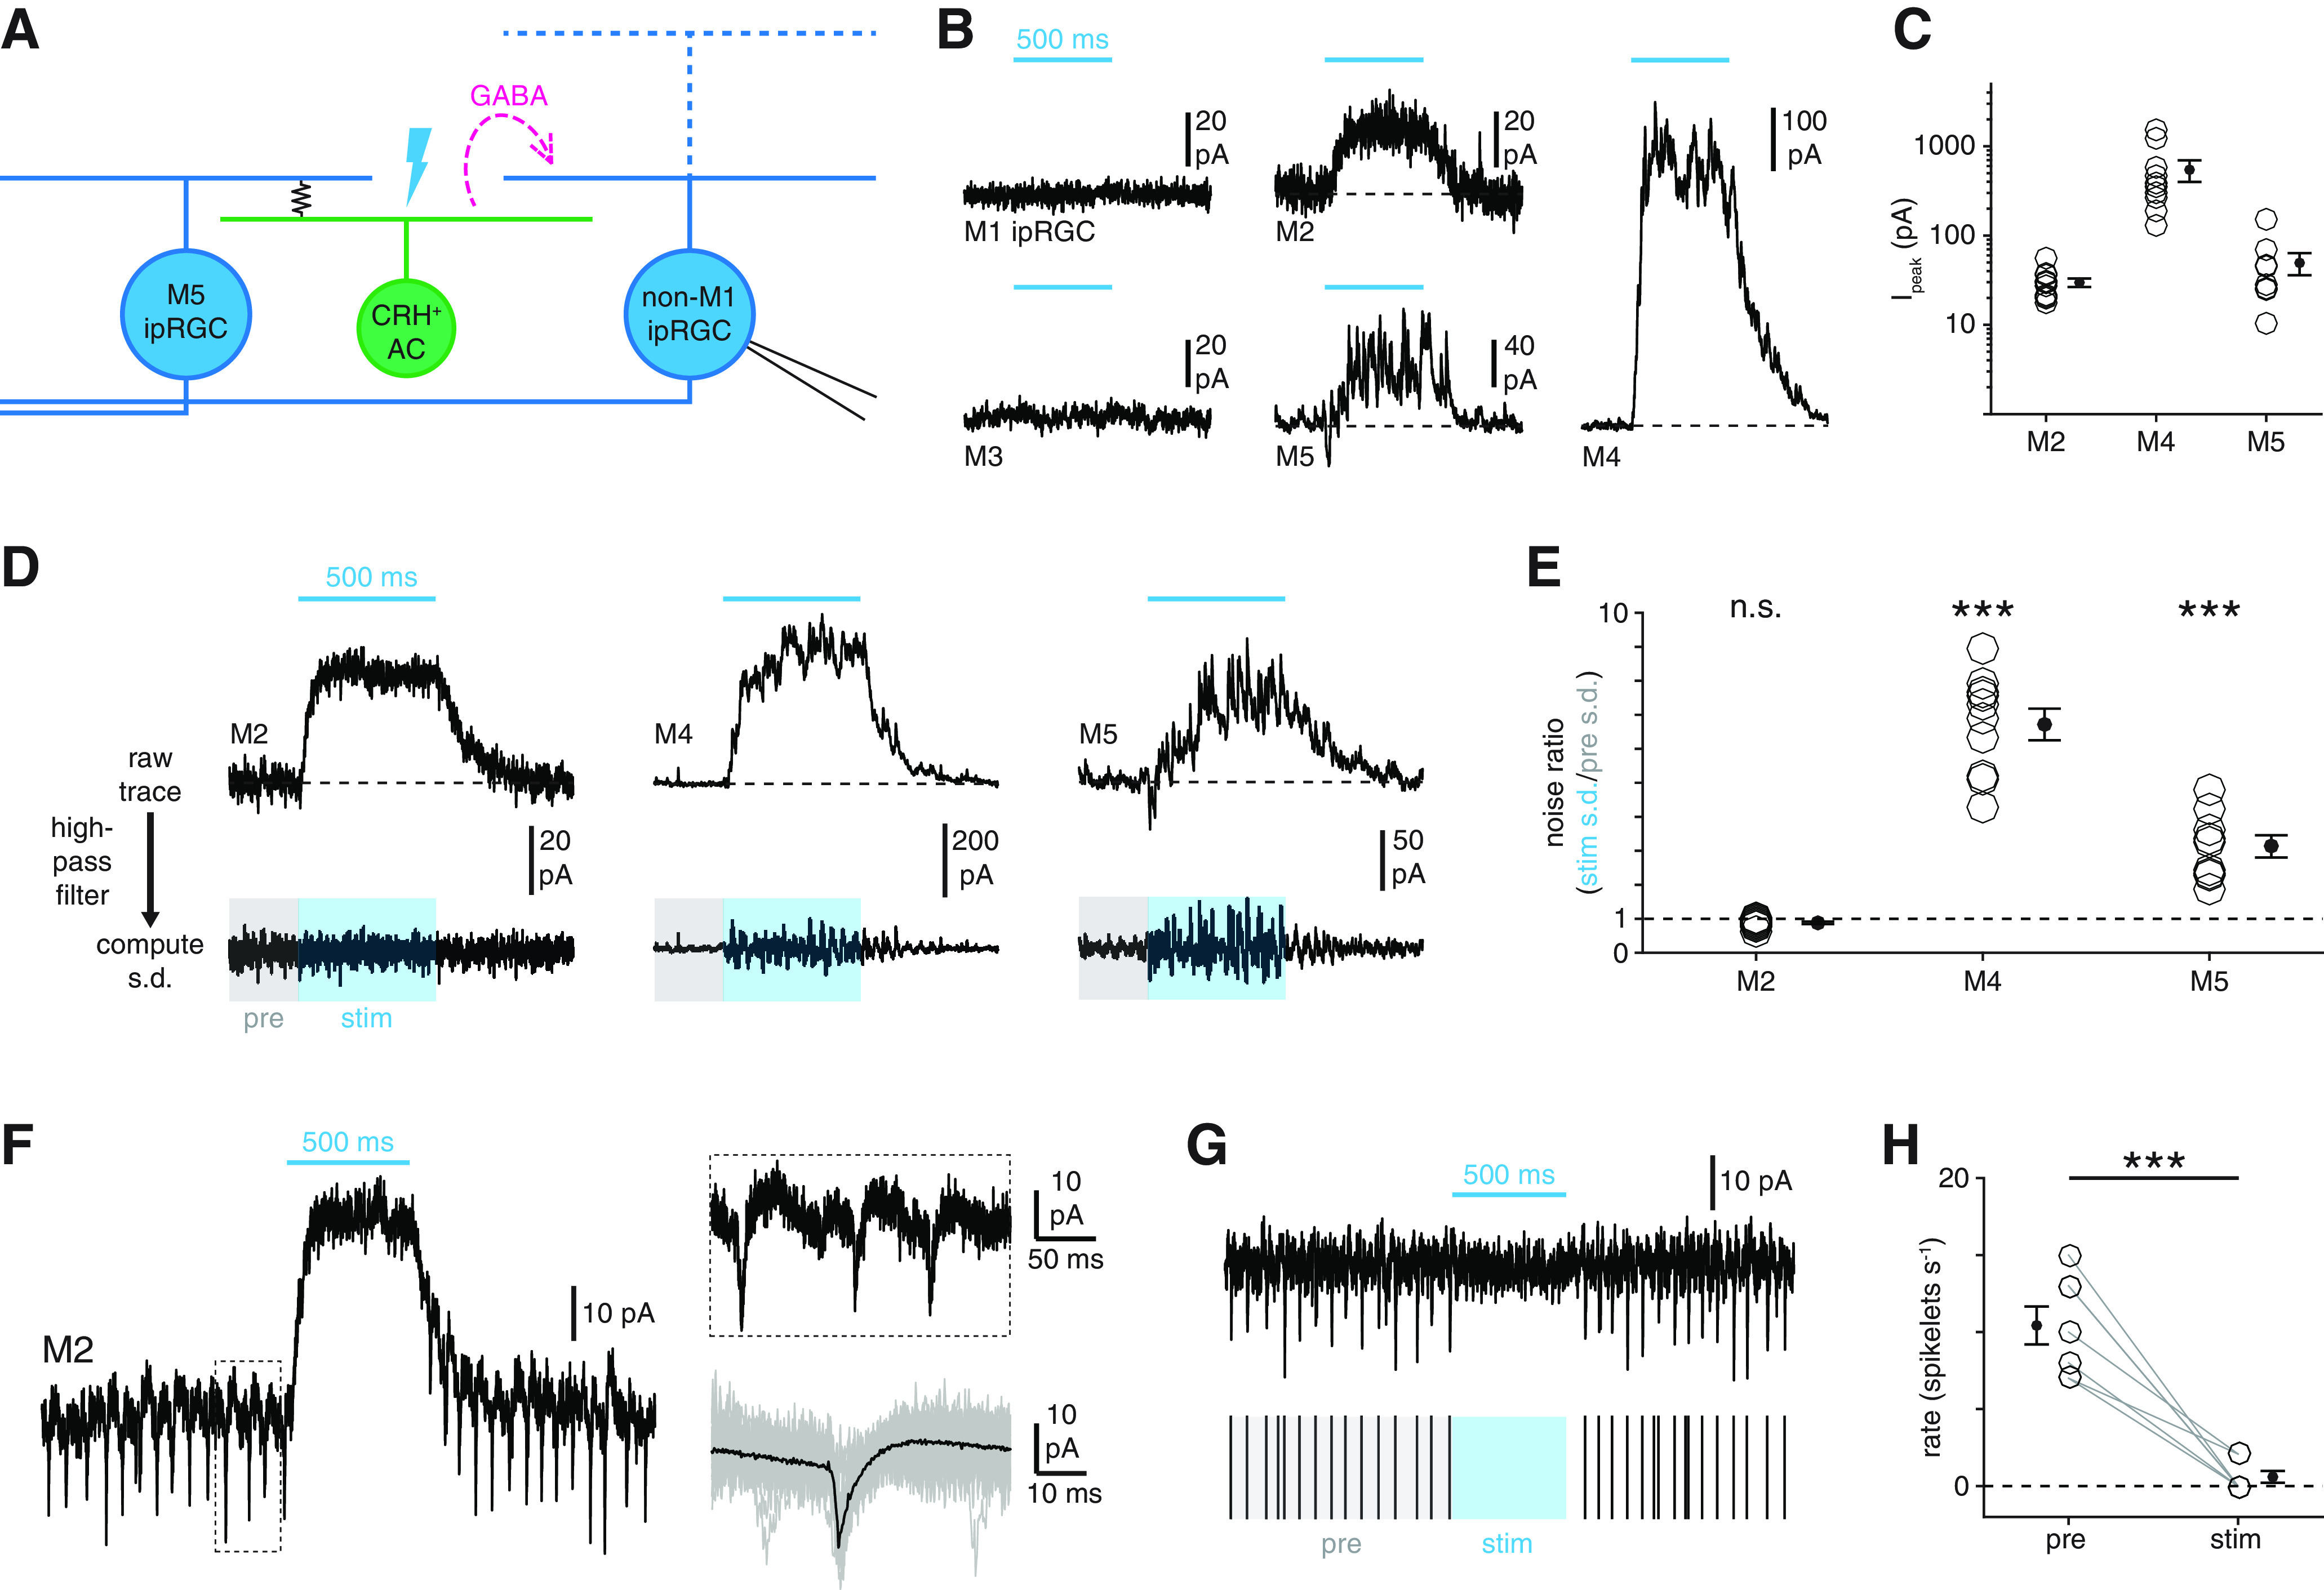
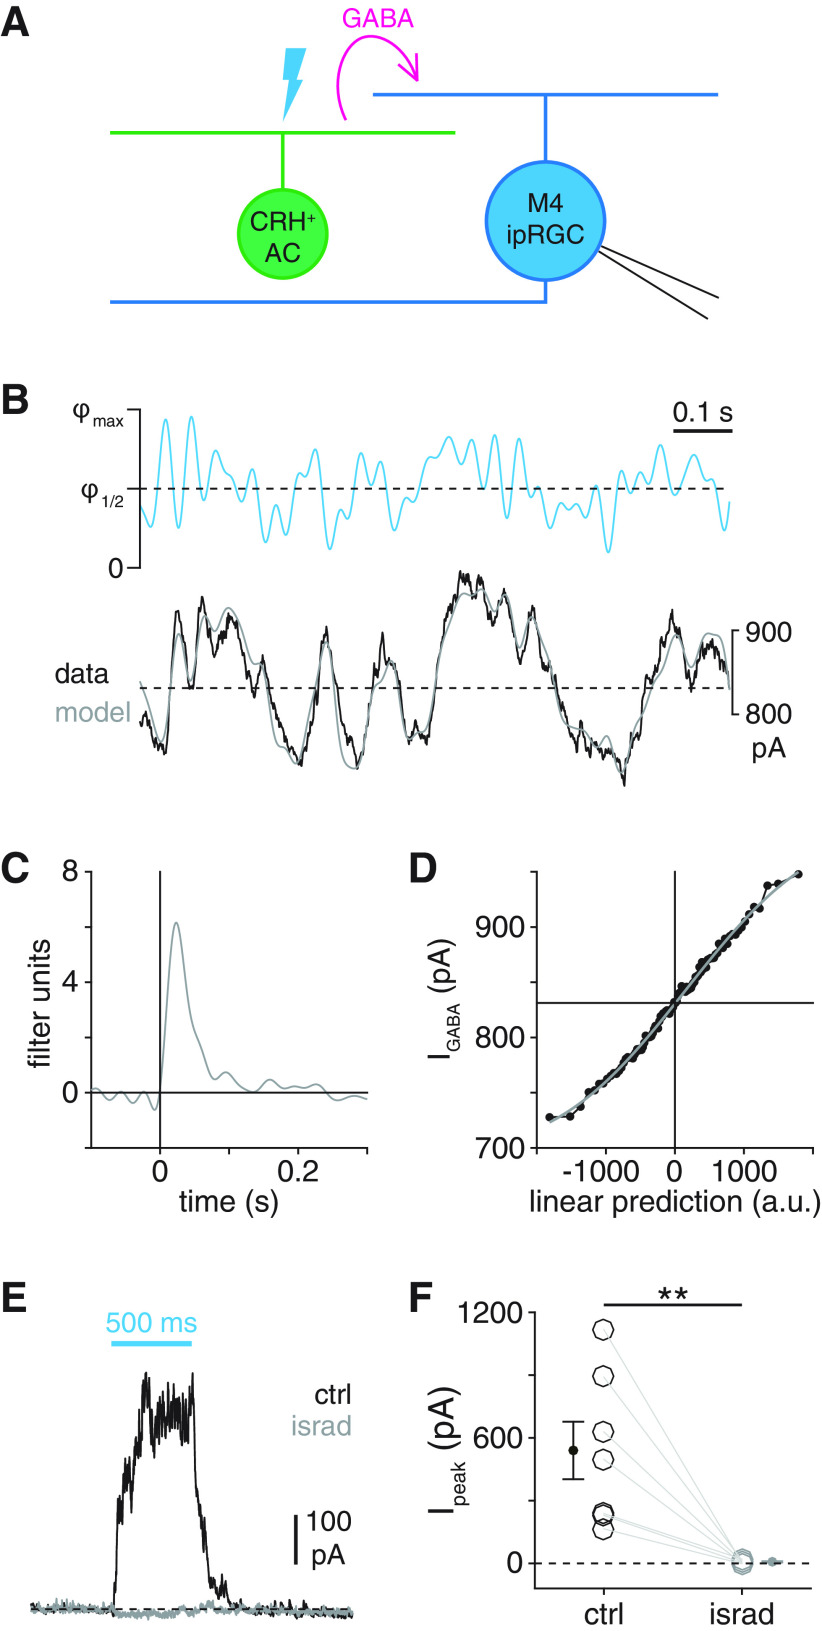
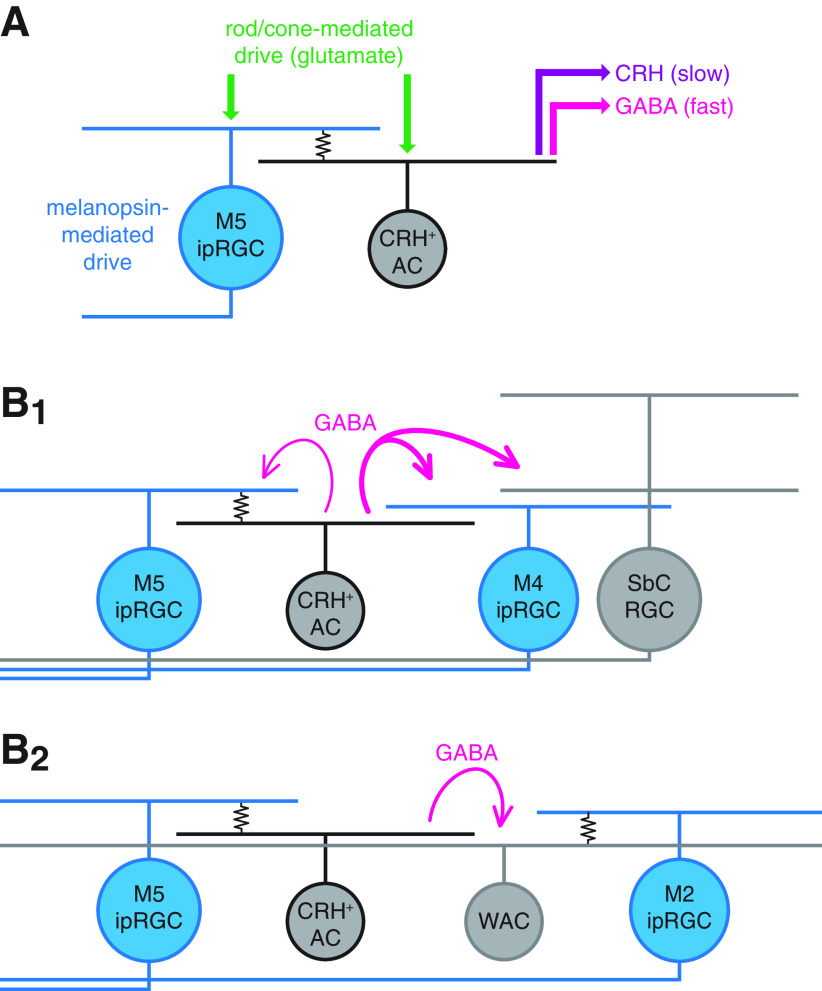
Intrinsically photosensitive retinal ganglion cells (ipRGCs) exhibit melanopsin-dependent light responses that persist in the absence of rod and cone photoreceptor-mediated input. In addition to signaling anterogradely to the brain, ipRGCs signal retrogradely to intraretinal circuitry via gap junction-mediated electrical synapses with amacrine cells (ACs). However, the targets and functions of these intraretinal signals remain largely unknown. Here, in mice of both sexes, we identify circuitry that enables M5 ipRGCs to locally inhibit retinal neurons via electrical synapses with a nonspiking GABAergic AC. During pharmacological blockade of rod- and cone-mediated input, whole-cell recordings of corticotropin-releasing hormone-expressing (CRH+) ACs reveal persistent visual responses that require both melanopsin expression and gap junctions. In the developing retina, ipRGC-mediated input to CRH+ ACs is weak or absent before eye opening, indicating a primary role for this input in the mature retina (i.e., in parallel with rod- and cone-mediated input). Among several ipRGC types, only M5 ipRGCs exhibit consistent anatomical and physiological coupling to CRH+ ACs. Optogenetic stimulation of local CRH+ ACs directly drives IPSCs in M4 and M5, but not M1-M3, ipRGCs. CRH+ ACs also inhibit M2 ipRGC-coupled spiking ACs, demonstrating direct interaction between discrete networks of ipRGC-coupled interneurons. Together, these results demonstrate a functional role for electrical synapses in translating ipRGC activity into feedforward and feedback inhibition of local retinal circuits.SIGNIFICANCE STATEMENT Melanopsin directly generates light responses in intrinsically photosensitive retinal ganglion cells (ipRGCs). Through gap junction-mediated electrical synapses with retinal interneurons, these uniquely photoreceptive RGCs may also influence the activity and output of neuronal circuits within the retina. Here, we identified and studied an electrical synaptic circuit that, in principle, could couple ipRGC activity to the chemical output of an identified retinal interneuron. Specifically, we found that M5 ipRGCs form electrical synapses with corticotropin-releasing hormone-expressing amacrine cells, which locally release GABA to inhibit specific RGC types. Thus, ipRGCs are poised to influence the output of diverse retinal circuits via electrical synapses with interneurons.

Keywords: amacrine cell; corticotropin releasing hormone; gap junction; ipRGC; melanopsin; retinal ganglion cell.


Figures

Figure 1.
Figure 1.
CRH+ ACs exhibit slow, rod- and cone-independent light responses. A, Circuit diagram illustrating putative ipRGC-AC electrical synapse and experimental paradigm. An ipRGC participates in a gap junction-mediated electrical synapse (middle, boxed resistor symbol) with a CRH+ AC. During pharmacological blockade of rod- and cone-mediated input, photostimulation of the ipRGC depolarizes the coupled CRH+ AC. B, Current-clamp recording of rod- and cone-independent light response in a CRH+ AC targeted in a Crh-cre+/−;Ai14+/− retinastim = 1.5 × 10¹⁷ Q cm−2 s−1). C, Same format as in B, but for 100-fold lower photostimulus intensity. Traces represent current-clamp (top) and voltage-clamp (bottom; Vhold = −70 mV) recordings from separate CRH+ ACs. D, Rod- and cone-independent light responses to a 1 s light pulse in a single CRH+ AC (top) and average response of 5 ACs (bottom). Gray shading represents ± SEM across cells.
Figure 2.
Figure 2.
Rod- and cone-independent light responses of CRH+ ACs depend on melanopsin. A, Confocal micrographs showing GFP fluorescence (A1), tdT fluorescence driven by a Crh-cre allele (A2), and their overlap (A3) in the GCL of a Crhr1-gfp+;Crh-cre+/−;Ai14+/− retina. Arrowheads indicate small somas that exhibit overlap between both fluorescence channels. B, Effect of melanopsin KO on rod- and cone-independent light responses in CRH+ ACs. Top, Black trace represents mean rod- and cone-independent voltage response of presumed CRH+ ACs (n = 13) to photostimulation. Gray shading represents ± SEM across cells. Bottom, Same format as top but for presumed CRH+ ACs (n = 9) recorded in melanopsin KO (Opn4 KO; i.e., Crhr1-gfp+;Opn4Cre/Cre) retinas (Φstim = 1.5 × 10¹⁷ Q cm−2 s−1). C, D, Peak (C) and sustained (D) voltage responses in CRH+ ACs shown in B. ***p < 0.001.
Figure 3.
Figure 3.
Melanopsin-dependent light responses of CRH+ ACs mature after eye opening. A, Melanopsin-dependent voltage responses of CRH+ ACs at four developmental time points. From top, mean (black) ± SEM (gray) of melanopsin-dependent light responses across CRH+ ACs at P9-P10 (n = 11), P11-P12 (n = 11), P13-P16 (n = 14), and P28-P32 (n = 15) (Φstim = 1.5 × 10¹⁷ Q cm−2 s−1). B, C, Peak (B) and sustained (C) voltage responses in CRH+ ACs shown in A. D, Confocal micrographs showing morphological development of CRH+ AC neurites at P10 (D1), P12 (D2), P16 (D3), and P28 (D4). Images are projections of ∼20 consecutive slices of a z stack (0.41 µm spacing). E, F, Neurite arbor diameter (E) and total neurite length (F) of CRH+ ACs (n = 16, n = 16, n = 18, and n = 18) at time points studied in A-C. **p < 0.01. ***p < 0.001.
Figure 4.
Figure 4.
Labeling of ipRGCs in Crhr1-gfp retinas. A, GFP labeling of a subset of genetically identified ipRGCs in a Crhr1-gfp+;Opn4Cre/+;Ai14+/− retina. Confocal micrographs show GFP fluorescence (green, A1), tdT expression driven by an Opn4-cre allele (Opn4-cre>tdT) (magenta, A2), and their overlap (A3) in the GCL of a Crhr1-gfp+;Opn4Cre/+;Ai14+/− retina. Yellow arrowheads indicate somas that exhibit overlap between both fluorescence channels. Empty arrowheads indicate tdT+ somas that lack GFP expression. B, Quantification of overlap between genetically labeled ipRGCs (tdT+) and GFP+ RGCs in the GCL of Crhr1-gfp+;Opn4Cre/+;Ai14+/− retinas; 20.4% of GFP+ RGCs are ipRGCs (top) and 86.2% of ipRGCs are GFP+ (bottom). C, GFP fluorescence intensity distribution of genetically labeled ipRGCs (tdT+) in Crhr1-gfp+;Opn4Cre/+;Ai14+/− retinas. D, Targeted recording and dye-filling of intensely GFP+ ipRGCs in Crhr1-gfp retinas. D1, Confocal micrograph of an intensely GFP+ ipRGC (>90th percentile in distribution shown in C) dye-filled during whole-cell recording in a whole-mount Crhr1-gfp retina. D2, Melanopsin-mediated intrinsic photocurrent of cell shown in D1 in response to a 1 s light pulse (Φstim = 1.5 × 10¹⁶ Q cm−2 s−1).
Figure 5.
Figure 5.
Identification and targeting of ipRGC types labeled in Crhr1-gfp retinas. A, Visualizing overlap between SMI-32- and GFP-positive cell populations in Crhr1-gfp retinas. A1, Confocal micrograph showing SMI-32 immunostaining (cyan, A1) in the GCL of a Crhr1-gfp+;Opn4Cre/+;Ai14+/− retina. A2, same region as in A1, but also showing tdT expression driven by an Opn4-cre allele (Opn4-cre>tdT) (magenta). Empty arrowheads indicate somas dual-labeled by SMI-32 and tdT. A3, same as in A2, but showing GFP expression (green) instead of SMI-32 staining. Yellow arrowheads indicate strong overlap (white) between tdT and GFP fluorescence channels. B, Same format as in A, but for Crhr1-gfp+;Opn4Cre/+;Ai14+/− retina immunostained with an antibody against melanopsin (αOpn4). C, Soma size plotted against GFP fluorescence intensity for SMI-32+ and SMI-32 ipRGCs in Crhr1-gfp+;Opn4Cre/+;Ai14+/− retinas. D, GFP fluorescence intensity distributions of ipRGCs in Crhr1-gfp+;Opn4Cre/+;Ai14+/− retinas immunostained with SMI-32 (top) or αOpn4 (bottom). E, Decision trees for targeting specific ipRGC types: M4 (E1), M1-M3 (E2), and M5-M6 (E3).
Figure 6.
Figure 6.
Selectivity of electrical coupling between ipRGC types and CRH+ ACs. A, Circuit diagram illustrating electrophysiological assay for ipRGC-CRH+ AC coupling. Optogenetic stimulation of a CRH+ AC (green, right) expressing ChR2 generates a photocurrent that propagates to a recorded ipRGC (blue, left) via a gap junction-mediated electrical synapse (boxed resistor symbol). B, Experimental isolation of ChR2-dependent coupling currents from melanopsin-dependent photocurrents in ipRGCs. Blue trace represents current (Vhold = −70 mV) recorded from an M4 ipRGC during repeated photostimulation of ChR2+ CRH+ ACs (Φmax = 4.8 × 10¹⁷ Q cm−2 s−1). Initially, a melanopsin-mediated inward current (Imel, black arrow) dominates the measured response. During later stimuli, fast inward currents are evident. Black represents the analyzed period of the response. C, Patterns of coupling currents measured in M1-M5 ipRGC types during optogenetic stimulation of CRH+ ACs. C1, Green trace represents light-evoked ChR2 currents recorded in a CRH+ AC. Black traces represent examples of fast inward currents recorded in M2, M4, and M5 ipRGCs during optogenetic stimulation of CRH+ ACs. C2, Gray traces represent examples of weak or null responses in M1-M4 ipRGCs during optogenetic stimulation of CRH+ ACs. D, Latencies of coupling currents in ipRGCs. Traces represent the response near stimulus onset for the cells shown in C1. Coarse dashed lines indicate prestimulus baseline current. Fine dashed lines indicate response threshold. E, ChR2 photocurrent amplitude in CRH+ ACs (n = 7 cells) and coupling current amplitude in M1-M5 ipRGCs (n = 7, n = 8, n = 4, n = 5, and n = 10 cells, respectively). F, Coupling current latency for all cells in E exhibiting suprathreshold responses (CRH: n = 7; M2: n = 3; M3: n = 1; M4: n = 3; M5: n = 10). *p < 0.05. ***p < 0.001.
Figure 7.
Figure 7.
Selectivity of tracer coupling between ipRGC types and CRH+ ACs. A, Visualizing overlap between cells exhibiting Crh-ires-cre-dependent fluorescence and cells tracer-coupled to an M2 ipRGC. Confocal micrographs of Neurobiotin labeling (magenta) in an injected M2 ipRGC and tracer-coupled somas (A1); tdT expression (green) in putative CRH+ ACs, driven by a Crh-ires-cre allele (Crh-cre>tdT) (A2); and their overlap (A3). *Soma of the Neurobiotin-injected M2 ipRGC. Empty arrowheads indicate Neurobiotin-filled somas that lack tdT expression. B, Same format as in A for an M4 ipRGC. C, Same format as in A and B for an M5 ipRGC. Yellow arrowheads indicate Neurobiotin-filled somas of tdT+ cells. D, Total number of tracer-coupled cells plotted against number of tracer-coupled CRH+ ACs for all Neurobiotin-injected M2 (n = 7), M4 (n = 9), and M5 (n = 5) ipRGCs. Dashed line indicates unity (i.e., cases where all tracer-coupled cells are CRH+ ACs). E, Fraction of tracer-coupled cells that were putative CRH+ ACs, for each M2, M4, and M5 ipRGC shown in D. **p < 0.01. ***p < 0.001.
Figure 8.
Figure 8.
Rod- and cone-independent light responses of a WAC type that sparsely exhibits Crh-ires-cre-dependent fluorescence. A, Tracer coupling between an M2 ipRGC and a putative CRH+ AC. Confocal micrographs of Neurobiotin labeling in an injected M2 ipRGC and tracer-coupled somas (Nb, magenta, A1), ChR2-EYFP expression driven by a Crh-ires-cre allele (Crh-cre>ChR2-EYFP, green, A2), and their overlap (A3) in an Opn4-gfp+;Crh-cre+/−;Ai32+/− retina. *Soma of the injected M2 ipRGC. Arrowhead indicates single Neurobiotin-filled soma exhibiting Cre-dependent fluorescence. B, Circuit diagram illustrating electrical coupling between an ipRGC (left, blue) and a ChR2+ WAC (right, green). C, Rod- and cone-independent voltage response of a spiking ChR2+ WAC to a 1 s light pulse in a Crh-cre+/−;Ai32+/− retina (Φstim = 1.5 × 10¹⁶ Q cm−2 s−1).
Figure 9.
Figure 9.
Gap junctions mediate melanopsin-dependent light responses of CRH+ ACs. A, Melanopsin-mediated light responses of CRH+ ACs (A1) and M5 ipRGCs (A2) during pharmacological blockade of gap junctions. A1, Melanopsin-dependent voltage response of a CRH+ AC before (top, black trace) and after (bottom, gray trace) bath application of MFA (100 μm, ∼15 min). A2, Intrinsic photoresponses of a control M5 ipRGC (top, black trace) and a different M5 ipRGC exposed to MFA (bottom, gray trace). Stimulus intensity, Φstim = 1.5 × 10¹⁶ Q cm−2 s−1. B, Peak voltage responses of CRH+ ACs (n = 5) before and after MFA application (left) and of M5 ipRGCs in the absence (n = 5) or presence (n = 5) of MFA (right). C, Melanopsin-dependent photocurrent of CRH+ ACs remains stable under changes in holding potential. Photocurrent of a CRH+ AC voltage-clamped near the reversal potential for either chloride (ECl; Vhold = −70 mV, black trace) or cations (Ecation; Vhold = 0 mV, gray trace). D, Peak current responses in CRH+ ACs (n = 5) at ECl and Ecation. **p < 0.01.
Figure 10.
Figure 10.
Cell type specificity of synaptic inhibition by CRH+ ACs. A, Circuit diagram represents GABAergic inhibition (dashed magenta arrow) of an ipRGC (right, blue) evoked by optogenetic stimulation of an M5 ipRGC-coupled CRH+ AC (green, middle). B, Membrane currents of M1-M5 ipRGCs during optogenetic stimulation of CRH+ ACs (Vhold = Ecation = 0 mV). Cyan bars represent stimulus period (Φstim = 4.8 × 10¹⁷ Q cm−2 s−1). C, Amplitudes of inhibitory currents evoked in M2 (n = 11), M4 (n = 10), and M5 (n = 9) ipRGCs during optogenetic stimulation of CRH+ ACs. D, Noise analysis of inhibitory currents evoked by CRH+ AC stimulation. Top row, Currents recorded in an M2, an M4, and an M5 ipRGC during optogenetic stimulation of CRH+ ACs. Bottom row, Currents shown at top after high-pass filtering (20 Hz cutoff). Noise ratio is the SD of the current during the stimulus period (stim, blue-shaded window) divided by the SD during a prestimulus period (pre, gray-shaded window). E, Noise ratios in M2, M4, and M5 ipRGCs evoked by CRH+ AC stimulation. F, Physiological evidence for electrical coupling between M2 ipRGCs and spiking neurons. Left, Membrane current of an M2 ipRGC (Vhold = 0 mV) during optogenetic stimulation of CRH+ ACs. Top right, Expanded view of the boxed period at left. Bottom right, Mean (black) of 135 individual spikelets (gray, 50 shown) measured in the same cell. G, CRH+ AC stimulation suppresses spikelet rate in M2 ipRGCs. Top, Black trace represents high-pass filtered membrane current of M2 ipRGC shown in F during CRH+ AC stimulation. Bottom, Spikelet times extracted from top trace with prestimulus (pre, gray) and stimulus (stim, blue) periods indicated. H, CRH+ AC stimulation-evoked changes in spikelet rates in M2 ipRGCs (n = 7). ***p < 0.001.
Figure 11.
Figure 11.
Computational and biophysical properties of CRH+ AC synapses. A, Circuit diagram illustrating GABAergic inhibition (magenta arrow) of a recorded M4 ipRGC (right, blue) evoked by optogenetic stimulation of a ChR2+ CRH+ AC (left, green). B, LN model obtained from IPSCs recorded in an M4 ipRGC during optogenetic WN stimulation of CRH+ ACs. Top, Cyan trace represents 1 s segment of an optogenetic WN stimulus (Φmax = 4.8 × 10¹⁷ Q cm−2 s−1). Dashed line indicates half-maximal stimulus intensity (Φ1/2). Stimuli were designed such that average stimulus intensity was equal to Φ1/2. Bottom, Black trace represents mean IPSC obtained by averaging responses to 10 repeated trials. Gray trace represents output of LN model constructed from responses to nonrepeated stimuli. Dashed line indicates recorded response value corresponding to a linear prediction of 0 (arbitrary units, a.u.; see Materials and Methods). C, D, Linear filter (C) and static nonlinearity (D) of LN model whose output is shown in B. Horizontal line indicates recorded response value corresponding to a linear prediction of 0 (a.u.). Black points indicate nonlinearity computed from data. Gray curve represents fit. E, IPSCs depend on L-type VGCCs. IPSCs recorded from an M4 ipRGC during optogenetic stimulation of CRH+ ACs before (black) and after (gray) bath application of isradipine (israd, 30 μm). Cyan bar represents stimulus period (Φstim = 4.8 × 10¹⁷ Q cm−2 s−1). F, Peak IPSC amplitudes in M4 ipRGCs (n = 7 cells) before and after isradipine application. **p < 0.01.
Figure 12.
Figure 12.
Proposed functions for electrical synapses between ipRGCs and CRH+ ACs. A, Circuit diagram represents multiple sources of excitatory drive to an ipRGC-coupled CRH+ AC. A CRH+ AC participates in an electrical synapse (resistor symbol) with a melanopsin-expressing M5 ipRGC. The CRH+ AC directly receives excitatory glutamatergic input from BCs (green arrows), which are driven by rod and cone photoreceptor activity. Through the electrical synapse, the CRH+ AC is indirectly influenced by intrinsic melanopsin- and extrinsic glutamate-mediated excitatory drive of the coupled M5 ipRGC. The combined drive of these three sources modulates the release of GABA (magenta arrow) and CRH (purple arrow) onto downstream targets, potentially over different time scales. B, Circuit diagrams represent GABAergic signaling motifs enabled by electrical synapses between CRH+ ACs and ipRGCs. B1, GABAergic inhibition of specific ganglion cell types by a CRH+ AC enables ipRGC activity to modulate retinal circuit outputs. A CRH+ AC (middle left, gray) provides strong feedforward GABAergic inhibition (thick magenta arrows) to an M4 ipRGC (middle right, blue) and a suppressed-by-contrast (SbC) RGC and modest feedback inhibition (fine magenta arrow) to an electrically coupled M5 ipRGC (left, blue). B2, GABAergic inhibition of an M2 ipRGC-coupled WAC by a CRH+ AC enables inhibitory interaction between distinct ipRGC-AC electrical networks. An M5 ipRGC-coupled CRH+ AC (middle left, gray) provides feedforward GABAergic inhibition (magenta arrow) to an M2 ipRGC-coupled WAC (middle right, right) whose axons extend broadly throughout the retinal area.

Similar articles

Cited by

References

    1. Allen AE, Storchi R, Martial FP, Petersen RS, Montemurro MA, Brown TM, Lucas RJ (2014) Melanopsin-driven light adaptation in mouse vision. Curr Biol 24:2481–2490. 10.1016/j.cub.2014.09.015 - DOI - PMC - PubMed
    1. Arroyo DA, Kirkby LA, Feller MB (2016) Retinal waves modulate an intraretinal circuit of intrinsically photosensitive retinal ganglion cells. J Neurosci 36:6892–6905. 10.1523/JNEUROSCI.0572-16.2016 - DOI - PMC - PubMed
    1. Berson DM, Dunn FA, Takao M (2002) Phototransduction by retinal ganglion cells that set the circadian clock. Science 295:1070–1073. 10.1126/science.1067262 - DOI - PubMed
    1. Berson DM, Castrucci AM, Provencio I (2010) Morphology and mosaics of melanopsin-expressing retinal ganglion cell types in mice. J Comp Neurol 518:2405–2422. 10.1002/cne.22381 - DOI - PMC - PubMed
    1. Bleckert A, Schwartz GW, Turner MH, Rieke F, Wong RO (2014) Visual space is represented by nonmatching topographies of distinct mouse retinal ganglion cell types. Curr Biol 24:310–315. 10.1016/j.cub.2013.12.020 - DOI - PMC - PubMed

Publication types

MeSH terms

LinkOut - more resources