. 2021 Jan 19;118(3):e2019097118.
doi: 10.1073/pnas.2019097118.

Acute skin exposure to ultraviolet light triggers neutrophil-mediated kidney inflammation

Affiliations

Acute skin exposure to ultraviolet light triggers neutrophil-mediated kidney inflammation

Sladjana Skopelja-Gardner et al. Proc Natl Acad Sci U S A. .

Abstract

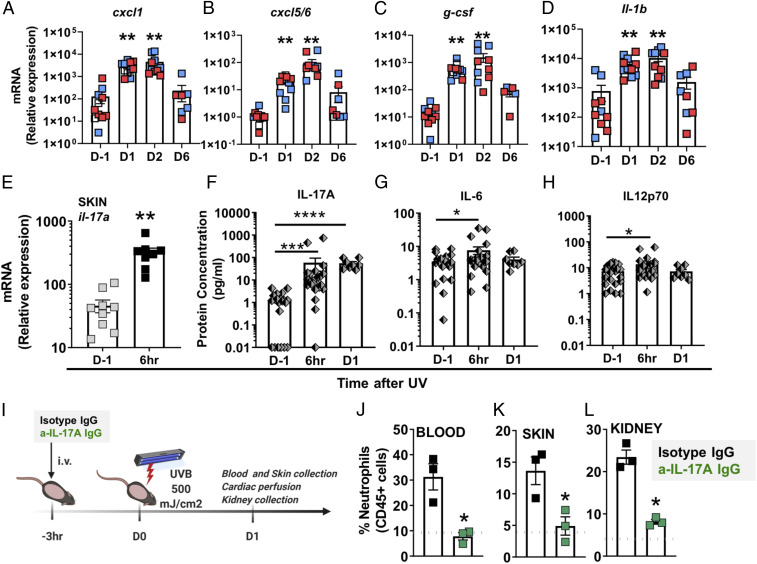
Photosensitivity to ultraviolet (UV) light affects up to ∼80% of lupus patients. Sunlight exposure can exacerbate local as well as systemic manifestations of lupus, including nephritis, by mechanisms that are poorly understood. Here, we report that acute skin exposure to UV light triggers a neutrophil-dependent injury response in the kidney characterized by upregulated expression of endothelial adhesion molecules as well as inflammatory and injury markers associated with transient proteinuria. We showed that UV light stimulates neutrophil migration not only to the skin but also to the kidney in an IL-17A-dependent manner. Using a photoactivatable lineage tracing approach, we observed that a subset of neutrophils found in the kidney had transited through UV light-exposed skin, suggesting reverse transmigration. Besides being required for the renal induction of genes encoding mediators of inflammation (vcam-1, s100A9, and Il-1b) and injury (lipocalin-2 and kim-1), neutrophils significantly contributed to the kidney type I interferon signature triggered by UV light. Together, these findings demonstrate that neutrophils mediate subclinical renal inflammation and injury following skin exposure to UV light. Of interest, patients with lupus have subpopulations of blood neutrophils and low-density granulocytes with similar phenotypes to reverse transmigrating neutrophils observed in the mice post-UV exposure, suggesting that these cells could have transmigrated from inflamed tissue, such as the skin.

Keywords: UV light; inflammation; kidney; neutrophil migration.


Conflict of interest statement

The authors declare no competing interest.

Figures

Fig. 1.
Fig. 1.
Skin exposure to UVB light triggers kidney inflammatory responses, transient proteinuria, and up-regulation of kidney injury markers. (A) Following skin exposure to a single dose of UVB light (500 mJ/cm2), urine and kidney samples were collected at the time points shown (D = day) following cardiac perfusion. (BG) Gene expression of (B and C) adhesion molecules vcam-1 and e-selectin and (DG) inflammatory mediators s100a9, s100a6, il1b, and cxcl12 on different days following exposure to UVB light relative to the non-UV–irradiated controls (D-1) was determined by qPCR. Significance was determined by one-way ANOVA with Tukey’s post hoc (n = 3 to 6 per group; *P < 0.05, **P < 0.01, ***P < 0.001). (H and I) Proteinuria was quantified by (H) Bradford assay and (I) urine albumin/creatinine ratio (UACR) at the times shown after exposure to UV light. Significant differences in proteinuria/UACR were determined relative to measurements from the urine of nonirradiated controls (D-1) using (H) one-way ANOVA with Tukey’s post hoc or (I) Student’s t test (n = 10 per time frame; **P < 0.01). (J and K) Gene expression of renal endothelial injury markers (J) lipocalin-2 and (K) kim-1 over time following skin exposure to UV light was compared to non-UV–exposed controls (D-1). Significance was determined by one-way ANOVA with Tukey’s post hoc (n = 3 to 6 per group; *P < 0.05, **P < 0.01, ***P < 0.001).
Fig. 2.
Fig. 2.
Skin exposure to UVB light triggers neutrophilia and neutrophil infiltration into the skin and peripheral organs, including the kidney. (A) Following a single exposure of skin to 500 mJ/cm2 UVB light, neutrophils were quantified in the blood, skin, lung, spleen, and kidney at the time points shown. Following whole body perfusion, cells were isolated from the sites shown in BG, and the number of neutrophils (Ly6C+Ly6G+ cells) evaluated in the CD45+ live cells gate in female (red) and male (blue) mice on days (D) 1, 2, and 6 after UV exposure. Differences in neutrophil numbers on different days after exposure to UVB light were determined relative to nonirradiated controls (D-1) using one-way ANOVA with Tukey’s post hoc (n = 6 to 10 per group; mean ± SEM; *P < 0.05, **P < 0.01, ***P < 0.001; #P < 0.05 comparing fold increase in male versus female mice). Representative flow cytometry plots for each organ are shown in SI Appendix, Fig. S5. (H) IF staining of frozen kidney sections on D2 after UV exposure demonstrating NE (Cy5, magenta), PECAM-1/CD31 (Al488, green), and nuclear DAPI (blue) staining in the tubulointerstitium and glomeruli. NE staining in vascular endothelium is denoted by a white, full arrow (colocalization of NE and CD31, yellow); NE staining in the interstitial tissue is denoted by dotted white arrows; and NE staining in glomeruli is denoted by yellow arrows. Isotype control staining is shown in the leftmost panel. (Magnification, 40×.)
Fig. 3.
Fig. 3.
Skin exposure to UV light triggers IL-17A production, which is required for neutrophil recruitment. (AD) Relative mRNA expression in skin obtained from female (red) and male (blue) mice was quantified by qPCR using the primers listed in SI Appendix, Table S1 and normalized to 18S transcript levels. The bars represent mean relative expression ± SEM for all samples combined. (E) Il-17A gene expression in the skin 6 h after UV exposure was quantified as in AD. (FG) Multiplex analysis of the protein concentration in plasma samples collected 6 h or one day (D1) after UV (F) IL-17A, (G) IL-6, and (H) IL-12p70. Significant changes in gene expression and plasma protein levels at different time points after exposure to UV light were determined relative to those of nonirradiated controls (D-1) using one-way ANOVA with Tukey’s post hoc (AD, n = 8 to 10; FH, n = 8 to 25 mice per group; mean ± SEM, *P < 0.05, **P < 0.01, ***P < 0.001). (I) Shaved B6 mice were treated intravenously (i.v.) with 100 µg anti–IL-17A IgG (green) or isotype control IgG (black) 3 h before exposure to a single dose of UVB light (500 mJ/cm2). One day after UV exposure (D1), neutrophils were quantified in (J) blood, (K) skin, and (L) kidney by flow cytometry as in Fig. 2. The dotted gray lines represent the average baseline neutrophil percentage in blood, skin, and kidney of noninjected mice. Statistical differences between treatment groups were determine by paired Student’s t test (n = 3, *P < 0.05, ****P < 0.0001).
Fig. 4.
Fig. 4.
UVB light–triggered neutrophil migration to the kidney is required for kidney inflammatory and injury responses. (A) B6 mice (n = 4 to 5 per group) were either not exposed to UV (no UV, gray), were exposed to UV and received 50 μg isotype control IgG intraperitoneally (i.p.) (red), or were exposed to UV and received 50 μg anti-GCSF IgG i.p. (blue). Two doses of anti–G-CSF blocking IgG or isotype control IgG were given at 24 h and 3 h prior to UVB skin exposure. One day after UV exposure (D1), kidneys were collected and analyzed by flow cytometry and qPCR. (BD) Flow cytometry analysis of (C) percent neutrophils (CD11b+Ly6C+Ly6G+) in the blood, (D) number of neutrophils per kidney, and (E) number of monocytes (CD11b+Ly6C+Ly6G−) in the CD45+ kidney cell population. (EJ) Gene expression analysis of (E and F) adhesion molecules vcam-1 and e-selectin, (G and H) inflammatory mediators s100a9 and il1b, and (I and J) kidney injury markers lipocalin-2 and kim-1. (K) IFN-I score in the kidney was evaluated based on relative expression of 10 ISGs as described in Materials and Methods. (BK) Statistical significance was determined by one-way ANOVA with Tukey’s post hoc (n = 4 to 5 per group; mean ± SEM, *P < 0.05, **P < 0.01, ***P < 0.001, ns = not significant).
Fig. 5.
Fig. 5.
A subpopulation of kidney neutrophils are derived from UV light–exposed skin. (A) UBC-PA-GFP mice were shaved and irradiated with UVB light as in Fig. 1. One day (D1) after UV exposure, the UV-irradiated skin was subjected to PA by violet light (405 nm), as described in Materials and Methods. Cardiac perfusion was performed and kidneys collected 24 h after PA (D2). (B) The percentage of GFP+ neutrophils (CD45+Ly6CintLy6Ghi) in the kidneys of UV-exposed (UV+) and PA (PA+) mice was determined by flow cytometry. The percentage of GFP+ neutrophils was compared to the kidneys from three different mouse controls: no UV, no PA; no UV, +PA; and +UV, no PA by one-way ANOVA with Tukey’s post hoc (n = 4 to 8 animals/treatment, ***P < 0.001, ns = not significant). (C) CXCR4 mean fluorescence intensity (MFI) was determined by flow cytometry in photoconverted (GFP+, red) neutrophils in the skin and kidney and GFP− (blue) neutrophils in the skin and kidney of mice exposed to UV light and PA as shown in A. Skin and kidney tissue were analyzed at the same time. The MFI was determined by subtracting FMO MFI for each tissue. (D) Flow cytometry analysis of the percent ICAM1hiCXCR1lo cells in the GFP+ and GFP− neutrophil populations in the skin and kidneys of mice exposed to UV light and PA as shown in A. (C and D) Statistical differences between groups were determined by Student’s t test (n = 3 individual experiments; *P < 0.05).
Fig. 6.
Fig. 6.
Increased CXCR4 expression and presence of ICAM1hiCXCR1lo neutrophils (PMNs) and LDGs in SLE patients. (A and C) Mean fluorescence intensity (MFI) of CXCR4 was determined by flow cytometry analysis of (A) circulating PMNs (CD66b+) and (C) LDGs (CD10+CD15+CD14−) from healthy controls (gray) and SLE patients (red). (B and D) The percentage of ICAM1hiCXCR1lo cells was determined by flow cytometry of (B) circulating PMNs and (D) LDGs from healthy controls and SLE patients. Representative histograms and gates are shown. Statistical differences between groups were determined by Student’s t test (n = 6 to 12; *P < 0.05, **P < 0.01).

Comment in

  • Skin-kidney crosstalk in SLE.
    Kolios AGA, Tsokos GC. Kolios AGA, et al. Nat Rev Rheumatol. 2021 May;17(5):253-254. doi: 10.1038/s41584-021-00588-0. Nat Rev Rheumatol. 2021. PMID: 33633360 No abstract available.

References

    1. Kaul A., et al. , Systemic lupus erythematosus. Nat. Rev. Dis. Primers 2, 16039 (2016). - PubMed
    1. Schmidt E., Tony H. P., Bröcker E. B., Kneitz C., Sun-induced life-threatening lupus nephritis. Ann. N. Y. Acad. Sci. 1108, 35–40 (2007). - PubMed
    1. Barbhaiya M., Costenbader K. H., Ultraviolet radiation and systemic lupus erythematosus. Lupus 23, 588–595 (2014). - PubMed
    1. Kuhn A., et al. , Photoprotective effects of a broad-spectrum sunscreen in ultraviolet-induced cutaneous lupus erythematosus: A randomized, vehicle-controlled, double-blind study. J. Am. Acad. Dermatol. 64, 37–48 (2011). - PubMed
    1. Der E. et al.; Accelerating Medicines Partnership Rheumatoid Arthritis and Systemic Lupus Erythematosus (AMP RA/SLE) Consortium , Tubular cell and keratinocyte single-cell transcriptomics applied to lupus nephritis reveal type I IFN and fibrosis relevant pathways. Nat. Immunol. 20, 915–927 (2019). - PMC - PubMed

Publication types

MeSH terms