. 2021 Jan 4;12(1):11.
doi: 10.1038/s41467-020-20162-8.

Pan-cancer circulating tumor DNA detection in over 10,000 Chinese patients

Affiliations

Pan-cancer circulating tumor DNA detection in over 10,000 Chinese patients

Yongliang Zhang et al. Nat Commun. .

Erratum in

Abstract

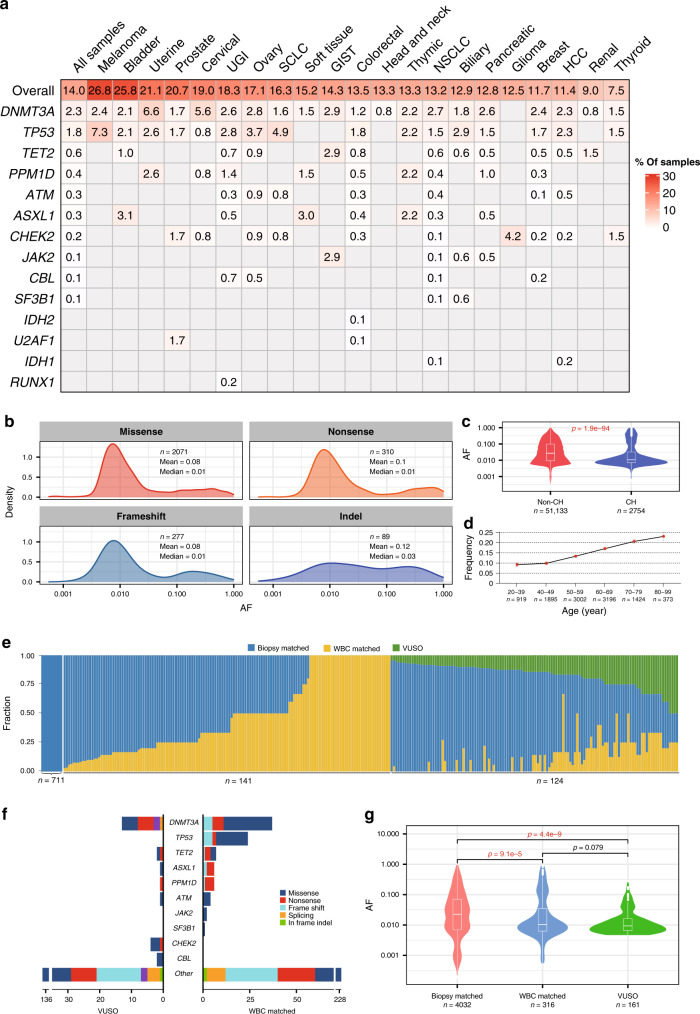
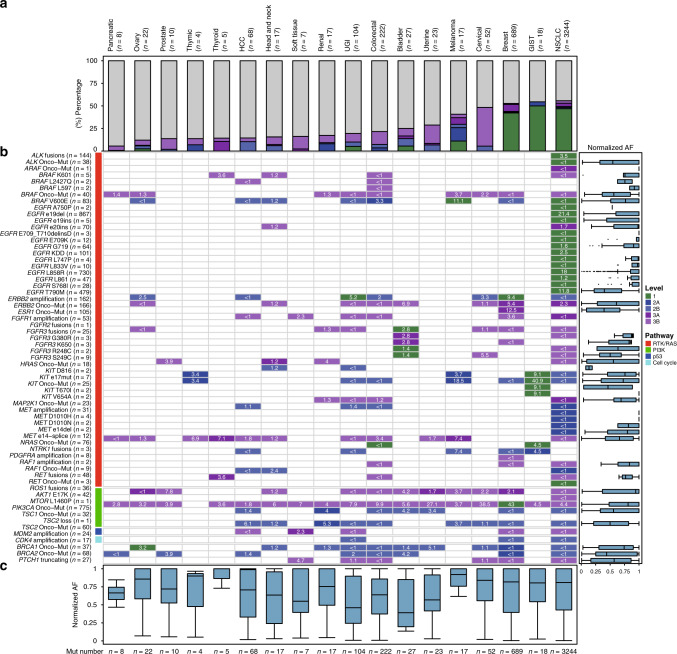
Circulating tumor DNA (ctDNA) provides a noninvasive approach to elucidate a patient's genomic landscape and actionable information. Here, we design a ctDNA-based study of over 10,000 pan-cancer Chinese patients. Using parallel sequencing between plasma and white blood cells, 14% of plasma cell-free DNA samples contain clonal hematopoiesis (CH) variants, for which detectability increases with age. After eliminating CH variants, ctDNA is detected in 73.5% of plasma samples, with small cell lung cancer (91.1%) and prostate cancer (87.9%) showing the highest detectability. The landscape of putative driver genes revealed by ctDNA profiling is similar to that in a tissue-based database (R2 = 0.87, p < 0.001) but also shows some discrepancies, such as higher EGFR (44.8% versus 25.2%) and lower KRAS (6.8% versus 27.2%) frequencies in non-small cell lung cancer, and a higher TP53 frequency in hepatocellular carcinoma (53.1% versus 28.6%). Up to 41.2% of plasma samples harbor drug-sensitive alterations. These findings may be helpful for identifying therapeutic targets and combined treatment strategies.


Conflict of interest statement

The authors declare no competing interests.

Figures

Fig. 1
Fig. 1. Identifying CH variants in plasma cfDNA via matched WBC sequencing.
a Percentage of plasma samples with identified CH variants in different cancer types. The first row indicates the overall percentage of samples with any CH variants in different cancer types, and the other rows indicate the percentage of samples with CH variants in 15 canonical genes. Gray nubs indicate that no CH variants were detected. b Density distribution of AFs of identified CH variants in cfDNA. Different panels indicate the distribution of different mutational types. c AFs of CH variants in cfDNA were significantly lower than non-CH mutations (two-sided Mann–Whitney U test). Centre line, median; box limits, upper and lower quartiles; whiskers, data range. d The percentage of plasma samples with CH variants increases with the age of patients. Error bars indicate SEM. e Relative fractions of biopsy-matched variants, WBC-matched variants, and VUSOs in each plasma cfDNA with matched tumor tissue and WBC sequencing. f Distribution of WBC-matched variants and VUSOs according to gene categories. Only canonical CH-related genes are shown. g Comparison of variant AFs among biopsy-matched variants, WBC-matched variants, and VUSOs (two-sided Mann–Whitney U test). Centre line, median; box limits, upper and lower quartiles; whiskers, data range. AF allele frequency, CH clonal hematopoiesis, VUSO variant of unknown source, WBC white blood cell, GIST gastrointestinal stromal tumor, HCC hepatocellular carcinoma, NSCLC non-small cell lung cancer, SCLC small cell lung cancer, UGI upper gastrointestinal cancer.
Fig. 2
Fig. 2. Detectability of ctDNA in pan-cancer plasma.
a Detection sensitivity of ctDNA in multiple cancer types. b AFs of ctDNA mutations varied across different cancer types. Median values are represented by black lines within the bars. For samples with multiple mutations, the highest AF is highlighted. Centre line, median; box limits, upper and lower quartiles; whiskers, 1.5× interquartile range; points, outliers. c Different cancer types showed different bTMB. Median values are represented by black lines within the bars. Centre line, median; box limits, upper and lower quartiles; whiskers, 1.5× interquartile range; points, outliers. d Density distribution of bTMB of all enrolled samples. Vertical solid and broken lines indicate the median and upper/lower quartile values, respectively. Based on the upper quartile of bTMB, the cut-off for high and low bTMB was set as 8.7 mutations/Mb. e Relative fractions of high and low bTMB samples in different cancer types. f Comparison of MATH values for different cancer types between our ctDNA and MSKCC cohorts (two-sided Mann–Whitney U test). The bottom red and green numbers indicate the sample sizes of corresponding tumor subtypes in the ctDNA cohort and MSKCC, respectively. Median values are represented by black lines within the bars. Centre line, median; box limits, upper and lower quartiles; whiskers, 1.5× interquartile range; points, outliers. AF allele frequency, bTMB blood tumor mutational burden, GIST gastrointestinal stromal tumor, HCC hepatocellular carcinoma, NSCLC non-small cell lung cancer, SCLC small cell lung cancer, UGI upper gastrointestinal cancer.
Fig. 3
Fig. 3. Mutational landscape revealed by ctDNA profiling.
a Heatmap illustrating the top 20 most common mutant genes. Color gradation represents the mutational prevalence of each gene in different cancer types. The right bars indicate the distribution of different mutational types for each displayed gene. b Mutational prevalence of driver genes in our ctDNA and MSKCC cohorts. Putative driver genes in different cancer types are displayed. Symbol colors correspond to different cancer types. The statistical test used is two-tailed Pearson correlation test. GIST gastrointestinal stromal tumor, HCC hepatocellular carcinoma, NSCLC non-small cell lung cancer, SCLC small cell lung cancer, UGI upper gastrointestinal cancer.
Fig. 4
Fig. 4. Pathway members and interactions in the ten selected pathways.
Oncogenes and tumor-suppressor genes are illustrated with red and blue, respectively. Color intensity indicates the frequency of alteration within the entire dataset. Blank boxes represent genes not covered in our sequencing panel.
Fig. 5
Fig. 5. Estimated ctDNA clonality is consistent with genomic characteristics of cancer subtypes.
a Number of mutations with different ranges of clonality in the overall cohort, NSCLC, colorectal cancer, and breast cancer. Several common driver genes are highlighted with different colors and demonstrate shifts in fractions within different clonality ranges. b Clonality distribution of TP53, EGFR, KRAS, and PIK3CA in different cancer types. In each panel, cancer types with fewer than five specific mutations (TP53, EGFR, KRAS, and PIK3CA) are not shown. Centre line, median; box limits, upper and lower quartiles; whiskers, 1.5× interquartile range; points, outliers.
Fig. 6
Fig. 6. Overview of therapeutic actionability revealed by ctDNA profiling.
a Frequencies of clinical actionability across different cancer types, broken down by evidence levels. GIST gastrointestinal stromal tumor, HCC hepatocellular carcinoma, NSCLC non-small cell lung cancer, SCLC small cell lung cancer, UGI upper gastrointestinal cancer. b Frequencies of actionable alterations across cancer types. Alterations are grouped by pathway. The right box chart indicates the clonality distribution of different actionable alterations. Centre line, median; box limits, upper and lower quartiles; whiskers, 1.5× interquartile range; points, outliers. c Clonality distribution of actionable alterations in different cancer types. Centre line, median; box limits, upper and lower quartiles; whiskers, data range.
Fig. 7
Fig. 7. Circulating tumor burden determined by ctDNA profiling is associated with therapeutic prognosis.
a Overview of tumor types, clinical stages, PFS, ctDNA mutation numbers, and ctDNA AFs for 137 patients receiving targeted therapies guided by ctDNA profiling. b Patients with >2 mutations in ctDNA exhibited poorer PFS than those with ≤2 mutations in ctDNA. c Patients with >0.01 ctDNA AF exhibited poorer PFS than those with ≤0.01 ctDNA AF.

References

    1. Brittain HK, Scott R, Thomas E. The rise of the genome and personalised medicine. Clin. Med. 2017;17:545–551. doi: 10.7861/clinmedicine.17-6-545. - DOI - PMC - PubMed
    1. Zehir A, et al. Mutational landscape of metastatic cancer revealed from prospective clinical sequencing of 10,000 patients. Nat. Med. 2017;23:703–713. doi: 10.1038/nm.4333. - DOI - PMC - PubMed
    1. Cooper LA, et al. PanCancer insights from The Cancer Genome Atlas: the pathologist’s perspective. J. Pathol. 2018;244:512–524. doi: 10.1002/path.5028. - DOI - PMC - PubMed
    1. Bray F, et al. Global cancer statistics 2018: GLOBOCAN estimates of incidence and mortality worldwide for 36 cancers in 185 countries. CA Cancer J. Clin. 2018;68:394–424. doi: 10.3322/caac.21492. - DOI - PubMed
    1. Allemani C, et al. Global surveillance of trends in cancer survival 2000–14 (CONCORD-3): analysis of individual records for 37 513 025 patients diagnosed with one of 18 cancers from 322 population-based registries in 71 countries. Lancet. 2018;391:1023–1075. doi: 10.1016/S0140-6736(17)33326-3. - DOI - PMC - PubMed

Publication types

Substances