. 2021 Jan 4;12(1):104.
doi: 10.1038/s41467-020-20305-x.

Experimental validation of a modeling framework for upconversion enhancement in 1D-photonic crystals

Affiliations

Experimental validation of a modeling framework for upconversion enhancement in 1D-photonic crystals

Clarissa L M Hofmann et al. Nat Commun. .

Abstract

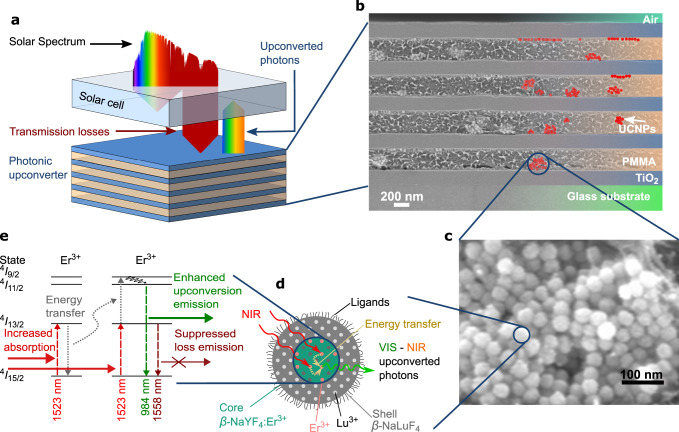
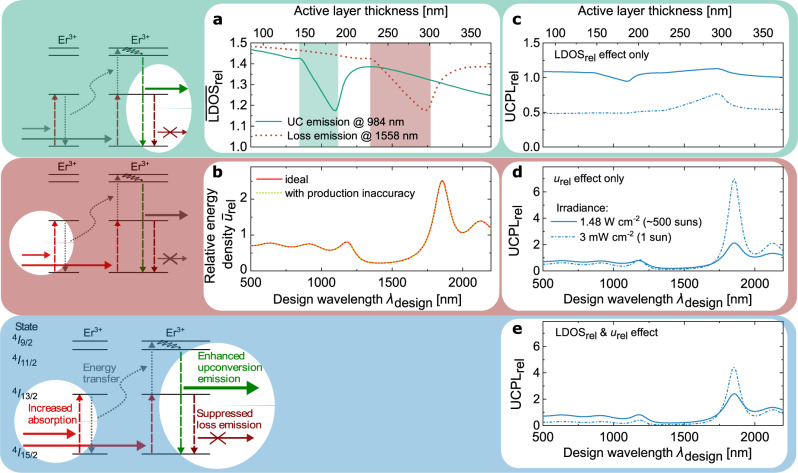
Photonic structures can be designed to tailor luminescence properties of materials, which becomes particularly interesting for non-linear phenomena, such as photon upconversion. However, there is no adequate theoretical framework to optimize photonic structure designs for upconversion enhancement. Here, we present a comprehensive theoretical model describing photonic effects on upconversion and confirm the model's predictions by experimental realization of 1D-photonic upconverter devices with large statistics and parameter scans. The measured upconversion photoluminescence enhancement reaches 82 ± 24% of the simulated enhancement, in the mean of 2480 separate measurements, scanning the irradiance and the excitation wavelength on 40 different sample designs. Additionally, the trends expected from the modeled interaction of photonic energy density enhancement, local density of optical states and internal upconversion dynamics, are clearly validated in all experimentally performed parameter scans. Our simulation tool now opens the possibility of precisely designing photonic structure designs for various upconverting materials and applications.


Conflict of interest statement

The authors declare no competing interests.

Figures

Fig. 1
Fig. 1. Motivation of the investigated photonic upconverter device.
a Approach of utilizing sub-bandgap photons for charge generation in a solar cell by a photonic upconverter on the rear side. b Scanning electron microscope (SEM) image of the realized 1D-photonic structure made of TiO2 and PMMA with embedded upconverter nanoparticles (UCNPs). c SEM image of upconverter nanoparticles. d Schematics of core-shell upconverter nanoparticles of NaYF4:Er3+, converting near infrared (NIR) to NIR and up to visible (VIS) photons in the active core. The inert shell prevents losses due to surface quenching. e Energy levels in the upconverter Er3+ and the upconversion (UC) process influenced by photonic effects of the surrounding structure: increased absorption due to a locally enhanced energy density, non-linearly increasing the probability of an energy transfer UC process, followed by UC emission from a higher level that can be enhanced due to a modified local density of optical states.
Fig. 2
Fig. 2. Design and upconversion photoluminescence (UCPL) of a Bragg structure.
a Energy level diagram of the first seven energy levels of β-NaYF4:25%Er3+, including the processes: ground- and excited-state absorption (GSA, ESA), multi-phonon relaxation (MPR), energy transfer upconversion (ETU) (one exemplary ETU process shown), and spontaneous emission (SPE). b Reflectance of a fabricated Bragg structure with the matched simulated reflectance at a design wavelength λdesign = 1844 nm. The 40 investigated sample designs range from λdesign of 1784 nm to 2005 nm. For UCPL measurements, the excitation wavelength is varied from 1500 nm to 1560 nm. c Measured UCPL under 1523 nm excitation at 1.48 W cm2 irradiance using an integrating sphere to collect the integrated light from all angles. Due to the photonic effects on UC, in the Bragg structure, all UC emission is significantly enhanced. The relative enhancement of the main UCPL at 984 nm (UCPLrel) in the Bragg structure compared to the reference is 4.1.
Fig. 3
Fig. 3. Photonic effects on upconversion (UC) as a function of the design wavelength λdesign.
a Average relative local density of optical states (LDOS¯rel) in the active layers of the Bragg structure for the main UC emission and main loss emission. b Average relative energy density (ūrel) in the active layers of the Bragg structure for an excitation at 1523 nm for an ideal Bragg structure and the fabricated structure including measured production inaccuracies. c–e Relative UC photoluminescence (UCPLrel) at 3 mW cm−2 (1 sun), as well as at 1.48 W cm−2 (~500 suns) irradiance as in experiment, only taking into account the LDOS effect (c), the effect of the relative energy density (d), and both effects (e). Under 1 sun illumination, the irradiance in the absorption range of the upconverter Er3+ (1450 nm–1600 nm) is 3 mW cm−2 (ref. ).
Fig. 4
Fig. 4. Effect of varied parameters on the relative upconversion photoluminescence (UCPLrel)−comparison of simulation and experiment.
a We investigate the dependence of UCPLrel on the design wavelength λdesign using 40 sample designs around the expected maximum UC enhancement, sorted into five groups (I–V) of similar λdesign. Two measurements of each investigated design are plotted, the boxes contain 50%, the whiskers 80% of the data points within each group. Point and horizontal line represent mean and median, respectively. b Scanning the excitation wavelength λexcitation, the mean and standard deviation of UCPLrel within each group I–V is plotted. The applied irradiance in experiment lies between 1.57 W cm−2 at λexcitation = 1500 nm and 1.38 W cm−2 at λexcitation = 1560 nm. The simulation is plotted for the center λdesign of each group at these two boundary irradiances. c Effect of varied irradiance for one sample design of group III, compared to simulation of UCPLrel including only one photonic effect, of the changed local energy density urel or the modified local density of optical states LDOSrel, or both effects. For all investigated parameter scans (ac), the expected trends from simulation are clearly visible in experiment. In the mean of all 2480 measurements at separate parameter combinations, the experimentally measured UCPLrel divided by the simulated UCPLrel is 82 ± 24%, featuring a very good agreement. Source data for a and b (i–v) are provided as a Source Data file.

Similar articles

Cited by

References

    1. Auzel F. Upconversion and anti-Stokes processes with f and d ions in solids. Chem. Rev. 2004;104:139–173. doi: 10.1021/cr020357g. - DOI - PubMed
    1. Dong H, Sun L-d, Yan C-H. Energy transfer in lanthanide upconversion studies for extended optical applications. Chem. Soc. Rev. 2015;44:1608–1634. doi: 10.1039/C4CS00188E. - DOI - PubMed
    1. Liu G. Advances in the theoretical understanding of photon upconversion in rare-earth activated nanophosphors. Chem. Soc. Rev. 2015;44:1635–1652. doi: 10.1039/C4CS00187G. - DOI - PubMed
    1. Wang X, et al. Dye-sensitized lanthanide-doped upconversion nanoparticles. Chem. Soc. Rev. 2017;46:4150–4167. doi: 10.1039/C7CS00053G. - DOI - PubMed
    1. Liu X, et al. Probing the nature of upconversion nanocrystals: instrumentation matters. Chem. Soc. Rev. 2015;44:1479–1508. doi: 10.1039/C4CS00356J. - DOI - PubMed

LinkOut - more resources