. 2021 Jan 4;12(1):56.
doi: 10.1038/s41467-020-20255-4.

A RAC-GEF network critical for early intestinal tumourigenesis

Affiliations

A RAC-GEF network critical for early intestinal tumourigenesis

K A Pickering et al. Nat Commun. .

Abstract

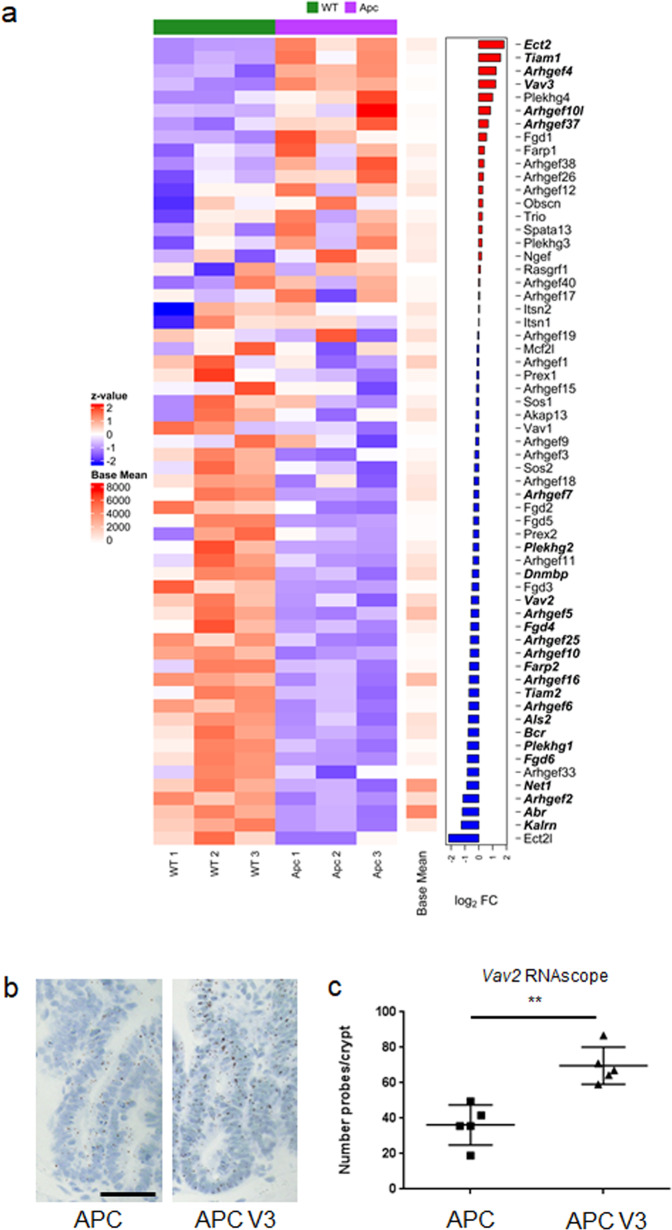
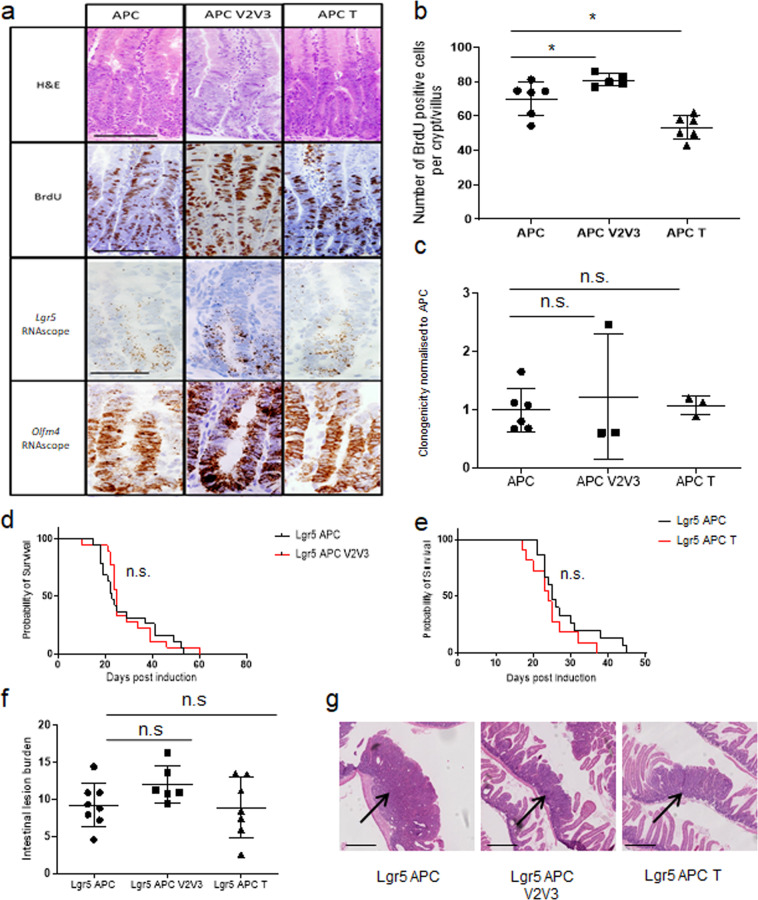
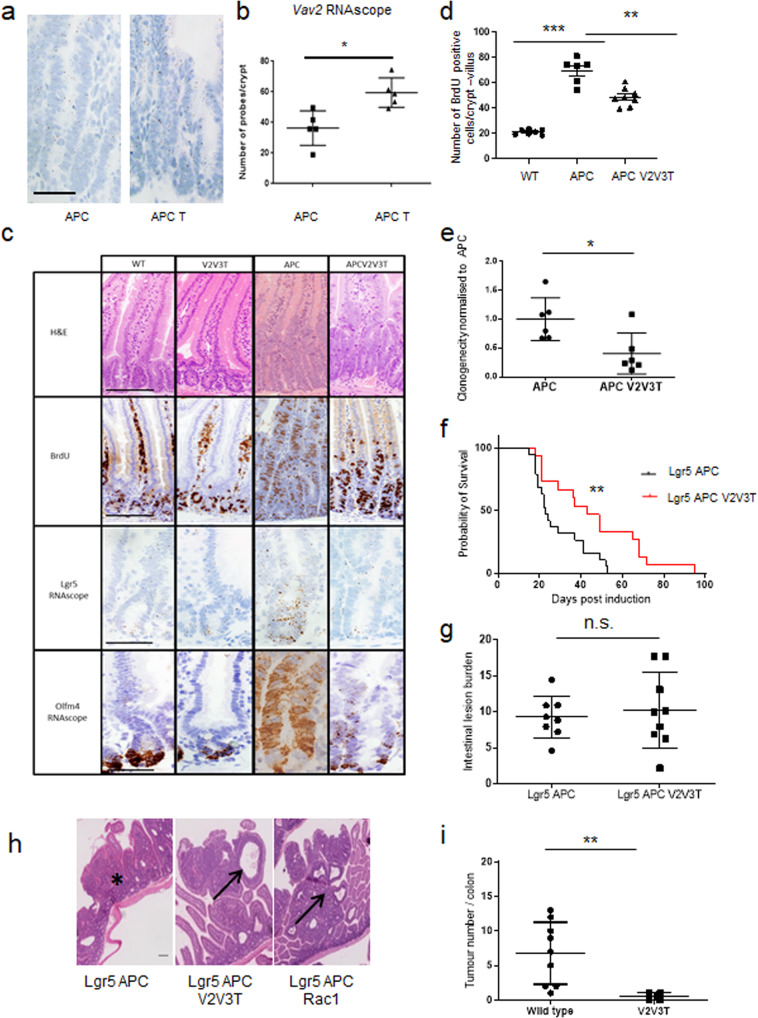
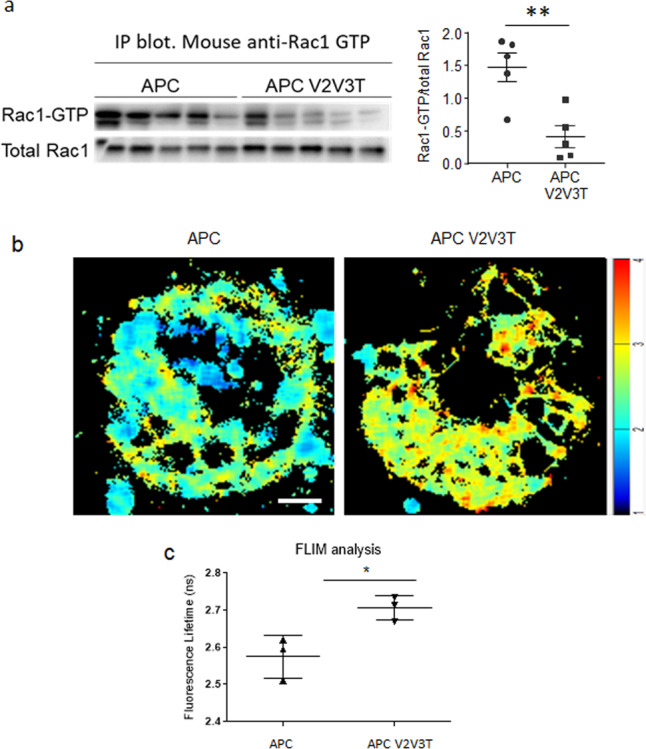
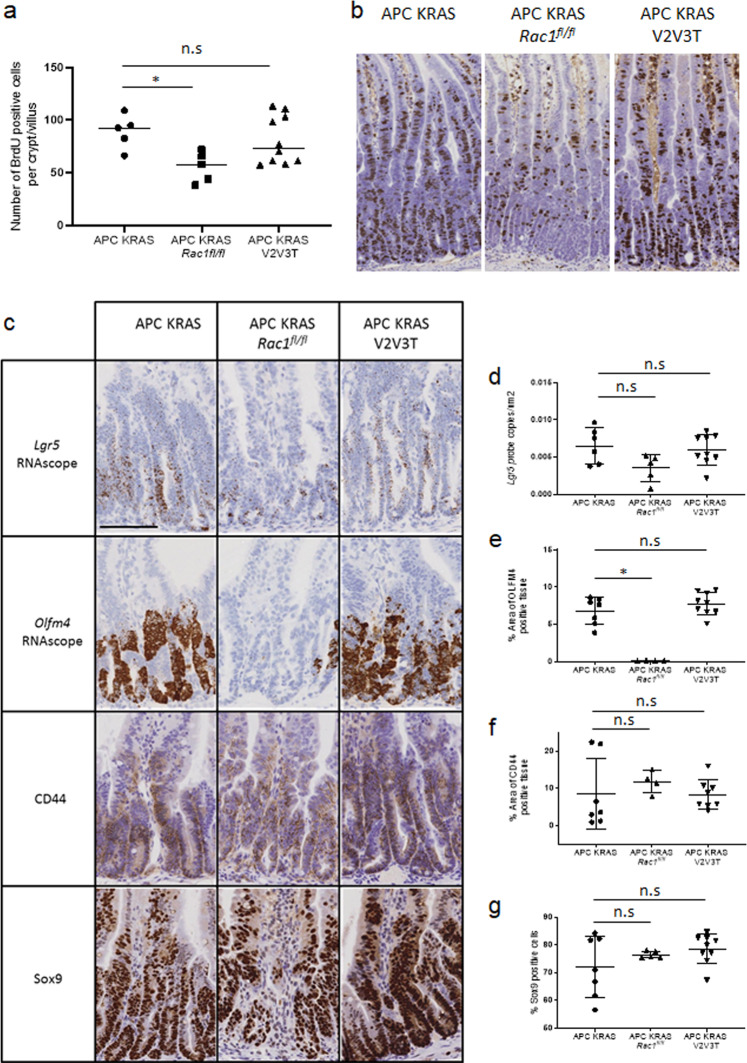
RAC1 activity is critical for intestinal homeostasis, and is required for hyperproliferation driven by loss of the tumour suppressor gene Apc in the murine intestine. To avoid the impact of direct targeting upon homeostasis, we reasoned that indirect targeting of RAC1 via RAC-GEFs might be effective. Transcriptional profiling of Apc deficient intestinal tissue identified Vav3 and Tiam1 as key targets. Deletion of these indicated that while TIAM1 deficiency could suppress Apc-driven hyperproliferation, it had no impact upon tumourigenesis, while VAV3 deficiency had no effect. Intriguingly, deletion of either gene resulted in upregulation of Vav2, with subsequent targeting of all three (Vav2-/- Vav3-/- Tiam1-/-), profoundly suppressing hyperproliferation, tumourigenesis and RAC1 activity, without impacting normal homeostasis. Critically, the observed RAC-GEF dependency was negated by oncogenic KRAS mutation. Together, these data demonstrate that while targeting RAC-GEF molecules may have therapeutic impact at early stages, this benefit may be lost in late stage disease.


Conflict of interest statement

The authors declare no competing interests.

Figures

Fig. 1
Fig. 1. Loss of Rac1 perturbs villus homeostasis.
a Images showing H&E, BrdU incorporation and Cleaved caspase-3 IHC in Vil-CreERT2 (wild-type), Vil-CreERT2 Rac1fl/fl (Rac1fl/fl) mice day 3 post induction and Vil-CreERT2 Rac1fl/fl (Rac1fl/fl) mice 3 and 5 days post induction. Red arrow indicates disintegrating villus. Scale bar represents 100 μm in each case (See amplified images in Supplementary Fig. 1d–f). b Scanning EM on Vil-CreERT2 (Wild-type) or Vil-CreERT2 Rac1fl/fl (Rac1fl/fl) intestines 4 days post induction. Red arrows indicate rounded, blebbing cells. Scale bar represents 100 μm in the upper panels and 50 μm in the lower panels. c Vil-CreERT2 driving expression of LifeAct-GFP in wild-type and Rac1fl/fl intestines 4 days post induction. Scale bar represents 50 μm.
Fig. 2
Fig. 2. VAV3 and TIAM1 are upregulated following APC loss.
a Heatmap derived from RNA-seq analysis comparing whole tissue from wild-type (Vil-CreERT2) and APC intestines (Vil-CreERT2 Apcfl/fl) n = 3 biologically independent animals for both APC and WT intestinal tissue. Log2FC of GEF expression displayed on the right, genes significantly deregulated displayed in bold (FDR < 0.05) displayed in bold. b RNAscope of Vav2 in the intestinal epithelium of Vil-CreERT2 Apcfl/fl (APC) and Vil-CreERT2 Apcfl/fl, Vav3−/− (APC V3) mice, Scale bar represents 100 μm. c Quantification of Vav2 RNAscope from Vil-CreERT2 Apcfl/fl and Vil-CreERT2 Apcfl/fl Vav3−/− intestines. N = 5 biologically independent animals for each genotype. P = 0.0079 as determined by a two-tailed Mann–Whitney test. Data are presented as mean values ±SD.
Fig. 3
Fig. 3. Loss of a single or double GEF is unable to rescue the Apcfl/fl phenotype.
a H&E, BrdU incorporation and RNAscope for Lgr5 and Olfm4 on Vil-CreERT2 Apcfl/fl (APC), Vil-CreERT2 Apcfl/fl, Vav2−/−, Vav3−/− (APC V2V3) and Vil-CreERT2 Apcfl/fl Tiam1−/− (APC T). Scale bar represents 100 μm for H&E and BrdU and 50 μm for RNAscope images. b Quantification of BrdU positive cells. N = 6, 5 and 6 biologically independent animals for Vil-CreERT2 Apcfl/fl (APC), Vil-CreERT2 Apcfl/fl, Vav2−/−, Vav3−/− (APC V2V3; p = 0. 0303 as determined by a two-tailed Mann–Whitney) and Vil-CreERT2 Apcfl/fl Tiam1−/− (APC T; *p = 0.0260, as determined by a two-tailed Mann–Whitney) respectively. Data are presented as mean values ±SD. c Quantification of clonogenicity assay of intestinal organoids. N = 6, 3 and 3 biologically independent animals for Vil-CreERT2 Apcfl/fl (APC), Vil-CreERT2 Apcfl/fl, Vav2−/−, Vav3−/− (APC V2V3; p = 0.5476, as determined by a two-tailed Mann–Whitney) and Vil-CreERT2 Apcfl/fl Tiam1−/− (APC T) respectively (p = 0.5476, as determined by a two-tailed Mann–Whitney). Data are presented as mean values ±SD. d, e Survival of Lgr5-EGFP-IRES-creERT2 Apcfl/fl (Lgr5 APC), Lgr5-EGFP-IRES-creERT2 Apcfl/fl Vav2−/−, Vav3−/− (Lgr5 APC V2V3) and Lgr5-EGFP-IRES-creERT2 Apcfl/fl Tiam1−/− (Lgr5 APC T). d N = 19 and 18 biologically independent animals for Lgr5 APC and Lgr5 APC V2V3 respectively (p = 0.7142, as determined by Log-rank (Mantel-Cox) test). e N = 15 and 10 biologically independent animals for Lgr5 APC and Lgr5 APC T respectively (under the control of Lgr5-EGFP-IRES-creERT2). (p = 0.1982, as determined by Log-rank (Two-tailed Mantel-Cox test). The same Lgr5 APC control cohort was used in both d and e as well as in Fig. 4f and Supplementary Fig. 6D. f Quantification of intestinal tumour burden following APC loss in the Lgr5 stem cell compartment. Tumour burden is determined as percentage of intestine which is covered by lesion or adenomas. Lgr5-EGFP-IRES-creERT2 Apcfl/fl (APC; n = 9 biologically independent animals) vs Lgr5-EGFP-IRES-creERT2 Apcfl/fl Vav2−/−, Vav3−/− (APC V2V3; n = 6 biologically independent animals) p = >0.9999 as determined by a two-tailed Kruskal–Wallis with Dunn’s multiple comparisons test. Lgr5-EGFP-IRES-creERT2 Apcfl/fl (APC) vs Lgr5-EGFP-IRES-creERT2 Apcfl/fl Tiam1−/− (APC T; n = 7 biologically independent animals), p = 0.7532 as determined by a two-tailed Kruskal–Wallis with Dunn’s multiple comparisons test. Data are presented as mean values ±SD. g Solid adenomas (H&E) were observed in each genotype, indicated by the arrow. Scale bar represents 500 μm.
Fig. 4
Fig. 4. Loss of three GEFs is able to suppress the loss of Apc phenotype.
a RNAscope staining for Vav2 in intestine from Vil-CreERT2 Apcfl/fl (APC) and Vil-CreERT2 Apcfl/fl Tiam1−/− (APC T) intestines. Scale bar represents 100 μm. b Quantification of Vav2 RNAscope in Vil-CreERT2 Apcfl/fl (APC) and Vil-CreERT2 Apcfl/fl Tiam1−/− (APC T) intestines. N = 5 biologically independent animals for each genotype *p = 0.0159 as determined by a two-tailed Mann–Whitney test. Data are presented as mean values ±SD. c Images for H&E and BrdU incorporation and RNAscope for Lgr5 and Olfm4 on wild-type (WT), Vav2−/−, Vav3−/ Tiam1−/− (V2V3T), Vil-CreERT2 Apcfl/fl (APC) and Vil-CreERT2 Apcfl/fl, Vav2−/− and Vav3−/−Tiam1−/− (APC V2V3T). Scale bar represents 100 μm for H&E and BrdU and 50 μm for RNAscope images. d Quantification of BrdU positive cells. N = 7, 6 and 8 biologically independent animals for wild-type, Vil-CreERT2 Apcfl/fl (APC) and Vil-CreERT2 Apcfl/fl, Vav2−/− and Vav3−/− Tiam1−/− (APC V2V3T) respectively. WT vs APC ***p = 0.0006, APC vs APC V2V3T *p = 0.0013 as determined by a one-tailed Mann–Whitney test. Control data (APC) as in Fig. 3c. Data are presented as mean values ±SD. e Quantification of clonogenicity assay of intestinal organoids. N = 6 biologically independent cell lines for both Vil-CreERT2 Apcfl/fl (APC) and Vil-CreERT2 Apcfl/fl, Vav2−/−, Vav3−/− Tiam1−/− (APC V2V3T). *p = 0.0260 as determined by a two-tailed Mann–Whitney test. f Compared to Lgr5-EGFP-IRES-creERT2 Apcfl/fl (Lgr5 APC), Lgr5-EGFP-IRES-creERT2 Apcfl/fl Vav2−/−, Vav3−/− Tiam1−/− (Lgr5 APC V2V3T) mice have a significant survival advantage. N = 19 and 15 biologically independent animals for Lgr5 APC and Lgr5 APC V2V3T respectively. **p = 0.0091 as determined by a two-tailed Log-rank (Mantel-Cox) test. Lgr5 APC control cohort is the same cohort as used in Fig. 3d, e as well as Supplementary Fig. 6D. Data are presented as mean values ±SD. g Quantification of intestinal tumour burden at clinical endpoint following APC loss in the Lgr5 stem cell compartment. N = 8 and 9 biologically independent animals for Lgr5-EGFP-IRES-creERT2 Apcfl/fl (Lgr5 APC) and Lgr5-EGFP-IRES-creERT2 Apcfl/fl Vav2−/−, Vav3−/− Tiam1−/− (Lgr5 APC V2V3T) respectively. p = 0.9522 as determined by a two-tailed Mann–Whitney test. Data are presented as mean values ±SD. h Solid adenomas (asterisk) were observed in the Lgr5-EGFP-IRES-creERT2 Apcfl/fl (Lgr5 APC) cohort, whereas cystic adenomas were observed (H&E) in Lgr5-EGFP-IRES-creERT2 Apcfl/fl Vav2−/−, Vav3−/− Tiam1−/− (Lgr5 APC V2V3T) and Lgr5-EGFP-IRES-creERT2 Apcfl/fl, Rac1fl/fl (Lgr5 APC Rac1), as indicated by arrows. Scale bar represents 100 μm. i Intestinal tumour number in an AOM-DSS colitis-associated model of tumourigenesis. Study was carried out on wild-type mice or Vav2−/−, Vav3−/− Tiam1−/− mice. N = 9 and 4 biologically independent animals for wild-type or Vav2−/−, Vav3−/− Tiam1−/− respectively. **p = 0.0042 as determined by a one-tailed Mann–Whitney Test. Data are presented as mean values ±SD.
Fig. 5
Fig. 5. Loss of the triple GEFs results in a downregulation of junctional RAC1 activity.
a Immunoprecipitation of Active RAC1 from intestinal epithelium, blotted with total RAC1 and the corresponding scoring. n = 3 biologically independent samples for Vil-CreERT2 Apcfl/fl (APC) and Vil-CreERT2 Apcfl/fl, Vav2−/−, Vav3−/− Tiam1−/− (APC V2V3T). *p = 0.00799 as determined by a one-tailed Mann–Whitney test. Data are presented as mean values ±SD. b FLIM-FRET analysis of organoids day 3 post isolation from Vil-CreERT2 Apcfl/fl (APC) and Vil-CreERT2 Apcfl/fl Vav2−/−, Vav3−/−, Tiam1−/− (APC V2V3T) Scale bar represents 20 μm. c Quantification of FLIM-FRET analysis at cell–cell contacts. N = 3 biologically independent cell lines derived from independent mice for each genotype. *p = 0.0426 as determined a two-tailed unpaired T-test. Data are presented as mean values ±SD.
Fig. 6
Fig. 6. Oncogenic mutation of KRAS drives resistance to RAC-GEF depletion.
a Quantification of BrdU positive cells. N = 5, 5 and 10 biologically independent animals for Vil-CreERT2 Apcfl/fl KRasG12D (APC KRAS), Vil-CreERT2 Apcfl/fl, KRasG12D, Rac1fl/fl (APC KRAS Rac1fl/fl) and Vil-CreERT2 Apcfl/fl, KRasG12D, Vav2−/−, and Vav3−/− Tiam1−/− (APC KRAS V2V3T) respectively. APC KRAS vs APC KRAS Rac1fl/fl p = 0.0461 APC KRAS vs APC KRAS V2V3 p = 0.9363 as determined by a two-tailed Kruskal–Wallis statistical analysis with Dunn’s mutltiple comparisons test (under the control of Vil-CreERT2). Data are presented as mean values ±SD. b Representative images for BrdU incorporation of Vil-CreERT2 Apcfl/fl KRasG12D (APC KRAS), Vil-CreERT2 Apcfl/fl, KRasG12D, Rac1fl/fl (APC KRas Rac1fl/fl) and Vil-CreERT2 Apcfl/fl, KRasG12D, Vav2−/− and Vav3−/− Tiam1−/− (APC KRAS V2V3T). Scale bar represents 100 µm. c Representative images of RNAscope for Lgr5 and Olfn4 and IHC for CD44 and SOX9 Vil-CreERT2 Apcfl/fl KRasG12D (APC KRAS), Vil-CreERT2 Apcfl/fl, KRasG12D, Rac1fl/fl (APC KRAS Rac1fl/fl) and Vil-CreERT2 Apcfl/fl, KRasG12D, Vav2−/− and Vav3−/− Tiam1−/− (APC KRAS V2V3T). Scale bar represents 100 µm. d Quantification of Lgr5 RNAscope. Vil-CreERT2 Apcfl/fl KRasG12D (APC KRAS vs Vil-CreERT2 Apcfl/fl, KRasG12D, Rac1fl/fl (APC KRAS Rac1fl/fl) p = 0.1105 APC KRAS vs Vil-CreERT2 Apcfl/fl, KRasG12D, Vav2−/−, Vav3−/− Tiam1−/− (APC KRAS V2V3T). n = 6, 5 and 8 biologically independent animals for APC KRAS, APC KRAS Rac1fl/fl, and APC KRAS V2V3T respectively. p = >0.999 as determined by a two-tailed Kruskal–Wallis statistical analysis with Dunn’s mutltiple comparisons test (under the control of Vil-CreERT2). Data are presented as mean values ±SD. e Quantification of Olfm4 RNAscope. Vil-CreERT2 Apcfl/fl KRasG12D (APC KRAS) vs Vil-CreERT2 Apcfl/fl, KRasG12D, Rac1fl/fl (APC KRAS Rac1fl/fl) p = 0.356 APC KRAS vs Vil-CreERT2 Apcfl/fl, KRasG12D, Vav2−/−, Vav3−/− Tiam1−/− (APC KRAS V2V3T). n = 6, 4 and 9 biologically independent animals for APC KRAS, APC KRAS Rac1fl/fl and APC KRAS V2V3T respectively. p = 0.9381 as determined by a two-tailed Kruskal–Wallis statistical analysis with Dunn’s mutltiple comparisons test (under the control of Vil-CreERT2). Data are presented as mean values ±SD. f Quantification of CD44 IHC. Vil-CreERT2 Apcfl/fl KRasG12D (APC KRAS) vs Vil-CreERT2 Apcfl/fl, KRasG12D, Rac1fl/fl (APC KRAS Rac1fl/fl) p = 0.2061 APC KRAS vs Vil-CreERT2 Apcfl/fl, KRasG12D, Vav2−/−, Vav3−/− Tiam1−/− (APC KRAS V2V3T). n = 7, 4 and 8 biologically independent animals for APC KRAS, APC KRAS Rac1fl/fl and APC KRAS V2V3T respectively. p = >0.999 as determined by a two-tailed Kruskal–Wallis statistical analysis with Dunn’s mutltiple comparisons test (under the control of Vil-CreERT2). Data are presented as mean values ±SD. g Quantification of SOX9 IHC. Vil-CreERT2 Apcfl/fl KRasG12D (APC KRAS) vs Vil-CreERT2 Apcfl/fl, KRasG12D, Rac1fl/fl (APC KRAS Rac1fl/fl) p = >0.999 APC KRAS vs Vil-CreERT2 Apcfl/fl, KRasG12D, Vav2−/−, Vav3−/− Tiam1−/− (APC KRAS V2V3T). n = 7, 5 and 9 biologically independent animals for APC KRAS, APC KRAS Rac1fl/fl and APC KRAS V2V3T respectively p = 0.4088 as determined by a two-tailed Kruskal–Wallis statistical analysis with Dunn’s mutltiple comparisons test (under the control of Vil-CreERT2). Data are presented as mean values ±SD.

References

    1. Aznar S, Lacal JC. Rho signals to cell growth and apoptosis. Cancer Lett. 2001;165:1–10. doi: 10.1016/S0304-3835(01)00412-8. - DOI - PubMed
    1. Hanna S, El-Sibai M. Signaling networks of Rho GTPases in cell motility. Cell Signal. 2013;25:1955–61.. doi: 10.1016/j.cellsig.2013.04.009. - DOI - PubMed
    1. Ridley AJ, et al. The small GTP-binding protein rac regulates growth factor-induced membrane ruffling. Cell. 1992;70:401–410. doi: 10.1016/0092-8674(92)90164-8. - DOI - PubMed
    1. Nobes CD, Hall A. Rho. Rac and CDC42 GTPases regulate the assembly of multimolecular focal complexes associated with actin stress fibers, lamellipodia, and filopodia. Cell. 1995;81:53–62. doi: 10.1016/0092-8674(95)90370-4. - DOI - PubMed
    1. Sander EE, Collard ,JC. Rho-like GTPases: their role in epithelial cell-cell adhesion and invasion. Eur. J. Cancer. 1999;35:1302–1308. doi: 10.1016/S0959-8049(99)00145-8. - DOI - PubMed

Publication types

MeSH terms

Substances