. 2021 Jan 4;12(1):20.
doi: 10.1038/s41467-020-20208-x.

The ATM and ATR kinases regulate centrosome clustering and tumor recurrence by targeting KIFC1 phosphorylation

Affiliations

The ATM and ATR kinases regulate centrosome clustering and tumor recurrence by targeting KIFC1 phosphorylation

Guangjian Fan et al. Nat Commun. .

Abstract

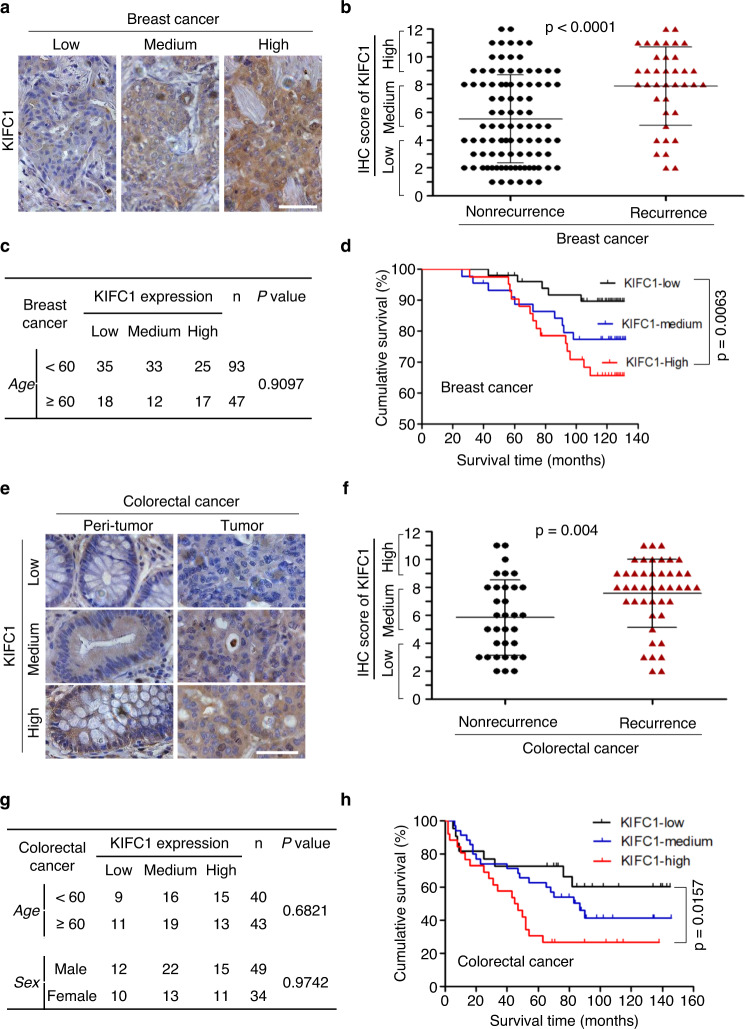
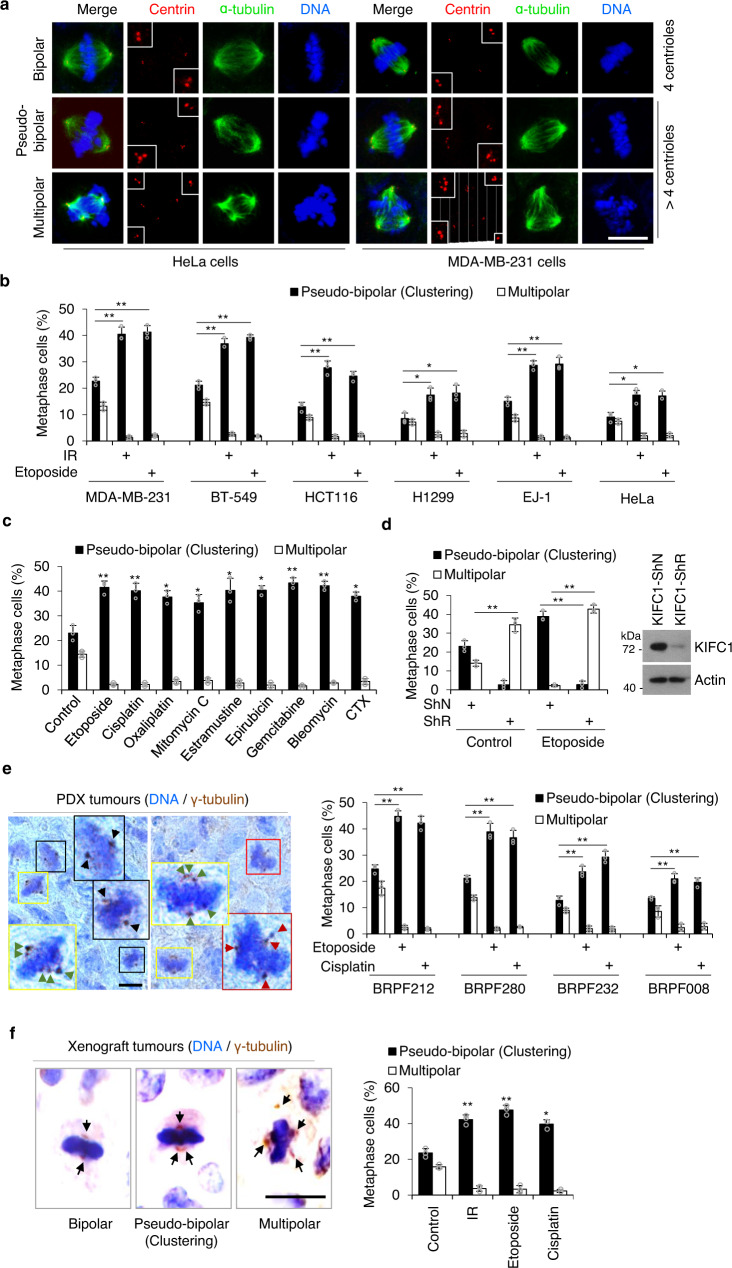
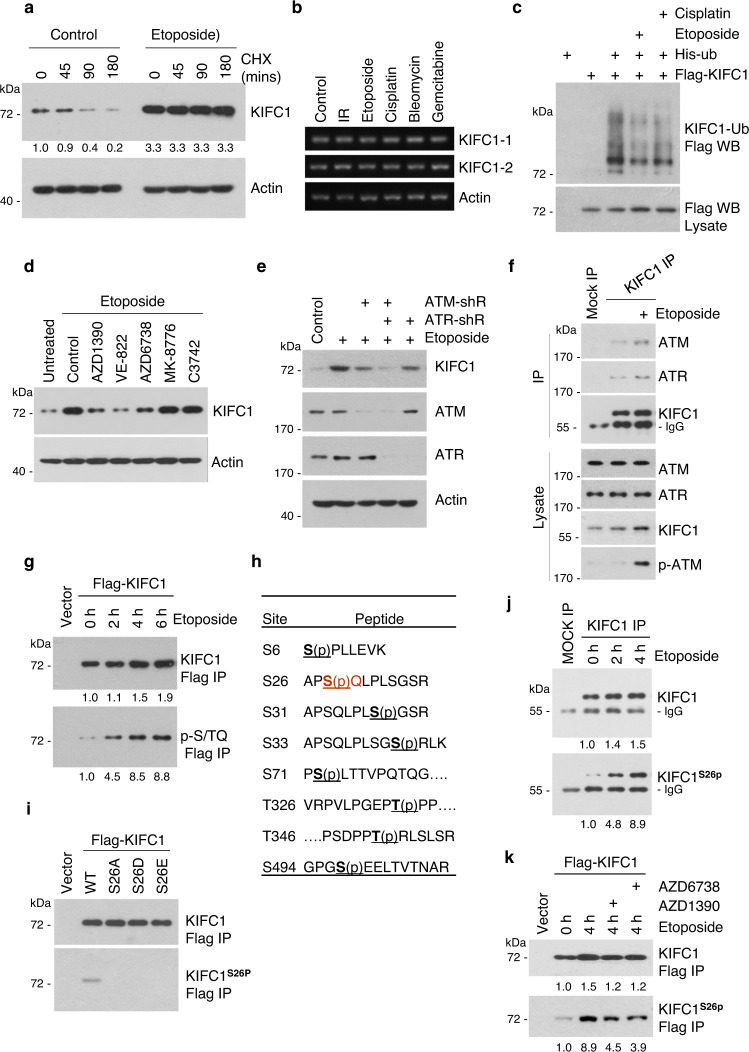
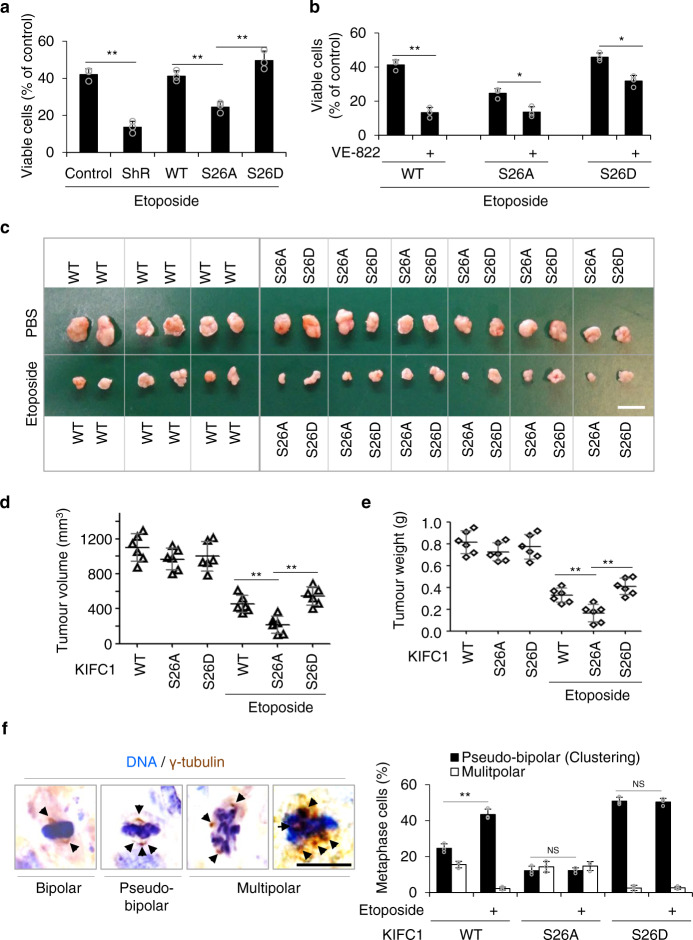
Drug resistance and tumor recurrence are major challenges in cancer treatment. Cancer cells often display centrosome amplification. To maintain survival, cancer cells achieve bipolar division by clustering supernumerary centrosomes. Targeting centrosome clustering is therefore considered a promising therapeutic strategy. However, the regulatory mechanisms of centrosome clustering remain unclear. Here we report that KIFC1, a centrosome clustering regulator, is positively associated with tumor recurrence. Under DNA damaging treatments, the ATM and ATR kinases phosphorylate KIFC1 at Ser26 to selectively maintain the survival of cancer cells with amplified centrosomes via centrosome clustering, leading to drug resistance and tumor recurrence. Inhibition of KIFC1 phosphorylation represses centrosome clustering and tumor recurrence. This study identified KIFC1 as a prognostic tumor recurrence marker, and revealed that tumors can acquire therapeutic resistance and recurrence via triggering centrosome clustering under DNA damage stresses, suggesting that blocking KIFC1 phosphorylation may open a new vista for cancer therapy.


Conflict of interest statement

The authors declare no competing interests.

Figures

Fig. 1
Fig. 1. KIFC1 predicts human tumor recurrence.
The correlation of KIFC1 protein expression and tumor recurrence or poor prognosis in breast cancer (n = 140, ad) or colorectal cancer (n = 83, eh) tissue chips. a, b, e, f Data are representative of the KIFC1 stained tumor or adjacent non-tumor tissues (a, e) (scale bar, 50 μm) with quantitative analysis of clinical samples of tumor recurrence or non-recurrence (b, f). KIFC1 expression was classified as high, medium, or low according to the staining signals. Two-tailed t test p values: p = <0.00001 (b). c, d, g, h The tables show the relative levels of KIFC1 expression with patient age or gender in breast cancers (c) or colorectal cancers (g). Kaplan–Meier plot of overall survival of patients with breast cancer (d) or colorectal cancer (h) stratified by the KIFC1 expression level. A log-rank test was used for statistical analysis. All data presented in this figure show mean values ± SD. Statistical significance was determined by Two-tailed t test. Source data are provided as a Source Data file.
Fig. 2
Fig. 2. DNA-damaging treatments induce the centrosome clustering protein KIFC1.
a KIFC1 protein expression in PDX models after treatment with PBS, etoposide, or cisplatin. Data are representative of stained tumor tissues (scale bar, 50 μm) with quantitative analysis. Two-tailed t test p values: p = 0.04721 (BRPF008, Eto), 0.0339 (008, Cis), 0.0350 (212, Eto), 0.0390 (212, Cis), 0.0341 (232, Eto), 0.0202 (232, Cis), 0.0263 (280, Eto), and 0.0130 (280, Cis). (b, c) MDA-MB-231 cells (b) or indicated cells (c) were treated with irradiation (IR), ultraviolet (UV) light, etoposide (10 μM), cisplatin (10 μM), oxaliplatin (40 μM), mitomycin C (2 μM), estramustine (20 μM), epirubicin (0.5 μM), gemcitabine (4 μM), bleomycin (10 μM), or cyclophosphamide (CTX, 10 mM) for 15 h. Cell lysates were immunoblotted with antibodies against KIFC1, γH2AX, or β-actin (as the internal standard). d MDA-MB-231 xenograft tumors were treated with etoposide, IR, or cisplatin as described in the Methods section. Data are representative of stained tumor tissues (scale bar, 50 μm) with quantitative analysis. Three tumors were included in each group. Two-tailed t test p values: p = 0.0424 (Eto), 0.0345 (IR), and 0.0415 (Cis). Data represent the mean ± SD of three independent experiments (a, d). *p < 0.05, **p < 0.01, Source data are provided as a Source Data file.
Fig. 3
Fig. 3. DNA-damaging treatments induce KIFC1-dependent centrosome clustering.
a Representative images showing bipolar (4 normal centrioles), pseudo-bipolar (centrosome clustering, >4 centrioles), and multipolar mitosis (non-efficient centrosome clustering, >4 centrioles) in HeLa and MDA-MB-231 cells. Spindle poles, centrioles, and DNA were co-stained with α-tubulin, centrin, and 4′,6-diamidino-2-phenylindole (DAPI). Insets show magnification of the centriole area. Scale bar, 10 μm. bd Histogram showing the percentage of pseudo-bipolar mitosis (centrosome clustering) and multipolar mitosis (non-efficient centrosome clustering) in the indicated cancer cells (b) or MDA-MB-231 cells (c, d) in response to IR, etoposide (5 μM), or the indicated agents for 15 h. b Two-tailed t test p values: p = (MB-231) 0.0086 (Eto), 0.0072 (IR); (BT-549) 0.0074 (Eto), 0.0025 (IR); (HCT116) 0.0068 (Eto), 0.0085 (IR); (H1299) 0.0317 (Eto), 0.0372 (IR); (EJ-1) 0.0066 (Eto), 0.0024 (IR); and (HeLa) 0.0412 (Eto), 0.0305 (IR). c T test p values (from left to right): p = 0.0021, 0.0096, 0.0118, 0.0229, 0.0148, 0.0255, 0.0070, 0.0075, and 0.0276. d T test p values (from left to right): p = 0.0028, 0.0050, and 0.0012. (d) MDA-MB-231 cells were infected with shN or KIFC1-shR virus for 48 h. Representative western blots show the knockdown efficiencies of KIFC1. e, f Tissue sections of PDX models (e) or MDA-MB-231 xenograft tumors (f) were stained with γ-tubulin antibody. DNA was stained with hematoxylin. Representative images showed bipolar (black box), pseudo-bipolar (centrosome clustering, yellow box), and multipolar mitosis (red box) in tissue sections (scale bar, 10 μm). The boxed enlargements showed centrosomes in cells. Histogram showing the percentage of centrosome clustering in tumor sections. e T test p values (from left to right): p = 0.0015, 0.0047, 0.0092, 0.0099, 0.0071, 0.0088, 0.0096, and 0.0064. f T test p values (from left to right): p = 0.0049, 0.0098, and 0.0143. Statictical data presented in this figure show mean values ± SD of three times of independent experiments. Statistical significance was determined by Two-tailed t test. *p < 0.05, **p < 0.01, Source data are provided as a Source Data file.
Fig. 4
Fig. 4. ATM and ATR kinases phosphorylate KIFC1-S26 during DNA-damage conditions.
a, b MDA-MB-231 cells were treated with IR or indicated agents for 15 h. The protein and mRNA levels of endogenous KIFC1 and β-actin (as the internal standard) were examined by western blotting (a) and reverse transcription–PCR (b). The data are representative of two independent experiments. a Cycloheximide (CHX, 50 μm mL−1) was added in cells for the indicated time prior to lysis. Relative KIFC1 band intensities were quantified using densitometry and presented. (c) 293 T cells transfected with His-ubiquitin and Flag-KIFC1 plasmids were treated with etoposide (20 μM) or cisplatin (20 μM) for 6 h. MG132 (25 μM) was added for 3 h prior to lysis. Ubiquitinated proteins were precipitated using Ni-NTA beads. KIFC1 ubiquitination was detected by western blot using anti-Flag antibody. d, e MDA-MB-231 cell lysates were immunoblotted with antibodies against KIFC1, ATM, ATR, or β-actin (as the internal standard). d The cells were pretreated with AZD1390 (20 nM), VE-822 (5 μM), AZD6738 (25 nM), MK-8776 (5 μM), or C3742 (10 μM) for 1 h, and then treated with etoposide and these inhibitors for another 15 h. e Cells were infected with shN (Control), ATM-shR, or ATR-shR lentivirus for 72 h and then treated with etoposide for another 15 h. f, j MDA-MB-231 cells were treated with etoposide (20 μM) for 2 h (j) or 4 h (f, j). Endogenous KIFC1 was precipitated using anti-KIFC1 antibody or with IgG (Mock IP), and the precipitated proteins were analyzed by western blotting using the antibody against KIFC1, ATM, ATR, p-ATM (S1981), or KIFC1S26p. g 293T cells transfected with Flag-KIFC1 plasmids were treated with or without etoposide (20 μM) for the indicated time, followed by immunoprecipitation with FLAG-M2 beads. The samples were immunoblotted with antibodies against Flag or p-S/TQ (ATM/ATRsub). h Eight phosphorylation sites of KIFC1 were identified by LC-MS/MS analysis using purified KIFC1 from Flag-IP in 293 T cells. i, k Characterization of KIFC1-S26 phosphorylation antibody (KIFC1S26p, produced in our lab). 293T cells were transfected with indicated Flag-KIFC1 plasmids and followed by immunoprecipitation with FLAG-M2 beads. The precipitated proteins were analyzed by western blot KIFC1S26p or Flag antibodies. k 293T cells were pretreated with AZD1390 or AZD6738 for 1 h, and then treated with etoposide and these inhibitors for another 4 h. The western blot images are representative of 2 independent experiments with similar results. Source data are provided as a Source Data file.
Fig. 5
Fig. 5. KIFC1-S26 phosphorylation promotes centrosome clustering.
a Establishment of Flag-tagged KIFC1-WT, S26A, or S26D mutant stable cell lines from MDA-MB-231 cells. Cell lysates were immunoblotted with antibodies against KIFC1 and β-actin (as internal standard). b KIFC1-S26 phosphorylation stabilizes KIFC1 protein level. Western blot analysis of lysates of indicated cell lines treated with cycloheximide (CHX, 50 μm ml−1). Relative KIFC1 band intensities were quantified using densitometry and presented. c 293T cells transfected with His-ubiquitin and Flag-KIFC1 or indicated Flag-KIFC1 mutant plasmids were treated with etoposide (20 μM) for 6 h. MG132 (25 μM) was added for 3 h prior to lysis. Ubiquitinated proteins were precipitated using Ni-NTA beads. KIFC1 ubiquitination was detected by western blot using anti-Flag antibody. The Western Blot images are representative of 2 independent experiments with similar results (ac). df KIFC1-S26 phosphorylation promotes centrosome clustering. Histogram showing the percentage of >2 centrosomes per cell (centrosome amplification) (d), pseudo-bipolar mitosis (centrosome clustering), and multipolar mitosis (non-efficient centrosome clustering) (e, f) in the indicated stable cell lines in response to etoposide (5 μM) for 15 h (df) or 48 h (d). e Representative images showing pseudo-bipolar and multipolar mitosis in indicated cell lines (scale bar, 10 μm). Spindle poles, centrioles, and DNA were co-stained with α-tubulin, centrin, and DAPI. Insets show magnification of the centriole area. f The cells were pretreated with VE-822 (5 μM) for 1 h and then treated with etoposide and VE-822 for another 15 h. d Two-tailed t test p values (from left to right): p = 0.0006, 0.0364, 0.0071, 0.0050, and 0.0441. e Two-tailed t test p values (from left to right): p = 0.0073, 0.0019, 0.0034, 0.1816, and 0.6059. f Two-tailed t test p values (from left to right): p = 0.0088, 0.3163, and 0.4928. Statistical data show mean values ± SD of three independent experiments. NS = not significant, *p < 0.05, **p < 0.01. Source data are provided as a Source Data file.
Fig. 6
Fig. 6. KIFC1-S26 phosphorylation induces drug resistance.
a, cf KIFC1-S26 phosphorylation induces etoposide resistance. b, gj Etoposide-resistance is restrained by ATM/ATR inhibitor VE-822. a, b The indicated stable cell lines were treated with etoposide (0.5 μM) or VE-822 (5 μM) for 4 days, and then were analyzed for cell viability using the MTT assay. Histogram graphs showing the percentage of surviving cells. a Two-tailed t test p values (from left to right): p = 0.0007, 0.0099, and 0.0090. b Two-tailed t test p values (from left to right): p = 0.0005, 0.0110, and 0.0143. c, g Xenograft experiment with KIFC1-WT, S26A, or S26D stable cells was described in the Methods section. Tumors were collected and photographed (scale bar, 2 cm). d, e, h, i Quantification of average tumor volume (d, h) and weight (e, i). Six tumors were included in each group. d Two-tailed t test p values (from left to right): p = 0.0062 and 0.00001. (e) Two-tailed t test p values: p = 0.0099 and 0.00001. h Two-tailed t test p values: p = 0.0053 and 0.0016. i Two-tailed t test p values: p = 0.0057 and 0.0016. f, j Representative immunohistochemical images showing γ-tubulin staining (scale bar, 10 μm) with quantitative analysis of pseudo-bipolar (centrosome clustering) and multipolar mitosis of the tumor sections of xenograft tumor samples after treatment with etoposide or VE-822. Arrows point to the centrosomes. For each experimental condition, 100–161 cells were counted, and three independent experiments were performed. f Two-tailed t test p values: p = 0.0016, 0.9245, and 0.5663. j Two-tailed t test p values: p = 0.0006 and 0.0092. Data represent the mean ± SD of three times of independent experiments. NS = not significant, *p < 0.05, **p < 0.01, Source data are provided as a Source Data file.
Fig. 7
Fig. 7. KIFC1-S26 phosphorylation induces chromosomal instability.
a Representative images showing lagging chromosomes induced by centrosome clustering in the MDA-MB-231 stable cell lines. The cells were pretreated with VE-822 for 1 h, and then treated with etoposide (2 μM) for another 15 h. Spindle and DNA were co-stained with DAPI and α-tubulin. In quantitative analysis, anaphase cells with lagging chromosomes induced by centrosome clustering were compared with all anaphase cells. For each experimental condition, 100–110 cells were counted, and three independent experiments were performed. Scale bar, 10 μm. Two-tailed t test p values (from left to right): p = 0.0115, 0.0030, and 0.0038. b Establishment of KIFC1 WT, S26A, or S26D mutant stable cell lines from MCF-10A cells. Cell lysates were immunoblotted with antibodies against KIFC1 or β-actin (as the internal standard). The Western blot images are representative of two independent experiments with similar results. (c, d) Histogram showing the percentage of >2 centrosomes per cell (centrosome amplification) (c), pseudo-bipolar mitosis (centrosome clustering), and multipolar mitosis (non-efficient centrosome clustering) (d) in the indicated stable cell lines in response to etoposide (5 μM) for 15 h (c, d) or 48 h (c). c Two-tailed t test p values: p = 0.00044, 0.0137, 0.0033, 0.0033, and 0.0023. (d) Two-tailed t test p values: p = 0.0097, and 0.0099. (e, f) The stable cell lines were treated with etoposide (0.1 μM) for 30 generations and then were used to assess the rate of chromosomal instability (CIN). For each experimental condition, 100–120 cells were counted, and three independent experiments were performed. Scale bar, 10 μm. e Representative metaphase plates containing different chromosome numbers with quantitative analysis of chromosome numbers. For each experimental condition, 100–164 cells were counted, and three independent experiments were performed. Two-tailed t test p values (from left to right): p = 0.0278, 0.0078, 0.0098, 0.0079, and 0.0056. f Representative image of the centromeric DNA of chromosomes 3 and 7 obtained by fluorescence in situ hybridization (FISH) analysis with quantitative analysis of chromosome numbers. For each experimental condition, 100–112 cells were counted, and three independent experiments were performed. Two-tailed t test p values (from left to right): p = 0.0027, 0.0037, 0.0086, and 0.0084. Statistical data presented in this figure show mean values ± SD of three times of independent experiments. *p < 0.05; **p < 0.01. Source data are provided as a Source Data file.
Fig. 8
Fig. 8. The ATM/ATR-KIFC1-centrosome clustering pathway promotes tumor recurrence.
a Schematic drawing of tumor recurrence, as described in the Methods section. Xenograft tumors were treated with etoposide alone and in combination with PBS, VE-822, or CW069, and were allowed to grow up to a mean volume of 300 mm3 before being surgically resected. After surgery, the mice were treated with the indicated drugs for another 2 weeks. After 5 months with no drug treatment, mice with tumor recurrence were identified and analyzed. b The time at which the indicated tumors reached 300 mm3. Data represent mean ± SD (n = 10). Two-tailed t test p values (from left to right): p = <0.00001 and <0.00001. c, d KIFC1-S26 phosphorylation promotes CIN in xenograft tumors. The indicated cells were isolated from the surgically resected tumors and then were cultured to assess the rate of CIN in vitro. For each experimental condition, 100–150 cells were counted, and three independent experiments were performed. c The graph shows the fraction of indicated cells with different numbers of chromosomes per cell. For each experimental condition, 100–127 cells were counted, and three independent experiments were performed. Two-tailed t test p values (from left to right): p = 0.0022, 0.0035, 0.0021, and 0.0008. d The graph shows the fraction of the indicated cells stained for centromeric DNA on chromosomes 3 and 7 with FISH analysis. For each experimental condition, 100-124 cells were counted, and three independent experiments were performed. Two-tailed t test p values (from left to right): p = 0.0092 and 0.0077. e Graph depicting the Kaplan-Meier analysis of tumor recurrence in the different groups. Survival cutoff criteria (compassionate euthanasia), when the recurrent tumors impeded ambulation, defecation, urination, or eating. Each group, n = 10. Two-tailed t test p values (from left to right): p = 0.0442 and 0.0291. f Representative images showing local recurrence and distant recurrence (lung metastases). The boxed enlargements showed tumor morphology. Hematoxylin and eosin staining of tumor tissue sections. g, h KIFC1-S26 phosphorylation promotes CIN in the locally recurrent tumors. Recurrence-WT (Rec-WT) and recurrence-S26D (Rec-S26D) cells were isolated from the indicated recurrent tumors and then were re-cultured to assess the rate of CIN in vitro. The untreated cells were MDA-MB-231 cells. Data represent the mean ± SD of three times of independent experiments. For each experimental condition, 100–109 cells were counted, and three independent experiments were carried out. g The graph shows the fraction of indicated cells with different numbers of chromosomes per cell. For each experimental condition, 100–109 cells were counted, and three independent experiments were performed. Two-tailed t test p values (from left to right): p = 0.0022, 0.0031, 0.0079, and 0.0024. h The graph showed the fraction of the indicated cells stained for centromeric DNA on chromosomes 3 and 7 with FISH analysis. For each experimental condition, 100–159 cells were counted, and three independent experiments were performed. Two-tailed t test p values (from left to right): p = 0.0261, 0.0098,0.0047, and 0.0164. *p < 0.05; **p < 0.01. Source data are provided as a Source Data file.

References

    1. Gönczy P. Centrosomes and cancer: revisiting a long-standing relationship. Nat. Rev. Cancer. 2015;15:639–652. doi: 10.1038/nrc3995. - DOI - PubMed
    1. Godinho SA, et al. Oncogene-like induction of cellular invasion from centrosome amplification. Nature. 2014;510:167–171. doi: 10.1038/nature13277. - DOI - PMC - PubMed
    1. Chan JY. A clinical overview of centrosome amplification in human cancers. Int. J. Biol. Sci. 2011;7:1122–1144. doi: 10.7150/ijbs.7.1122. - DOI - PMC - PubMed
    1. Dent R, et al. Triple-negative breast cancer: clinical features and patterns of recurrence. Clin. Cancer Res. 2007;13:4429–4434. doi: 10.1158/1078-0432.CCR-06-3045. - DOI - PubMed
    1. Patel N, et al. Integrated genomics and functional validation identifies malignant cell specific dependencies in triple negative breast cancer. Nat. Commun. 2018;9:1044. doi: 10.1038/s41467-018-03283-z. - DOI - PMC - PubMed

Publication types