. 2021 Jan 4;12(1):87.
doi: 10.1038/s41467-020-20358-y.

Single-cell transcriptome profiling of the vaginal wall in women with severe anterior vaginal prolapse

Affiliations

Single-cell transcriptome profiling of the vaginal wall in women with severe anterior vaginal prolapse

Yaqian Li et al. Nat Commun. .

Abstract

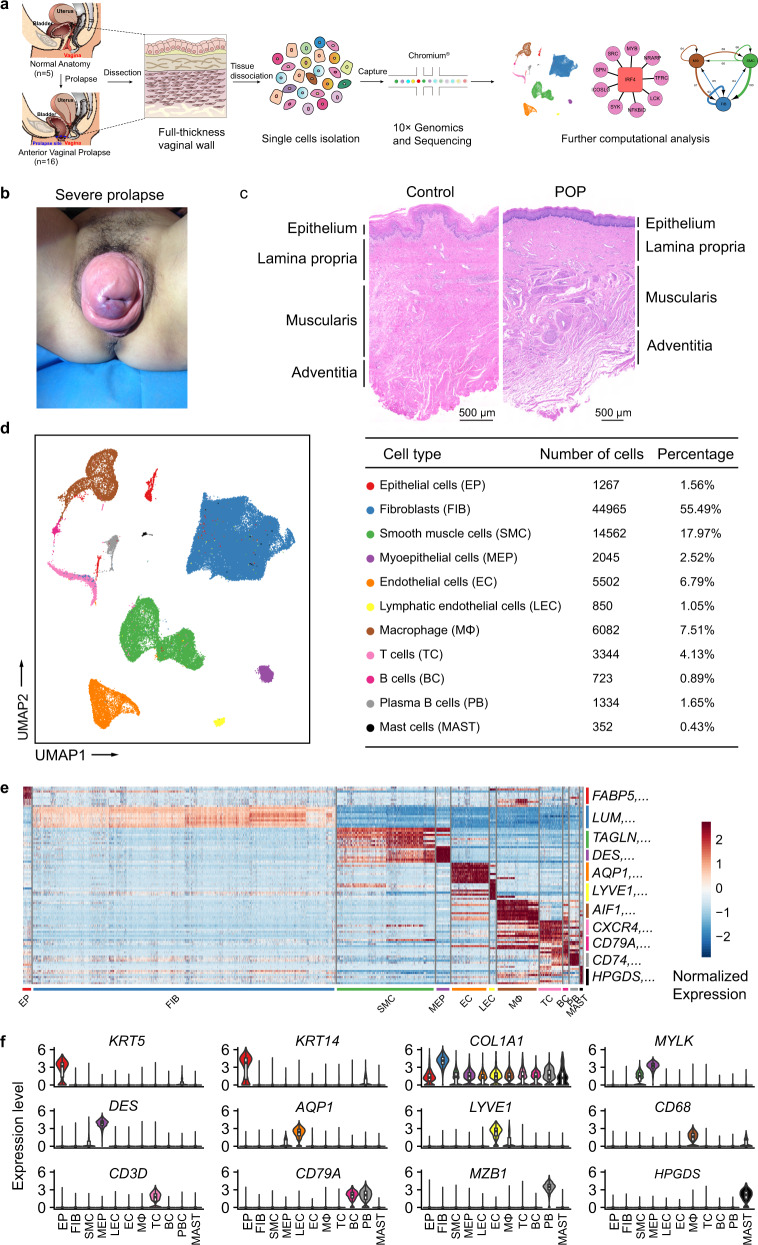
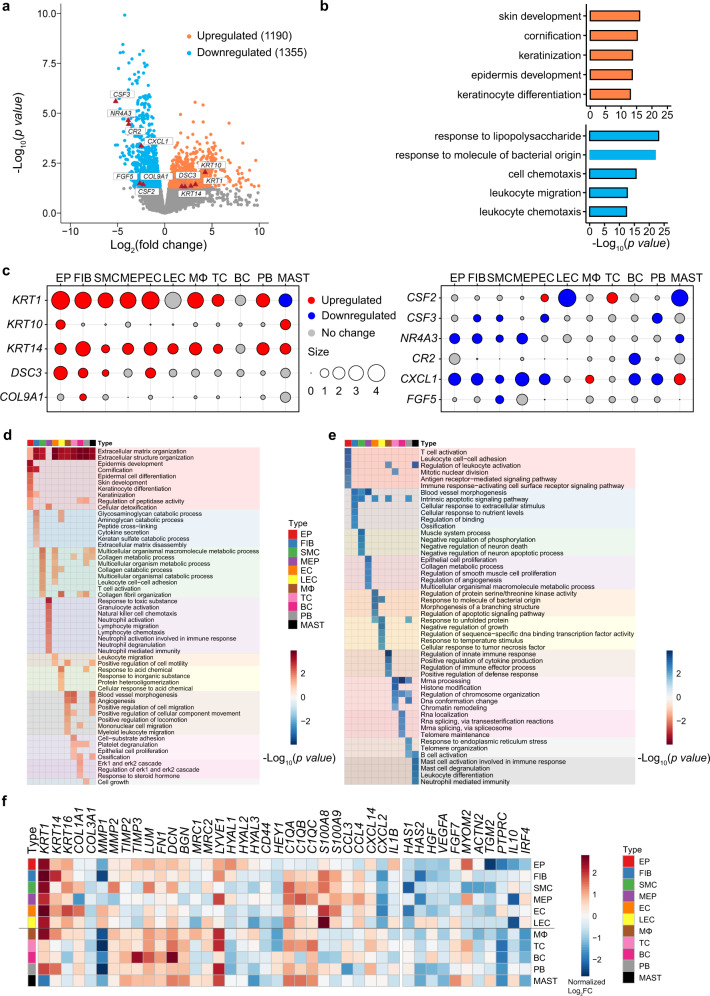
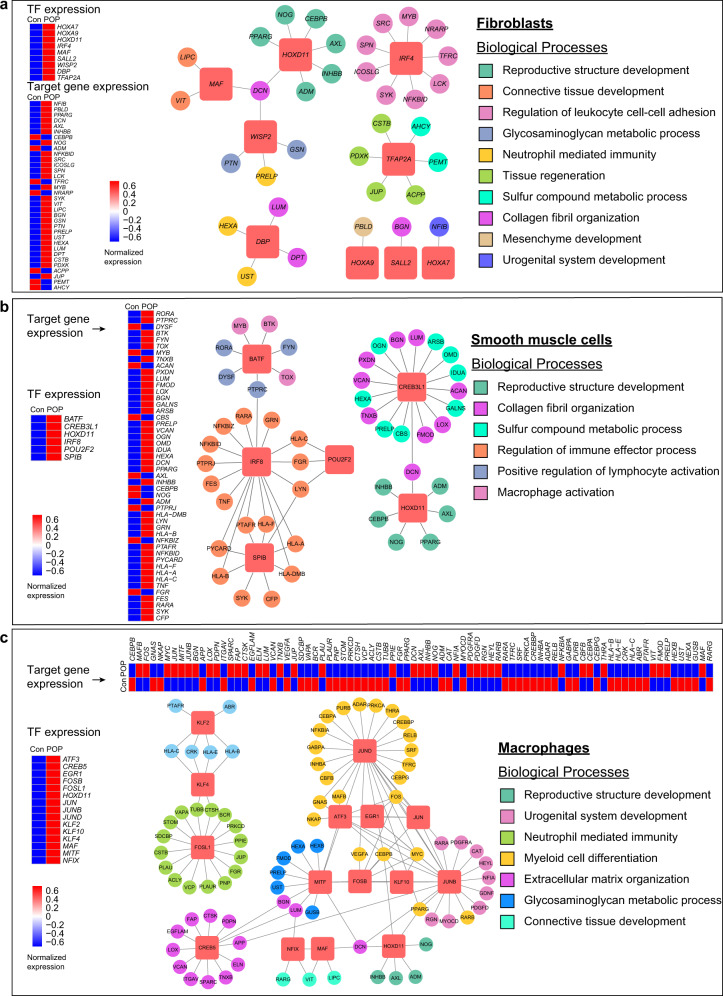
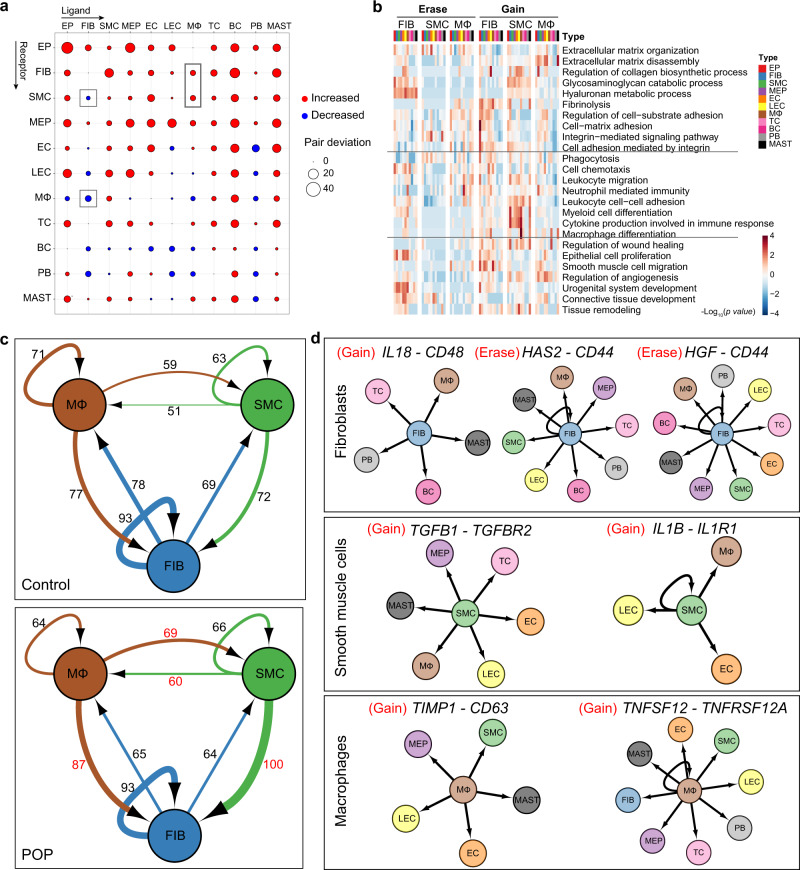
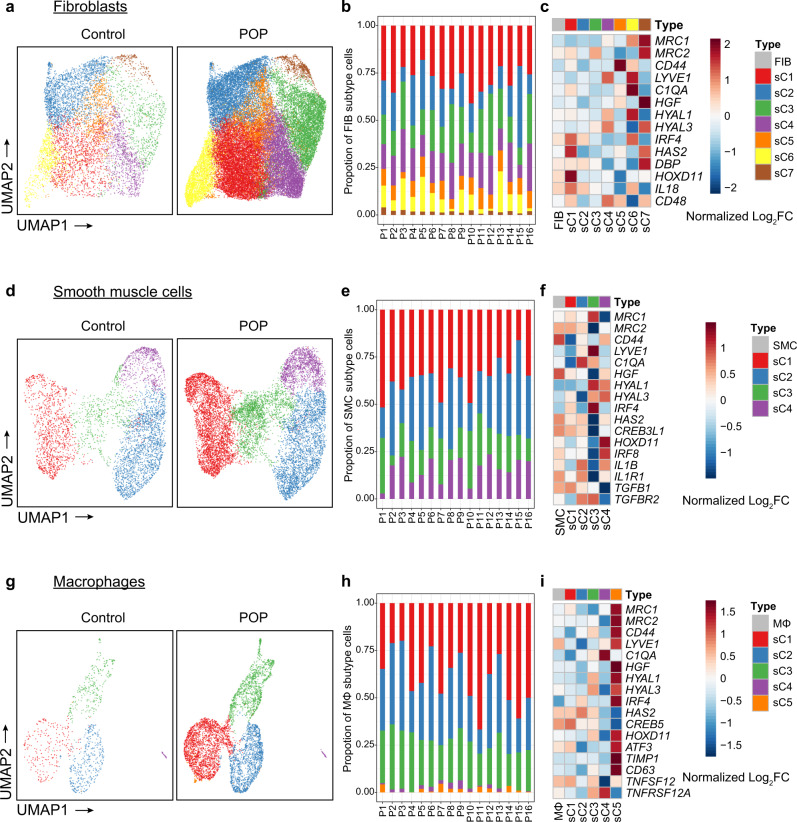
Anterior vaginal prolapse (AVP) is the most common form of pelvic organ prolapse (POP) and has deleterious effects on women's health. Despite recent advances in AVP diagnosis and treatment, a cell atlas of the vaginal wall in AVP has not been constructed. Here, we employ single-cell RNA-seq to construct a transcriptomic atlas of 81,026 individual cells in the vaginal wall from AVP and control samples and identify 11 cell types. We reveal aberrant gene expression in diverse cell types in AVP. Extracellular matrix (ECM) dysregulation and immune reactions involvement are identified in both non-immune and immune cell types. In addition, we find that several transcription factors associated with ECM and immune regulation are activated in AVP. Furthermore, we reveal dysregulated cell-cell communication patterns in AVP. Taken together, this work provides a valuable resource for deciphering the cellular heterogeneity and the molecular mechanisms underlying severe AVP.


Conflict of interest statement

The authors declare no competing interests.

Figures

Fig. 1
Fig. 1. Diverse cell types in the vaginal wall delineated by Single-cell RNA-seq analysis.
a Schematic of tissue dissociation, cell isolation, sequencing, and downstream bioinformatics analysis. b Representative pictures of patients with anterior vaginal prolapse. c Representative H&E staining of the vaginal wall in control and POP samples (control, three patients; POP, four patients). d UMAP plots of the major vaginal wall cell populations. Each point depicts a single cell, colored according to cell types (left). The chart showing the number and percentage of each cell type (right). e Heatmap showing the relative expression of top 10 genes in each cell type. The canonical markers for each cell type are color-coded and shown on the right. f Violin plots displaying the expression of canonical markers for each cell type (control, n = 5 patients; POP, n = 16 patients). The horizontal line within each box represents the median, and the top and bottom of each box indicate the 75th and 25th percentile. Two-sided Wilcoxon rank-sum test was applied to test the significance of the gene expression with p-value < 0.05. EP epithelial cell, FIB fibroblasts, SMC smooth muscle cells, MEP myoepithelial cells, EC endothelial cells, LEC lymphatic endothelial cells, MΦ macrophages, TC T cells, BC B cells, PB plasma B cells, MAST mast cells.
Fig. 2
Fig. 2. Aberrant Gene Expression Profiles in cell type-specific manners in POP.
a Volcano plot showing the differentially expressed genes (DEG) in bulk RNA-seq data. b Bar plots displaying the gene ontology (GO) enrichment of up- or downregulated genes in POP (Control, n = 5 patients; POP, n = 16 patients). Fisher’s exact tests (two-side) were performed. p-value < 0.05 was defined as statistically significant. c Dot plots showing the relative expression change of specific genes across different cell types. The size indicates the Log2FC values (POP/control). d and e Heatmap showing the representative gene ontology enriched in upregulated (d) or downregulated (e) genes in each cell type. The default fgsea algorithm on 1000 permutations with p-value < 0.05 was utilized. f Heatmap showing the relative expression for representative reported POP-related genes and other representative genes in each cell type in POP samples than that in control samples. EP epithelial cell, FIB fibroblasts, SMC smooth muscle cells, MEP myoepithelial cells, EC endothelial cells, LEC lymphatic endothelial cells, MΦ macrophages, TC T cells, BC B cells, PB plasma B cells, MAST mast cells.
Fig. 3
Fig. 3. Single-cell network inference reveals candidate differential expression of transcription factors among major cell types.
ac Representative upregulated TFs in the POP samples, which regulate ECM regulation and immune modulation and so on in fibroblasts (a), smooth muscle cells (b) and macrophages (c), respectively. The networks consist of several transcriptional factors and their target genes, color-coded by representative GO enrichment terms. The terms were listed on the right. The red square nodes represent TFs, and the round nodes represent target genes. Heatmaps of TFs and target genes expression were also shown on the left or the top. Con control, POP pelvic organ prolapse, TF transcription factors.
Fig. 4
Fig. 4. Global analysis of ligand–receptor interaction pairs.
a Dot plots depicts the changed numbers of putative ligand–receptor pairs in POP samples compared with control samples (red, increased; blue, decreased). b Heatmap displaying the gene ontology enrichment in the increased or decreased ligand–receptor pairs in fibroblasts, smooth muscle cells and macrophages. c Network visualization of ligand–receptor pair numbers among fibroblasts, smooth muscle cells and macrophages. The number of ligand–receptor pairs was shown. d Network visualization of specific pairs among different cell types between control and POP samples. EP epithelial cell, FIB fibroblasts, SMC smooth muscle cells, MEP myoepithelial cells, EC endothelial cells, LEC lymphatic endothelial cells, MΦ macrophages, TC T cells, BC B cells, PB plasma B cells, MAST mast cells.
Fig. 5
Fig. 5. Subclustering of major cell types in the vaginal wall reveals cellular heterogeneity.
a UMAP plot showing the distribution of seven distinct fibroblasts subtypes in control and POP samples. b Bar plots showing the percentage of seven fibroblast subtypes in each POP patient (n = 16 patients). c Relative expression of representative DEGs, TFs and ligand–receptor pairs among seven subtypes in POP samples than that in control samples. d Subclustering of smooth muscle cells further identified four distinct subtypes. e Bar plots showing the percentage of four smooth muscle cells subtypes in each POP patient (n = 16 patients). f Relative expression of representative DEGs, TFs and ligand–receptor pairs among four subtypes in POP samples than that in control samples. g Subclustering of macrophages further identified five distinct subtypes. h Bar plots showing the percentage of five macrophages subtypes in each POP patient (n = 16 patients). i Relative expression of representative DEGs, TFs and ligand–receptor pairs among five subtypes in POP samples than that in control samples. P, POP.

References

    1. Weintraub AY, Glinter H, Marcus-Braun N. Narrative review of the epidemiology, diagnosis and pathophysiology of pelvic organ prolapse. Int. Braz. J. Urol. 2020;46:5–14. doi: 10.1590/s1677-5538.ibju.2018.0581. - DOI - PMC - PubMed
    1. Barber MD. Pelvic organ prolapse. BMJ. 2016;354:i3853. doi: 10.1136/bmj.i3853. - DOI - PubMed
    1. Barber MD, Maher C. Epidemiology and outcome assessment of pelvic organ prolapse. Int Urogynecol J. 2013;24:1783–1790. doi: 10.1007/s00192-013-2169-9. - DOI - PubMed
    1. Li ZY, et al. An epidemiologic study of pelvic organ prolapsein urban Chinese women: a population-based sample in China. Zhonghua Yi Xue Za Zhi. 2019;99:857–861. - PubMed
    1. Olsen AL, Smith VJ, Bergstrom JO, Colling JC, Clark AL. Epidemiology of surgically managed pelvic organ prolapse and urinary incontinence. Obstet. Gynecol. 1997;89:501–506. doi: 10.1016/S0029-7844(97)00058-6. - DOI - PubMed

Publication types