. 2021 Jan 4;12(1):99.
doi: 10.1038/s41467-020-20306-w.

The order and logic of CD4 versus CD8 lineage choice and differentiation in mouse thymus

Affiliations

The order and logic of CD4 versus CD8 lineage choice and differentiation in mouse thymus

Mohammad M Karimi et al. Nat Commun. .

Abstract

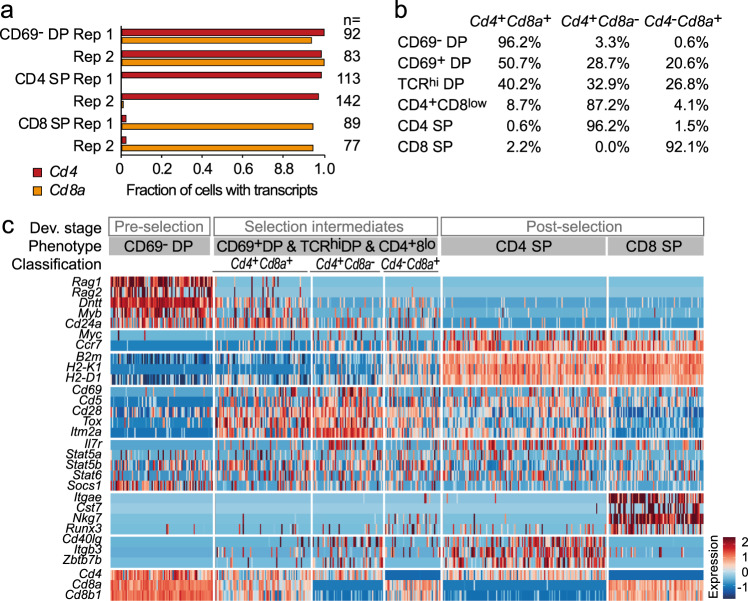
CD4 and CD8 mark helper and cytotoxic T cell lineages, respectively, and serve as coreceptors for MHC-restricted TCR recognition. How coreceptor expression is matched with TCR specificity is central to understanding CD4/CD8 lineage choice, but visualising coreceptor gene activity in individual selection intermediates has been technically challenging. It therefore remains unclear whether the sequence of coreceptor gene expression in selection intermediates follows a stereotypic pattern, or is responsive to signaling. Here we use single cell RNA sequencing (scRNA-seq) to classify mouse thymocyte selection intermediates by coreceptor gene expression. In the unperturbed thymus, Cd4+Cd8a- selection intermediates appear before Cd4-Cd8a+ selection intermediates, but the timing of these subsets is flexible according to the strength of TCR signals. Our data show that selection intermediates discriminate MHC class prior to the loss of coreceptor expression and suggest a model where signal strength informs the timing of coreceptor gene activity and ultimately CD4/CD8 lineage choice.


Conflict of interest statement

The authors declare no competing interests.

Figures

Fig. 1
Fig. 1. scRNA-seq captures maturation, activation and lineage identity as principal components of CD4/CD8 lineage choice and differentiation.
a Highly variable genes in the scRNA-seq data were identified and principal component analysis (PCA) was performed, excluding Cd4, Cd8a and Cd8b1. PC1 versus PC2 (left) and PC1 versus PC3 (right) are shown, and the percentage of variance explained by each PC is indicated as a percentage of the first five PCs. PC4 and PC5 explained 11.45% and 8.50% of variance within the first five PCs and 5.82% and 4.32% of total variance, respectively. Sorted subsets are coloured as indicated in the key. Cell numbers are shown in Supplementary Table 2. Source data are provided as a Source Data file. b PC1 reflects progressive thymocyte maturation. A two-colour dot plot projected onto a map of PC1 versus PC2 shows expression of Rag1(red), which was confined to pre-selection thymocytes, and Ccr7, which was acquired during maturation. A heat map of key thymocyte maturation genes (right) shows how markers of immature thymocytes are progressively lost along PC1 and markers of mature thymocytes are progressively gained along PC1. Source data are provided as a Source Data file. c PC2 reflects transient thymocyte activation. Expression of the activation marker Cd69 (green) projected onto a map of PC1 versus PC2. Heat maps of key thymocyte activation genes (right) show how markers of thymocyte activation are progressively gained along PC2. The same markers show non-linear behaviour along PC1, as they are first gained and then lost during thymocyte maturation. Source data are provided as a Source Data file. d PC3 reflects CD4/CD8 lineage identity. Expression of Cd4 (red) and Cd8a (green), as a two-colour dot plot projected onto a map of PC1 versus PC3. A heat map of CD4- and CD8 lineage-specific genes (right) shows how PC3 segregates markers of the CD4 and CD8 lineages. Source data are provided as a Source Data file.
Fig. 2
Fig. 2. scRNA-seq reliably detects the coreceptor transcripts Cd4 and Cd8a.
a scRNA-seq detection frequencies of Cd4 (red) and Cd8a (orange) in sorted CD69 DP, CD4 SP and CD8 SP wild-type thymocytes. Bars of the same colour represent independent biological replicates. Cell numbers are listed in Supplementary Table 2. Source data are provided as a Source Data file. b Representation of Cd4+Cd8a+, Cd4+Cd8a and Cd4Cd8a+ coreceptor gene expression patterns in by CD69 DP, CD69+DP, TCRβhi DP, CD4+CD8low, CD4 SP and CD8 SP wild-type thymocytes. c Cells (columns) are grouped by developmental stage (pre-selection, selection intermediates and post-selection) and cell surface phenotype. CD69 DP represent pre-selection thymocytes, pooled CD69+DP, TCRβhi DP and CD4+CD8low represent selection intermediates, CD4 SP, TCRβhi CD8 SP represent post-selection thymocytes. Selection intermediates are classified into Cd4+Cd8a+, Cd4+Cd8a and Cd4Cd8a+ based on scRNA-seq detection of Cd4 and Cd8a. The data shown are for replicate 2. See Supplementary Table 7 for cell numbers.
Fig. 3
Fig. 3. Expression of TCR signalling genes by selection intermediates of defined coreceptor gene expression status.
a Expression of TCR activation genes Cd69, Egr1, Nr4a1 and Itm2a by selection intermediates of the indicated coreceptor status. Means and standard errors are shown. P-values are derived by two-sided Wilcoxon rank-sum test. Cell numbers are listed in Supplementary Tables 2 and 3. Source data are provided as a Source Data file. b IPA analysis of pathway activity downstream of the TCR and of CD3. Activation z-scores above 2 and below −2 are considered significant. Selection intermediates versus CD69 DP is shown on the left. Where available, comparisons between subsets of selection intermediates are shown on the right. Source data are provided as a Source Data file.
Fig. 4
Fig. 4. Lineage-specific expression of Zbtb7b but not Runx3.
a Differential expression of transcriptional regulators in Cd4+Cd8a+ (left), Cd4+Cd8a (middle) and Cd4Cd8a+ selection intermediates (right) compared to CD69 DP. Shown are log2 fold-changes and adjusted P-values (two-sided Wilcoxon rank-sum test). Zbtb7b and Runx3 are highlighted. Source data are provided as a Source Data file. b Differential expression of transcriptional regulators in Cd4+Cd8a versus Cd4Cd8a+ selection intermediates. Shown are log2 fold-changes and nominal P-values (two-sided Wilcoxon rank-sum test). Zbtb7b and Runx3 are highlighted. Source data are provided as a Source Data file. c The frequency of Zbtb7b (left) and Runx3 expression (right) in the indicated thymocyte subsets is shown for wild-type replicate 2. Black: ‘lineage-appropriate’ expression. Red: ‘lineage-inappropriate’ expression. Source data are provided as a Source Data file. d The expression of Zbtb7b by selection intermediates of the indicated coreceptor gene expression status for different PC1 ranges in wild type (left) and MHC class II−/− thymus (right). Source data are provided as a Source Data file.
Fig. 5
Fig. 5. CD4 and CD8 lineage characteristics are established at different times during CD4/CD8 lineage choice and differentiation.
a Expression of Cd4, Zbtb7b and Cd40lg by selection intermediates of the indicated coreceptor status. Means and standard errors are shown. P-values are derived by two-sided Wilcoxon rank-sum test. Cell numbers are listed in Supplementary Tables 2 and 3. Source data are provided as a Source Data file. b Expression of Cd8a, Runx3 and Nkg7 by selection intermediates of the indicated coreceptor status. Means and standard errors are shown. P-values are derived by two-sided Wilcoxon rank-sum test. Cell numbers are listed in Supplementary Tables 2 and 3. Source data are provided as a Source Data file. c Co-expression of the activation marker Itm2a with the CD4 lineage marker Zbtb7b and of Cd40lg (R = 0.30, P = 3.2e−11 and R = 0.40, P < 2.2e−16, respectively). See Supplementary Fig. 6a for a depiction of the positive correlation between Itm2a and the CD4 lineage markers Zbtb7b and Cd40lg. Source data are provided as a Source Data file. d Lack of co-expression of the activation marker Itm2a with the CD8 lineage markers Nkg7 and Itgae (R = −0.27, P = 2.4e−09 and R = −0.28, P = 4.2e−10, respectively). See Supplementary Fig. 6b for a depiction of the negative correlation between Itm2a and the CD8 lineage markers Nkg7 and Itgae. Source data are provided as a Source Data file. e Mean expression of Cd40lg, involved in T cell help, and the cytotoxic T cell marker Prf1 in selection intermediates with distinct coreceptor gene expression. Means and standard errors are shown. P-values are derived by two-sided Wilcoxon rank-sum test. Cell numbers are listed in Supplementary Tables 2 and 3. Source data are provided as a Source Data file. f Mean expression of H2-K1 and B2m in selection intermediates with distinct coreceptor gene expression. Means and standard errors are shown. P-values are derived by two-sided Wilcoxon rank-sum test. Cell numbers are listed in Supplementary Tables 2 and 3. Source data are provided as a Source Data file.
Fig. 6
Fig. 6. The temporal sequence of coreceptor gene expression by selection intermediates.
a PCA 1 versus 2. The inset (far left) shows all cells coloured by cell surface phenotype. Red dots show the position of cells that are Cd4+Cd8a+ (left), Cd4+Cd8a (centre) or Cd4Cd8a+ (right). Source data are provided as a Source Data file. b PCA 1 versus 3. The inset (far left) shows all cells coloured by cell surface phenotype. Red dots show the position of cells that are Cd4+Cd8a+ (left), Cd4+Cd8a (centre) or Cd4Cd8a+ (right). Source data are provided as a Source Data file. c The temporal sequence of pre- and post-selection wild-type thymocytes. The vertical axis shows the number of pre-selection DP, CD4 SP and CD8 SP expressed normalised to the maximal number of cells detected for each population. The number of cells in each cell population is indicated. Source data are provided as a Source Data file. d The temporal sequence of coreceptor gene expression by selection intermediates. The vertical axis shows the number of selection intermediates with the indicated coreceptor gene expression normalised to the maximal number of cells for each gene expression pattern. The number of selection intermediates with each coreceptor gene expression pattern is indicated. P-values: one-sided Kolmogorov–Smirnov test. See Supplementary Fig. 7 for individual biological replicates. Source data are provided as a Source Data file. e Slingshot trajectory of wild-type Cd4+Cd8a+, Cd4+Cd8a, Cd4Cd8a+ selection intermediates based on PCA clustering (top), pseudotime analysis (middle) and quantification of coreceptor gene expression patterns along the pseudotime axis (bottom). P-values: one-sided Kolmogorov–Smirnov test. The alternative Slingshot clustering options, MDS and t-SNE, gave equivalent results. f The order of coreceptor gene expression patterns is not invariant. The position of MHC class II−/− selection intermediates Cd4+Cd8a+, Cd4+Cd8a, Cd4Cd8a+ along PC1. Note the difference between wild-type (d) and MHC class II−/− (f). P-values: one-sided Kolmogorov–Smirnov test. Source data are provided as a Source Data file. g Slingshot trajectory of MHC class II−/− Cd4+Cd8a+, Cd4+Cd8a, Cd4Cd8a+ selection intermediates based on PCA clustering (top), pseudotime analysis (middle) and quantification of coreceptor gene expression patterns along the pseudotime axis (bottom). P-values: one-sided Kolmogorov–Smirnov test. The alternative Slingshot clustering options, MDS and t-SNE, gave equivalent results.
Fig. 7
Fig. 7. MHC class discrimination and Cd4 Cd8a coreceptor gene expression in selection intermediates.
a Expression of TCR activation genes in CD69 DP thymocytes and selection intermediates of the indicated coreceptor status in wild-type (black) and MHC class II-deficient thymi (red). Means and standard errors are shown. P-values (one-sided Wilcoxon rank-sum test) are for Cd4+Cd8a+ selection intermediates. Cell numbers are listed in Supplementary Tables 2 and 3. Source data are provided as a Source Data file. b Expression of cell surface CD4 and CD8 (left) and activation markers, transcription factors and signalling components (right) by CD69+DP and TCRhi DP selection intermediates that retain expression of both Cd4 and Cd8a coreceptors at the RNA level (wild-type n = 73, MHC class II-deficient n = 77). Themis is shown to illustrate that not all selection-related genes showed differential expression between MHC class II-deficient and wild-type selection intermediates. Means and standard errors are shown. P-values: one-sided Wilcoxon rank-sum test. Source data are provided as a Source Data file. c Expression of Runx1, Runx3 and Gimap3 in CD69 DP thymocytes and selection intermediates of the indicated coreceptor status in wild-type (black) and MHC class II-deficient thymi (red). Means and standard errors are shown. P-values (one-sided Wilcoxon rank-sum test) are for Cd4+Cd8a selection intermediates. Cell numbers are listed in Supplementary Tables 2 and 3. Source data are provided as a Source Data file. d A working model that combines key aspects of signal strength and sequential coreceptor models by proposing that the signal strength is linked to the dynamics of coreceptor gene expression during CD4/CD8 lineage choice and differentiation. Boxed areas indicate dependence on MHC class II. The emergence of Zbtb7b+Cd4+Cd8a selection intermediates requires MHC class II (top). The strength of TCR signals affects the time spent at the Cd4+Cd8 selection intermediate stage (darker blue indicates stronger signals, bottom). Grey arrows indicate possible transitions between coreceptor activity states that cannot be inferred directly from the data.

References

    1. Robey E, et al. Thymic selection in CD8 transgenic mice supports an instructive model for commitment to a CD4 or CD8 lineage. Cell. 1991;64:99–107. doi: 10.1016/0092-8674(91)90212-H. - DOI - PubMed
    1. Chan HS, Cosgrove D, Waltzinger C, Benoist C, Mathis D. Another view of the selective model of thymocyte selection. Cell. 1993;73:225–236. doi: 10.1016/0092-8674(93)90225-F. - DOI - PubMed
    1. Davis CB, et al. Evidence for a stochastic mechanism in the differentiation of mature subsets of T lymphocytes. Cell. 1993;73:237–247. doi: 10.1016/0092-8674(93)90226-G. - DOI - PubMed
    1. Brugnera E, et al. l. Coreceptor reversal in the thymus: signaled CD4+8+ thymocytes initially terminate CD8 transcription even when differentiating into CD8+ T cells. Immunity. 2000;13:59–71. doi: 10.1016/S1074-7613(00)00008-X. - DOI - PubMed
    1. Liu X, Bosselut R. Duration of TCR signaling controls CD4-CD8 lineage differentiation in vivo. Nat. Immunol. 2004;5:280–288. doi: 10.1038/ni1040. - DOI - PubMed

Publication types

MeSH terms