. 2021 Jan 4;12(1):101.
doi: 10.1038/s41467-020-20313-x.

Transkingdom interactions between Lactobacilli and hepatic mitochondria attenuate western diet-induced diabetes

Affiliations

Transkingdom interactions between Lactobacilli and hepatic mitochondria attenuate western diet-induced diabetes

Richard R Rodrigues et al. Nat Commun. .

Abstract

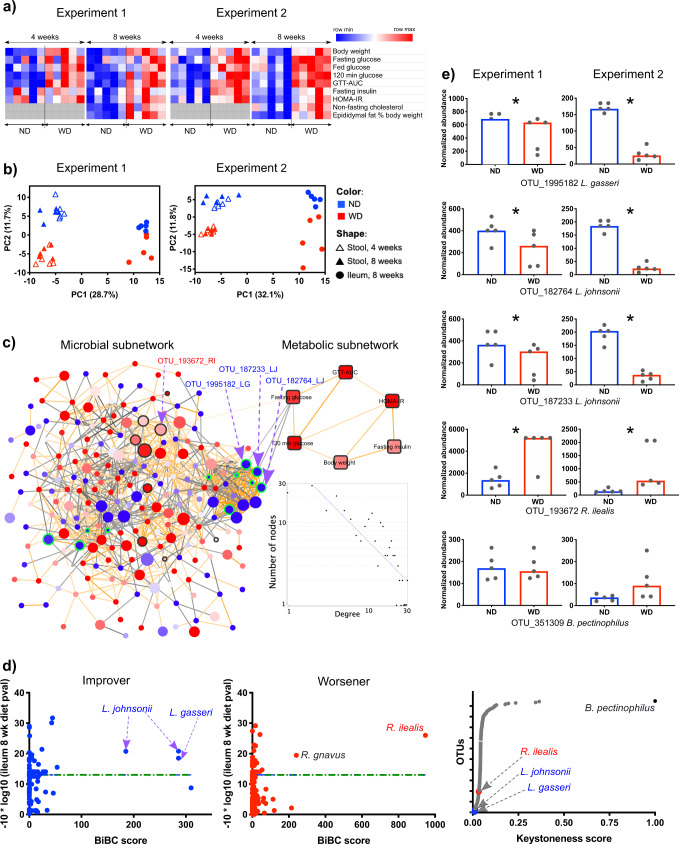
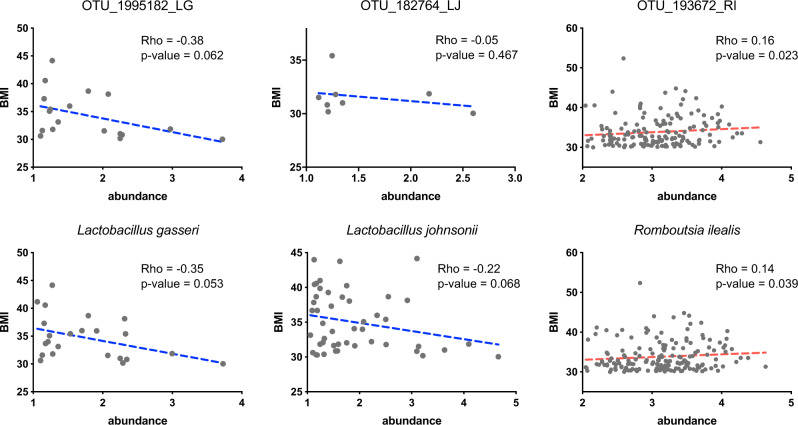
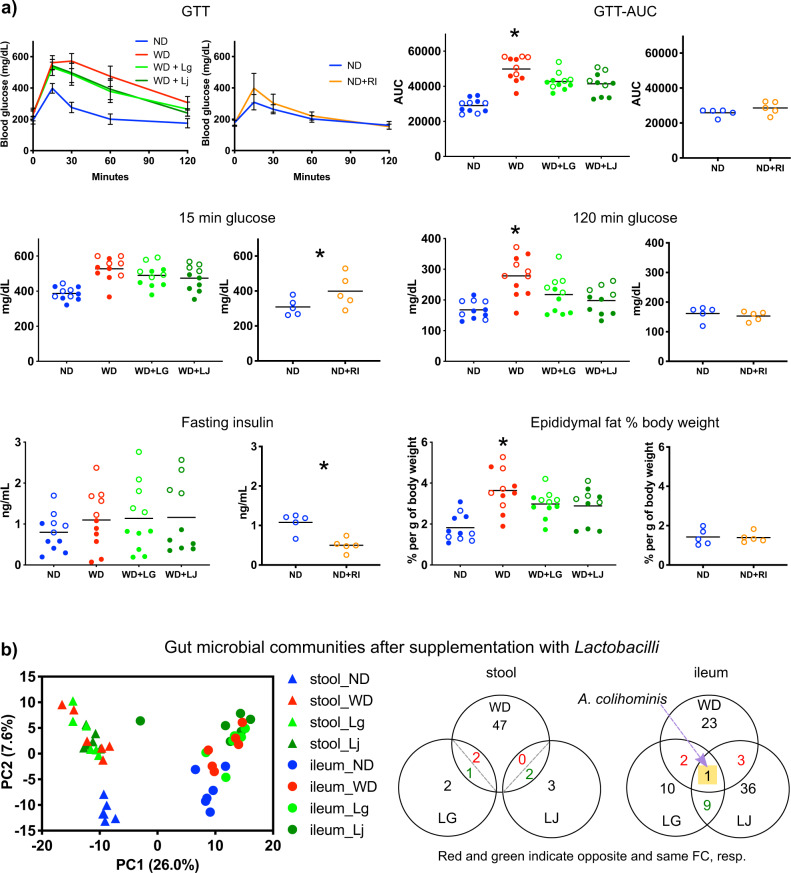
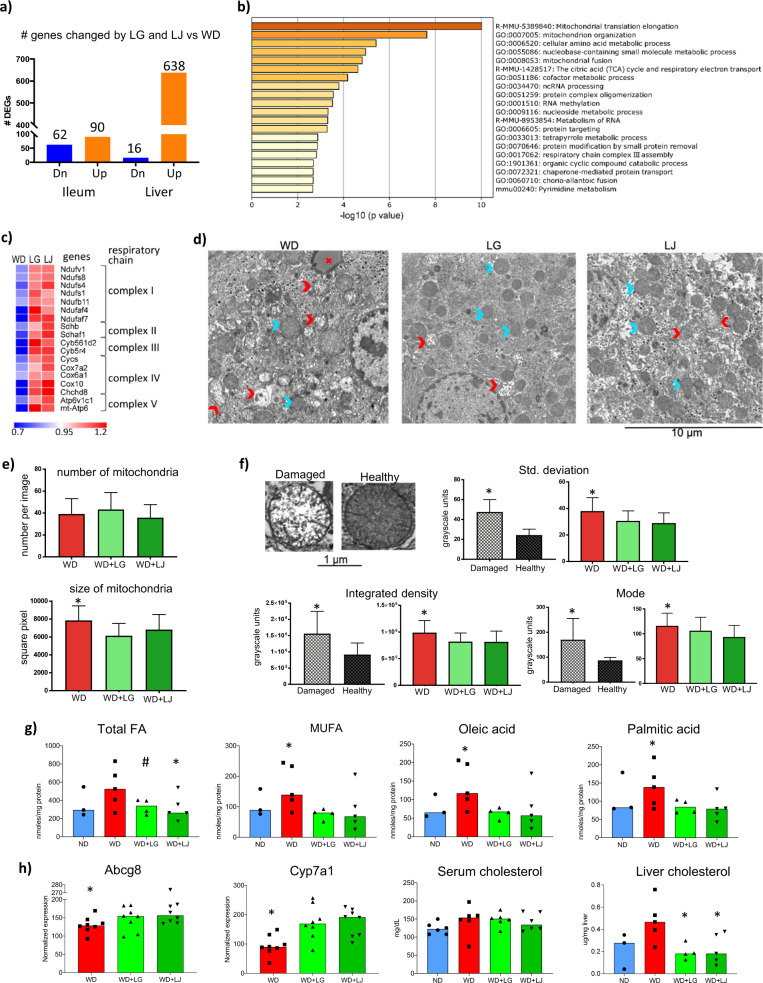
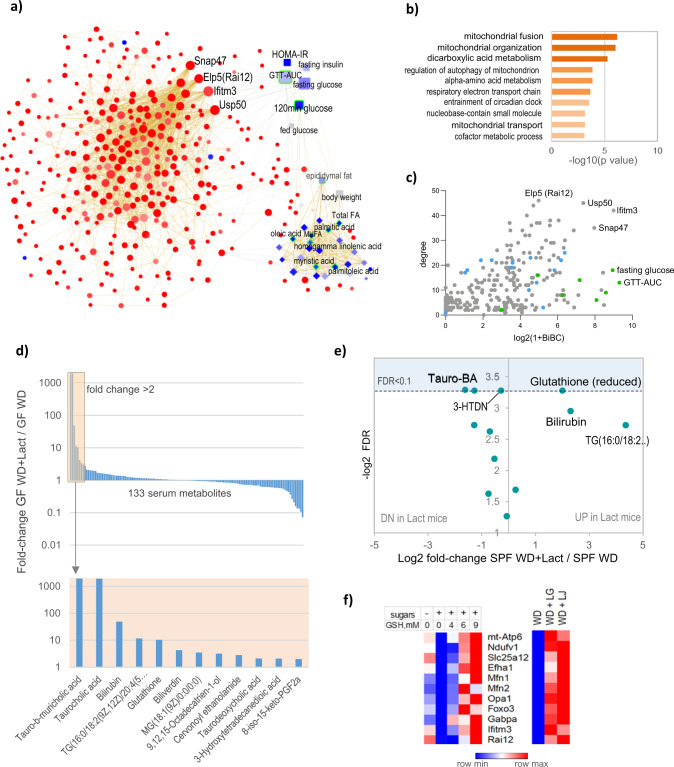
Western diet (WD) is one of the major culprits of metabolic disease including type 2 diabetes (T2D) with gut microbiota playing an important role in modulating effects of the diet. Herein, we use a data-driven approach (Transkingdom Network analysis) to model host-microbiome interactions under WD to infer which members of microbiota contribute to the altered host metabolism. Interrogation of this network pointed to taxa with potential beneficial or harmful effects on host's metabolism. We then validate the functional role of the predicted bacteria in regulating metabolism and show that they act via different host pathways. Our gene expression and electron microscopy studies show that two species from Lactobacillus genus act upon mitochondria in the liver leading to the improvement of lipid metabolism. Metabolomics analyses revealed that reduced glutathione may mediate these effects. Our study identifies potential probiotic strains for T2D and provides important insights into mechanisms of their action.


Conflict of interest statement

The authors declare no competing interests.

Figures

Fig. 1
Fig. 1. Inference of gut microbes affecting glucose metabolism in the host.
a The red and blue colors indicate higher and lower levels of metabolic parameters measured in mice fed normal diet (ND) or western diet (WD) at 4 and 8 weeks. Source data are provided as a Source Data file. b Principal Component Analysis of stool (triangle) and ileal (circle) microbial communities of mice on ND (blue) or WD (red). Source data are available at https://www.ncbi.nlm.nih.gov/sra/?term=PRJNA558801. c The microbe and host parameter nodes are represented by circles and squares, respectively, in the transkingdom (TK) network. Red and blue colors of nodes indicate increased and decreased (WD/ND) fold change, respectively, whereas the size of circle represents frequency of microbe in stool of WD mice. The black and green node borders indicate the microbes were significantly increased or decreased, respectively, in ileum of WD mice compared with ND (Fisher’s p value across experiments <0.05). The orange and black edges indicate positive and negative correlations, respectively. The degree distribution of the TK-network follows a power law. The blue line indicates the fitted line. Source data are available at https://tinyurl.com/TK-NW-Fig-1C. d The left two figures allow inference of microbial candidates that are potentially improvers (left figure) or worseners (middle figure) using high values of TK-network property (bipartite betweenness centrality (BiBC) on the x axis) and significance of change in ileal (WD vs ND) abundance of microbes (log transformed Fisher’s p value across experiments on y axis). The horizontal green line indicates a log transformed value for Fisher’s p value of 0.05. The right figure shows the keystoneness score (x axis) of the microbial nodes (y axis). Source data are provided as a Source Data file. e Ileal abundance of potential candidate and keystone microbes in ND and WD-fed mice at 8 weeks. Asterisk indicate the change in abundance passed statistical significance threshold (two-tail Mann–Whitney p value <0.2 in each experiment, Fisher’s p value across experiments <0.05, and FDR < 10%. Each dot represents a mouse, bars present median of the group. Source data same as for b.
Fig. 2
Fig. 2. Computational verification of predicted microbes in human data from the literature.
Each scatterplot shows the abundance of the microbes (X axis) in stool versus the BMI of obese humans (Y axis). The dotted line indicates the fitted line. The Spearman rho correlation coefficient and one-tail p value is shown. Data retrieved from www.ebi.ac.uk/metagenomics/studies/ERP015317.
Fig. 3
Fig. 3. Experimental validation of microbial candidates.
a Metabolic parameters in mice given control diets and supplemented with or without the indicated microbe. Glucose tolerance test (GTT) curves show the mean and SD of blood glucose over time. Open and closed circles indicate two independent experiments; * indicates statistically significant differences in levels of the parameter between control group (WD for Lactobacilli, ND for R. ilealis) versus those supplemented with bacteria (one-tail t test p value <0.05 with FDR < 15%). Blue, ND; red, WD; light green WD with L. gasseri (WD + LG); dark green, WD with L. johnsonii (WD + LJ); orange, R. ilealis (ND + RI), respectively. Source data are provided as a Source Data file. b Principal Component Analysis of stool (triangle) and ileal (circle) microbial communities and Venn diagram of microbes changed in mice on ND, WD, WD + LG or WD + LJ and with >0.1% median abundance in at least one group across experiments (Fisher’s p value <0.05 calculated using two-tail Mann–Whitney per experiment). For Lactobacilli supplementation experiments, n = 11 mice for ND, WD and WD + Lg groups, n = 10 mice for WD + Lj group. For R. ilealis (ND and ND + RI), n = 5 mice per group.
Fig. 4
Fig. 4. Transcriptome analysis, liver mitochondria, and lipids after supplementation with L. gasseri or L. johnsonii.
a Number of differently expressed genes (#DEGs, two-sided t test p value <5% in each Lactobacilli, Fisher’s p value <5% calculated over both Lactobacilli, and FDR < 10%) regulated by L. gasseri and L. johnsonii in the same direction comparing to western diet. b Over-represented processes in the genes of the network shown in a of mice supplemented with Lactobacilli. c A heatmap showing the median expression of genes from the respiratory chain process in the livers of mice. d Representative electron microscope images of liver cells. The blue and red arrows indicate healthy and damaged mitochondria, respectively. e, f Various metrics of mitochondria in the liver of mice; *statistically significant differences between control and groups supplemented with bacteria (one-sided t test p value <5%). Data are presented as mean ± s.d. (n = 40 images for WD, n = 35 images for WD + LG and n = 37 images for WD + LJ groups; n = 60 mitochondria for healthy and n = 61 for damaged mitochondria). Source data are provided as a Source Data file. g Levels of long-chain fatty acids, h expression of cholesterol metabolism genes in livers, cholesterol levels in serum and liver of mice fed WD and supplemented with or without Lactobacilli. Each symbol represents one mouse, bars are median values. Source data are provided as a Source Data file; n = 3–5 mice per group (except serum cholesterol where n = 10–11 mice per group); * indicates statistically significant differences in WD vs WD + LG or LJ (one-sided t test p value <5%); # indicates p = 0.065.
Fig. 5
Fig. 5. Multi-omic network analysis, metabolomics in mice supplemented with Lactobacilli and validation of glutathione in vitro.
a Multi-omic network integrating gene expression of genes significantly regulated in liver by Lactobacilli (circles), liver lipid profile (diamonds), and systemic metabolic parameters (squares) with red symbols indicating upregulated and blue are down in Lactobacilli supplemented mice. Green outline of nodes indicates significantly decreased lipid or phenotype; size of circle corresponds to the combined score of degree and bipartite betweenness centrality (BiBC) in the network. The orange and black edges indicate positive and negative correlations, respectively. Genes with top degree and BiBC are indicated. Source data are available at https://tinyurl.com/multi-omic-NW-Fig-5A. b Gene ontology biological functions over-represented in the genes of multi-omic network. c Scatterplot showing the degree and BiBC of all nodes in the multi-omic network with genes (gray), lipids (blue), phenotypes (green). d Fold-changes of 133 serum metabolites in germ-free (GF) mice fed western diet (WD) and colonized with L. gasseri for 2 weeks in comparison with GF mice on WD (n = 2 per group). TG, Triacylglycerol (16:0/18:2(9Z,12Z)/20:4(5Z,8Z,11Z,14Z)); MG, Monoacylglycerol; 8-iso-15-keto PGF2α, 8-iso-15-keto Prostaglandin F2α. Source data are provided in Supplementary Supplementary Data S14. e Changes in 12 metabolites identified in Fig. 5d in specific-pathogen mice (SPF) fed WD (data of serum pools of 4–6 mice in each pool per group), in five experiments of Lactobacilli-supplemented mice, mean fold change across five experiments and FDR (false discovery rate) is plotted. Source data are provided in Supplementary Supplementary Data S14c. f Left heatmap shows the geometric mean of normalized gene expression in AML-12 cells treated with either low sugar medium (glucose 17 mM), high sugar medium (glucose and fructose at 50 mM each) or high sugar medium supplemented with 4 mM, 6 mM, or 9 mM of reduced glutathione (GSH) ethyl ester (5–6 independent experiments). The right heatmap shows geometric mean of normalized gene expression from RNA-Seq in liver of western diet (WD) fed mice or WD-fed mice supplemented with either L. gasseri or L. johnsonii (red, high; blue, low relative gene expression). Source data are provided as a Source Data file.

References

    1. Gilbert JA, et al. Current understanding of the human microbiome. Nat. Med. 2018;24:392–400. - PMC - PubMed
    1. Unnikrishnan R, Pradeepa R, Joshi SR, Mohan V. Type 2 diabetes: demystifying the global epidemic. Diabetes. 2017;66:1432–1442. - PubMed
    1. Ussar S, et al. Interactions between gut microbiota, host genetics and diet modulate the predisposition to obesity and metabolic syndrome. Cell Metab. 2015;22:516–530. - PMC - PubMed
    1. Lazar V, et al. Gut microbiota, host organism, and diet trialogue in diabetes and obesity. Front Nutr. 2019;6:21. - PMC - PubMed
    1. Brown K, DeCoffe D, Molcan E, Gibson DL. Diet-induced dysbiosis of the intestinal microbiota and the effects on immunity and disease. Nutrients. 2012;4:1095–1119. - PMC - PubMed

Publication types

MeSH terms