. 2021 Jan 4;12(1):66.
doi: 10.1038/s41467-020-20303-z.

Hepatocyte-specific IL11 cis-signaling drives lipotoxicity and underlies the transition from NAFLD to NASH

Affiliations

Hepatocyte-specific IL11 cis-signaling drives lipotoxicity and underlies the transition from NAFLD to NASH

Jinrui Dong et al. Nat Commun. .

Abstract

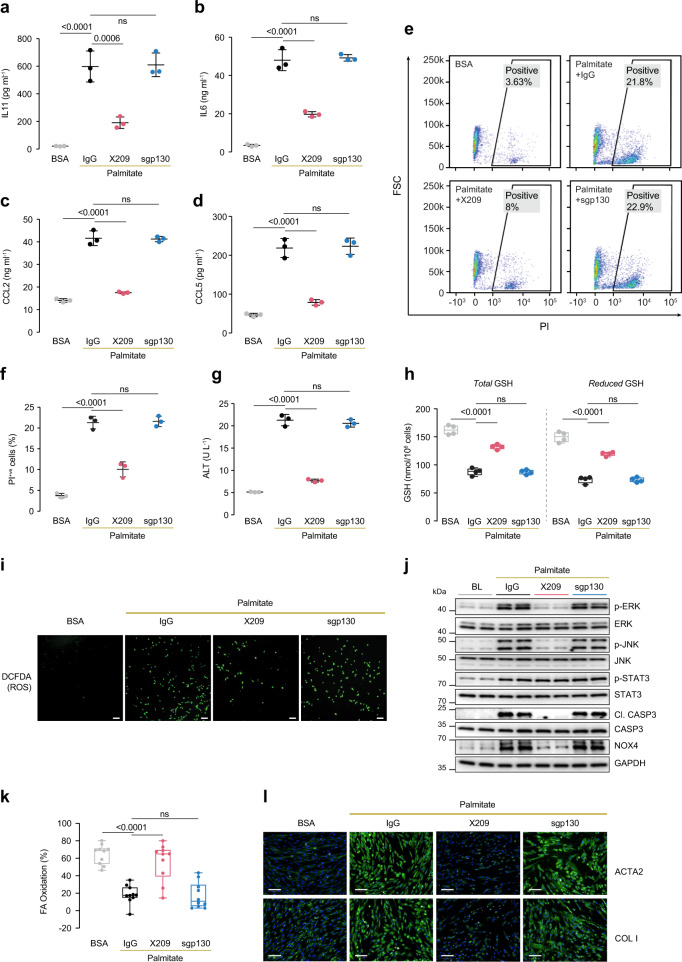
IL11 is important for fibrosis in non-alcoholic steatohepatitis (NASH) but its role beyond the stroma in liver disease is unclear. Here, we investigate the role of IL11 in hepatocyte lipotoxicity. Hepatocytes highly express IL11RA and secrete IL11 in response to lipid loading. Autocrine IL11 activity causes hepatocyte death through NOX4-derived ROS, activation of ERK, JNK and caspase-3, impaired mitochondrial function and reduced fatty acid oxidation. Paracrine IL11 activity stimulates hepatic stellate cells and causes fibrosis. In mouse models of NASH, hepatocyte-specific deletion of Il11ra1 protects against liver steatosis, fibrosis and inflammation while reducing serum glucose, cholesterol and triglyceride levels and limiting obesity. In mice deleted for Il11ra1, restoration of IL11 cis-signaling in hepatocytes reconstitutes steatosis and inflammation but not fibrosis. We found no evidence for the existence of IL6 or IL11 trans-signaling in hepatocytes or NASH. These data show that IL11 modulates hepatocyte metabolism and suggests a mechanism for NAFLD to NASH transition.


Conflict of interest statement

S.A.C., S.S., A.A.W., B.N., W.W.L., and B.K.S. are co-inventors on a number of patent applications relating to the role of IL11 in human diseases that include the published patents: WO2017103108, WO2017103108 A2, WO 2018/109174 A2, WO 2018/109170 A2. S.A.C. and S.S. are co-founders and shareholders of Enleofen Bio PTE LTD, a company (which S.A.C. is a director of) that developed anti-IL11 therapeutics, which were acquired for further development by Boehringer Ingelheim. All other authors declare non-competing interests.

Figures

Fig. 1
Fig. 1. IL11RA is highly expressed in hepatocytes and IL11 cis-signaling is hepatotoxic.
a Immunohistochemistry staining of IL11RA and IL6R in healthy human liver sections (scale bars, 20 µm, n = 1 independent experiment, due to limited amount of human liver section). b Flow cytometry forward scatter (FSC) plots of IL11RA, IL6R, and gp130 staining and fluorescence intensity plots of IL11RA and IL6R staining on hepatocytes and THP-1. c Abundance of IL11RA1 and IL6R reads in hepatocytes at baseline based on RNA-seq (left) and Ribo-seq (right) (transcripts per million, TPM) (n = 3). d, e Read coverage of d IL11RA1 and e IL6R transcripts based on RNA-seq (gray) and Ribo-seq (red) of primary human hepatocytes (n = 3). f Western blots showing ERK, JNK, and STAT3 activation status and g ALT secretion (n = 4) by hepatocytes following a dose range stimulation of either hyperIL11 or hyperIL6. h ALT levels in the supernatants of hepatocytes stimulated with hyperIL11 alone or in the presence of increasing amounts of soluble gp130 (sgp130) (n = 4). i, j Western blots of hepatocyte lysates showing i phosphorylated ERK and JNK and their respective total expression in response to hyperIL11 stimulation alone or with sgp130 and j phospho-STAT3 and total STAT3 in response to hyperIL6 stimulation with and without sgp130. k Representative FSC plots of propidium Iodide (PI) staining of IL11-stimulated hepatocytes in the presence of sgp130 or soluble IL11RA (sIL11RA). l Western blots showing phospho-ERK, phospho-JNK, cleaved caspase-3, and their respective total expression, NOX4, and GAPDH in hepatocytes in response to IL11 stimulation alone or in the presence of sgp130 or sIL11RA. i, j, l Representative data of n = 2 independent experiments. bl Primary human hepatocytes; fl 24 h stimulation; hyperIL11, hyperIL6, IL11 (20 ng/ml), sgp130, sIL11RA (1 µg/ml). c, g, h Data are shown as box-and-whisker with median (middle line), 25th–75th percentiles (box), and min–max values (whiskers). g, h One-way ANOVA with Dunnett’s correction. Source data are provided as a Source data file.
Fig. 2
Fig. 2. IL11 drives NASH phenotypes through autocrine effects in lipotoxic hepatocytes and paracrine activity in hepatic stellate cells.
al Data for palmitate (0.5 mM) loading experiment on primary human hepatocytes (24 h) in the presence of either IgG (2 µg/ml), anti-IL11RA (X209, 2 µg/ml), or sgp130 (1 µg/ml). a IL11, b IL6, c CCL2, and d CCL5 protein secretion levels as measured by ELISA of supernatants (n = 3). e Representative FSC plots and f quantification of PI+ve hepatocytes stimulated with palmitate (n = 3). g ALT levels in supernatants (n = 3). h Total and reduced hepatocyte glutathione (GSH) levels (n = 4). i Representative fluorescence images of DCFDA (2′,7′-dichlorofluorescein diacetate) staining for ROS detection (scale bars, 100 µm) (n = 4 independent experiments). j Western blots of phospho-ERK, ERK, phospho-JNK, JNK, cleaved caspase-3, caspase-3, NOX4, and GAPDH. Data from two independent biological experiments are shown. k Percentage of fatty acid oxidation by Seahorse assay (n = 10). l Representative fluorescence images (scale bars, 100 µm) of ACTA2+ve cells and Collagen I immunostaining for experiment shown in Supplementary Fig. 5j (n = 2 independent experiments, 14 measurements per condition per experiment). ad, f, g Mean ± SD; h, k data are shown as box-and-whisker with median (middle line), 25th–75th percentiles (box), and min–max values (whiskers). ad, fh, k One-way ANOVA with Tukey’s correction. Source data are provided as a Source data file.
Fig. 3
Fig. 3. Inhibition of IL6 family cytokine trans-signaling has no effect on NASH or metabolic phenotypes in mice on Western Diet supplemented with fructose.
a Schematic of WDF feeding in mice with hepatocyte-specific expression of sgp130 for data shown in (bp). Three weeks following AAV8-Alb-Null or AAV8-Alb-sgp130 virus injection, mice were fed WDF for 16 weeks. b Western blots showing hepatic levels of sgp130, IL11, IL6, and GAPDH as internal control (n = 4 mice/group). c Serum IL11 levels. d Serum IL6 levels. e Representative gross anatomy, H&E-stained (scale bars, 50 µm), and Masson’s Trichrome (scale bars, 100 µm) images of livers. Representative dataset from n = 8 mice/group is shown for gross anatomy; representative dataset from n = 4 mice/group is shown for H&E-stained and Masson’s Trichrome images. f Liver weight. g Hepatic triglycerides content. h Serum ALT levels. i Serum AST levels. j Hepatic collagen levels. k Fasting blood glucose levels. l Serum triglycerides levels. m Serum cholesterol levels. n Hepatic GSH content. o Hepatic pro-inflammatory and fibrotic genes expression heatmap (values are shown in Supplementary Fig. 6d and e). p Western blots of hepatic phospho-ERK, ERK, phospho-JNK, JNK, phospho-STAT3, and STAT3 (n = 4 mice/group). c, d, fo n = 8 mice/group. c, d, fn Data are shown as box-and-whisker with median (middle line), 25th–75th percentiles (box), and min–max values (whiskers); one-way ANOVA with Tukey’s correction. Source data are provided as a Source data file.
Fig. 4
Fig. 4. Hepatocyte-specific inhibition of IL11 cis-signaling protects mice against HFMCD diet-induced NASH.
a Schematic of HFMCD feeding regimen for AAV8-Alb-Cre injected Il11ra1loxP/loxP (conditional knockout; CKO) mice for experiments shown in (bk). Il11ra1loxP/loxP mice were intravenously injected with either AAV8-Alb-Null or AAV8-Alb-Cre to delete Il11ra1 specifically in hepatocytes 3 weeks prior to the start of HFMCD diet. b Western blots of hepatic IL11RA and GAPDH (n = 3 mice/group). c Body weight (shown as a percentage (%) of initial body weight). d Representative gross anatomy, H&E-stained (scale bars, 50 µm), and Masson’s Trichrome (scale bars, 100 µm) images of livers. Representative dataset from n = 5 mice/group is shown for gross anatomy; representative dataset from n = 4 mice/group is shown for H&E-stained and Masson’s Trichrome images. e Hepatic triglycerides content. f Serum ALT levels. g Serum AST levels. h Hepatic GSH content. i Hepatic collagen levels. j Heatmap showing hepatic mRNA expression of pro-inflammatory markers (Tnfα, Ccl2, Ccl5) and fibrotic markers (Col1a1, Col1a2, Col3a1, Acta2). Values are shown in Supplementary Fig. 8c and d. k Western blots showing hepatic ERK and JNK activation status (n = 3 mice/group). c, ej NCD (n = 5 mice/group), HFMCD (n = 6 mice/group). c Data are shown as mean ± SD, two-way ANOVA with Tukey’s correction, statistical significance (P values) are shown for comparison between WT HFMCD and CKO HFMCD; ei data are shown as box-and-whisker with median (middle line), 25th–75th percentiles (box), and min–max values (whiskers); two-way ANOVA with Tukey’s correction. Source data are provided as a Source data file.
Fig. 5
Fig. 5. Hepatocyte-specific inhibition of IL11 cis-signaling protects mice against WDF-induced obesity and NASH.
a Schematic of WDF-fed control and CKO mice for data shown in (bm). Three weeks following AAV8-Alb-Null or AAV8-Alb-Cre virus injection, CKO mice were fed WDF for 16 weeks. b Western blots showing hepatic levels of IL11RA and GAPDH (n = 3 mice/group). c Body weight (shown as a percentage (%) of initial body weight). d Fat mass. e Representative gross anatomy, H&E-stained (scale bars, 50 µm), and Masson’s Trichrome (scale bars, 100 µm) images of livers. Representative dataset from n = 5/group is shown for gross anatomy; representative dataset from n = 4 mice/group is shown for H&E-stained and Masson’s Trichrome images. f Hepatic triglycerides content. g Liver weight. h Serum ALT levels. i Serum AST levels. j Hepatic GSH content. k Hepatic collagen levels. l Hepatic pro-inflammatory and fibrotic genes expression on heatmap (values are shown in Supplementary Fig. 9c and d). m Western blots showing activation status of hepatic ERK and JNK (n = 3 mice/group). c, d, fl n = 5 mice/group. c, d Data are shown as mean ± SD, two-way ANOVA with Tukey’s correction, statistical significance (P values) are shown for comparison between WT WDF and CKO WDF; fk data are shown as box-and-whisker with median (middle line), 25th–75th percentiles (box), and min–max values (whiskers); two-way ANOVA with Tukey’s correction. Source data are provided as a Source data file.
Fig. 6
Fig. 6. Hepatocyte-specific IL11 cis-signaling but not IL11 trans-signaling drives steatohepatitis in mice on WDF.
a Schematic showing WDF feeding regimen of Il11ra1+/+ (WT) and Il11ra1−/− (KO) mice for experiments shown in (bn). AAV8-Alb-Null, AAV8-Alb-mbIl11ra1 (full-length membrane-bound Il11ra1), and AAV8-Alb-sIl11ra1 (soluble form of Il11ra1)-injected KO mice were given 16 weeks of WDF feeding, three weeks following virus administration. b Western blots showing hepatic levels of IL11RA and GAPDH (n = 2 mice/group). c Representative gross anatomy, H&E-stained (scale bars, 50 µm) and Masson’s Trichrome (scale bars, 100 µm) images of livers. Representative dataset from n = 6 mice/group is shown for gross anatomy; representative dataset from n = 4 mice/group is shown for H&E-stained and Masson’s Trichrome images. d Liver weight. e Hepatic triglycerides content. f Serum ALT levels. g Serum AST levels. h Hepatic GSH content. i Hepatic collagen content. j Hepatic pro-inflammatory and fibrotic genes expression heatmap (values are shown in Supplementary Fig. 10c and d). k Western blots showing activation status of hepatic ERK and JNK (n = 2 mice/group). l Fasting blood glucose levels. m Serum triglycerides levels. n Serum cholesterol levels. dj, ln n = 6 mice/group. di, ln Data are shown as box-and-whisker with median (middle line), 25th–75th percentiles (box), and min–max values (whiskers); one-way ANOVA with Tukey’s correction. Source data are provided as a Source data file.
Fig. 7
Fig. 7. Proposed mechanism for IL11 in lipotoxicity-driven NASH transition.
Excessive lipid accumulation in hepatocytes stimulates IL11 protein secretion and autocrine IL11 activity, which upregulates NOX4 and increases reactive oxygen species production. Subsequently, hepatocyte mitochondrial oxidative capacity and fatty acid metabolism impaired and steatosis established. ERK, JNK, and caspase-3 become activated and this leads to lipoapoptosis, along with other forms of cell death. IL11 also acts in paracrine to drive hepatic stellate cell-to-myofibroblast transformation and fibrosis. Cytokines and chemokines released from lipotoxic hepatocytes and HSCs activate and recruit immune cells causing inflammation.

References

    1. Schafer S, et al. IL-11 is a crucial determinant of cardiovascular fibrosis. Nature. 2017;552:110–115. doi: 10.1038/nature24676. - DOI - PMC - PubMed
    1. Ng, B. et al. Interleukin-11 is a therapeutic target in idiopathic pulmonary fibrosis. Sci. Transl. Med. 11, eaaw1237 (2019). - PubMed
    1. Lim W-W, et al. Transgenic interleukin 11 expression causes cross-tissue fibro-inflammation and an inflammatory bowel phenotype in mice. PLoS ONE. 2020;15:e0227505. doi: 10.1371/journal.pone.0227505. - DOI - PMC - PubMed
    1. Cook SA, Schafer S. Hiding in plain sight: interleukin-11 emerges as a master regulator of fibrosis, tissue integrity, and stromal inflammation. Annu. Rev. Med. 2020;71:263–276. doi: 10.1146/annurev-med-041818-011649. - DOI - PubMed
    1. Bigaeva, E. et al. Transcriptomic characterization of culture-associated changes in murine and human precision-cut tissue slices. Arch. Toxicol.10.1007/s00204-019-02611-6 (2019). - PubMed

Publication types

MeSH terms