. 2021 Jan 4;12(1):113.
doi: 10.1038/s41467-020-20383-x.

Standardization of ELISA protocols for serosurveys of the SARS-CoV-2 pandemic using clinical and at-home blood sampling

Affiliations

Standardization of ELISA protocols for serosurveys of the SARS-CoV-2 pandemic using clinical and at-home blood sampling

Carleen Klumpp-Thomas et al. Nat Commun. .

Abstract

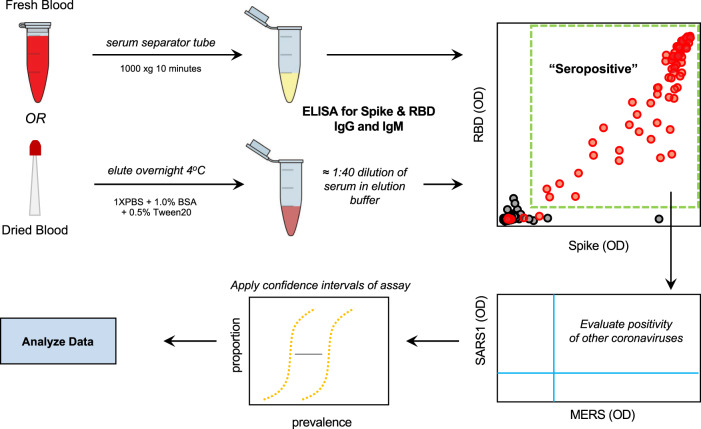
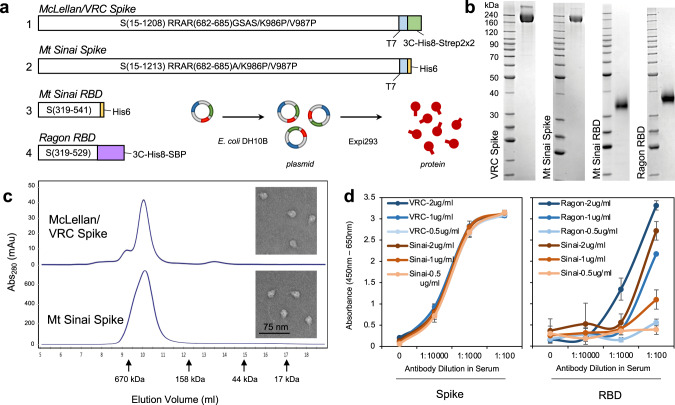
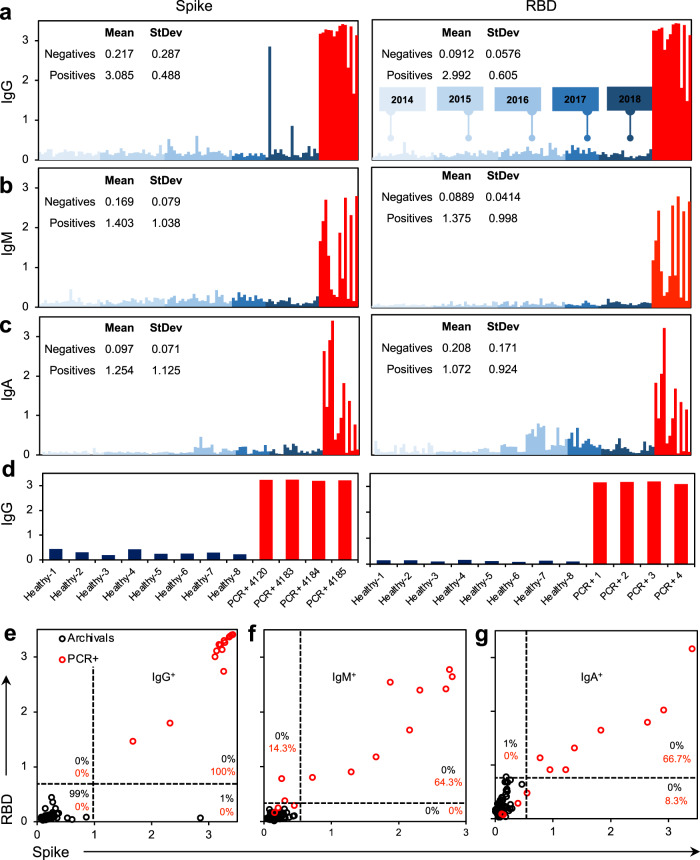
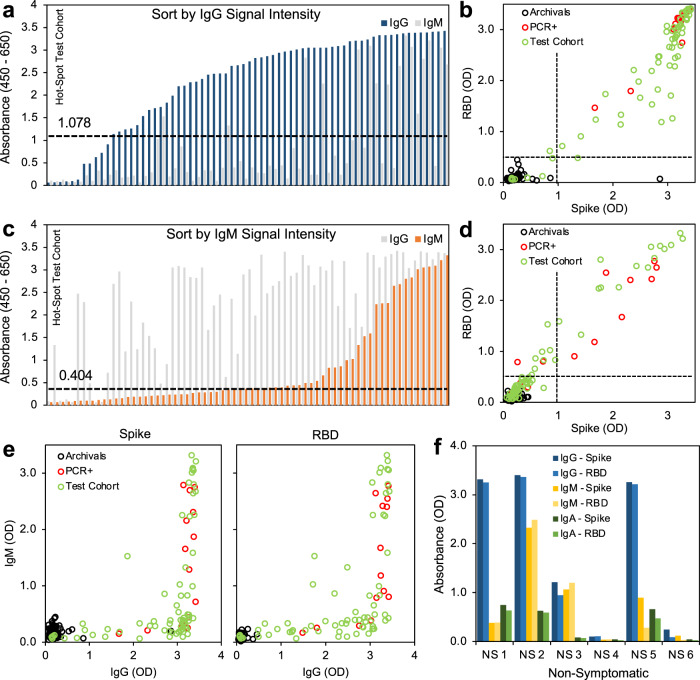
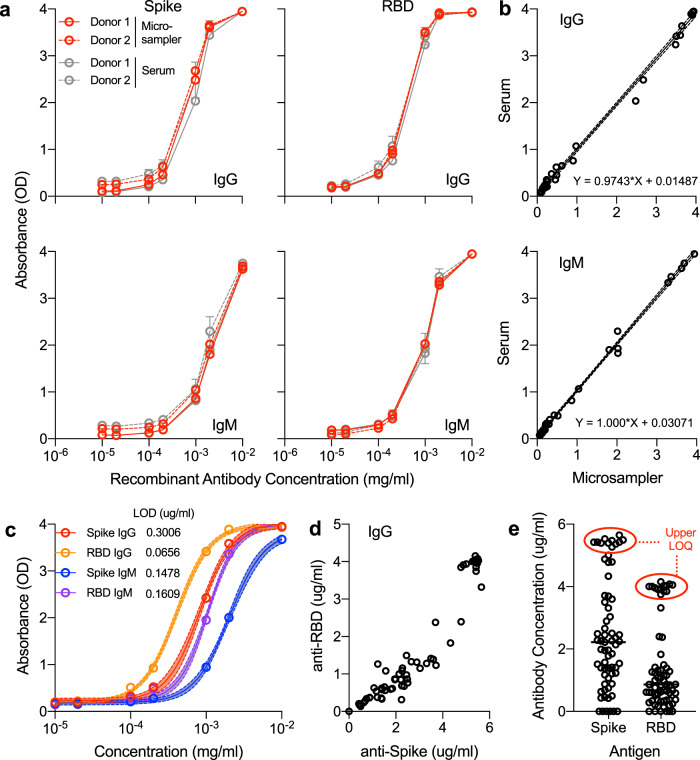
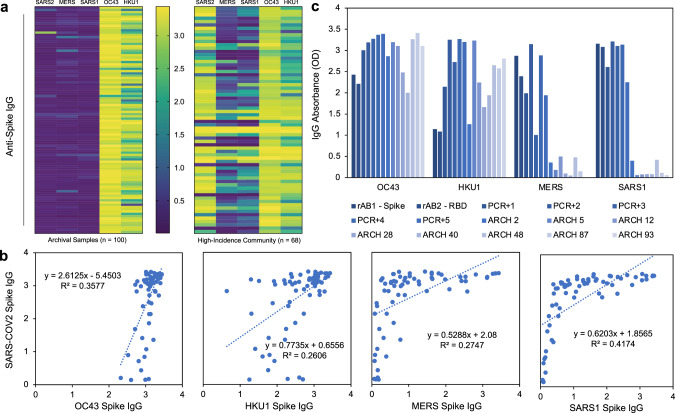
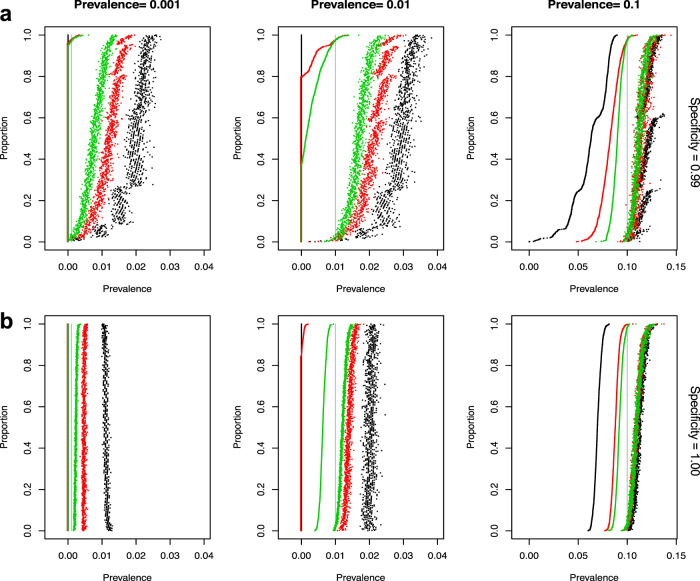
The extent of SARS-CoV-2 infection throughout the United States population is currently unknown. High quality serology is key to avoiding medically costly diagnostic errors, as well as to assuring properly informed public health decisions. Here, we present an optimized ELISA-based serology protocol, from antigen production to data analyses, that helps define thresholds for IgG and IgM seropositivity with high specificities. Validation of this protocol is performed using traditionally collected serum as well as dried blood on mail-in blood sampling kits. Archival (pre-2019) samples are used as negative controls, and convalescent, PCR-diagnosed COVID-19 patient samples serve as positive controls. Using this protocol, minimal cross-reactivity is observed for the spike proteins of MERS, SARS1, OC43 and HKU1 viruses, and no cross reactivity is observed with anti-influenza A H1N1 HAI. Our protocol may thus help provide standardized, population-based data on the extent of SARS-CoV-2 seropositivity, immunity and infection.


Conflict of interest statement

The authors declare no competing interests.

Figures

Fig. 1
Fig. 1. Serology testing protocol for evaluation of SARS-CoV-2 seropositivity in a large-scale population.
Utilizing both venipuncture-derived fresh blood and dried blood spots, we have standardized a dual-antigen ELISA platform for highly specific (IgG = 100%, 95% confidence interval = 98.5–100) detection of SARS-CoV-2 antibodies for application in precise, large-scale serosurvey efforts.
Fig. 2
Fig. 2. Production and sensitivity of two full spike ectodomain (Spike) and two receptor-binding domain (RBD) constructs used as antigens in ELISA.
a Schematic of the spike and RBD constructs used to generate recombinant proteins. Abbreviations are 3 C, rhinovirus 3 C protease cleavage site; Strep2x2 dual Strep2 epitope tag, T7 bacteriophage T7 fibritin trimerization domain, SBP streptavidin-binding peptide. b SDS-PAGE Coomassie Blue staining of purified (1) McLellan/VRC spike, n = 27, (2) Mt Sinai spike, n = 6, (3) Mt Sinai RBD, n = 5, and (4) Ragon RBD, n = 13, proteins. c Analytical size-exclusion chromatography of purified McLellan/VRC (n = 27) and Mt Sinai spike (n = 6) proteins. Peak elution volumes of sizing standards are noted (670 kDa—thyroglobulin, 158 kDa—gamma-globulin, 44 kDa—ovalbumin, 17 kDa—myoglobin). Inset: transmission electron microscopy of McLellan/VRC and Mt Sinai spike trimers. Ladder unit = kDa. d Left: full spike ectodomain at three different concentrations of protein coating density for both McLellan/VRC (NIAID Vaccine Research Center, blue) and Sinai (Mount Sinai, orange) constructs. Right: RBD constructs at three different concentrations of protein coating for both Ragon (Ragon Institute, blue) and Sinai (Mount Sinai, orange) constructs. Anti-spike or anti-RBD monoclonal recombinant antibody spiked into negative serum at 1:100, 1:1000, and 1:10000 dilution. Data are means ± SD, n = 4 independent study replicates on two independent protein preparations. Source data are provided as a Source Data file.
Fig. 3
Fig. 3. Specificity of antigens against a preliminary panel of pre-2019 archival sample controls.
ac Spike (McLellan/VRC) and RBD (Ragon) antigens tested against 100 archival controls collected from 2014 to 2018 (blue) compared with 14 SARS-CoV-2 PCR+ controls (red) for a IgG, b IgM, and c IgA. d Microsampler controls of PCR+ samples against healthy controls. eg Seropositivity thresholding for e IgG, f IgM), and g IgA calculated from average signal intensity of archival controls. n = 100 archival controls (black), n = 14 nasal swab SARS-CoV-2 PCR+ patients (red). Manual ELISA, titer = 1:400 (serum) or 1:10 (microsampler eluate). Source data are provided as a Source Data file.
Fig. 4
Fig. 4. Small-scale testing of SARS-CoV-2 seropositivity from a hard-hit community.
a Signal intensity (absorbance) sorted by IgG (blue). b Thresholding of seropositivity in small-scale test cohort for SARS-CoV-2 IgG, black = archival negative controls, red = known PCR-diagnosed positive controls, green = test cohort. c Signal intensity (absorbance) sorted by IgM (orange). d Thresholding of seropositivity in small-scale test cohort for SARS-CoV-2 IgM. e Relation between IgM expression and IgG expression of spike and RBD antigens. f Seropositivity in non-symptomatic individuals who have not tested (PCR) positive for SARS-CoV-2 infection show robust IgG expression in absence of symptoms. n = 68 symptomatic donors, n = 6 non-symptomatic donors, IgG = blue, IgM = yellow, IgA = green. Source data are provided as a Source Data file.
Fig. 5
Fig. 5. Quantification of antibody concentration utilizing 4PL sigmoidal model of recombinant antibody spiked into seronegative blood.
a Anti-RBD recombinant human antibody (IgG and IgM) was added to whole blood from two seronegative donors, then absorbed to microsamplers and remaining blood was spun down to isolate serum and analyzed on full spike ectodomain trimer (spike) or receptor-binding domain (RBD) ELISA. Data are mean ± SEM, n = 3, red = microsampler eluate, gray = matched serum. b Direct comparison of absorbance of range of recombinant antibody concentration in serum (y axis) versus microsampler (x axis) blood samples. c Sigmoidal four-parameter logistic (4PL) curve fitting to recombinant antibody dilution series, 95% confidence intervals shown shaded around fit curve, n = 12 replicates per data point, red = Spike IgG, orange = RBD IgG, blue = Spike IgM, purple = RBD IgM. d Quantification of IgG levels in a sample high-incidence population. e Upper limit of quantification at 1:400 dilution of serum into ELISA (1:10 dilution of microsampler eluate), n = 68. Source data are provided as a Source Data file.
Fig. 6
Fig. 6. Cross-evaluation of high seroprevalence community samples with spike antigens from other coronaviruses.
a IgG absorbance of spike antigens from SARS-CoV-2, previous epidemic (MERS and SARS1), and seasonal (OC43 and HKU1) coronaviruses in archival pre-2019 samples (left) and high-incidence community (right). Color scale: yellow = high OD (4), purple = low OD (<0.5). b Scatter plots (with linear models and R-squared values) between IgG signal from SARS-CoV-2 spike and other coronavirus spike proteins. c Signal intensity for recombinant antibody control (rAB1 = spike monoclonal; rAB2 = RBD monoclonal), known SARS-CoV-2 nasal swab positive patient control (PCR+), and pre-2019 archival control (ARCH) samples for OC43, HKU1, MERS, and SARS1. Source data are provided as a Source Data file.
Fig. 7
Fig. 7. Simulation results showing confidence intervals for serosurvey prevalence calculations.
Each graph displays 95% confidence intervals (CI) for the estimate of prevalence from 1000 replications of each condition (including estimating the sensitivity and specificity for each replicate). The CIs are sorted by the lower bound, with lower bounds less than 0 replaced by zero. For all graphs, the true sensitivity is 0.90 and the simulations use 100 samples to estimate the sensitivity. For the graphs in row a the true specificity is 0.99 and in row b the true specificity is 1.00. The graphs show the simulations results with estimates of specificity using sample sizes of 100 (black), 300 (red), 1000 (green). Points are plotted black, red, then green, so some of the black and green points may be covered (e.g., the lower bounds for all three colors are all zeros in the bottom left panel). The columns give results for true prevalence values of 0.001, 0.01, or 0.1. The true prevalence for each simulation is shown by a vertical gray line.

Update of

References

    1. Fauci, A. S., Lane, H. C. & Redfield, R. R. Covid-19—navigating the uncharted. N. Engl. J. Med.382, 1268–1269 (2020). - PMC - PubMed
    1. Guan W-j, et al. Clinical characteristics of coronavirus disease 2019 in China. N. Engl. J. Med. 2020;382:1708–1720. doi: 10.1056/NEJMoa2002032. - DOI - PMC - PubMed
    1. Wong SH, Lui RN, Sung JJ. Covid−19 and the digestive system. J. Gastroenterol. Hepatol. 2020;35:744–748. doi: 10.1111/jgh.15047. - DOI - PubMed
    1. Long Q-X, et al. Clinical and immunological assessment of asymptomatic SARS-CoV-2 infections. Nat. Med. 2020;26:1200–1204. doi: 10.1038/s41591-020-0965-6. - DOI - PubMed
    1. Shental N, et al. Efficient high-throughput SARS-CoV-2 testing to detect asymptomatic carriers. Sci. Adv. 2020;6:eabc5961. doi: 10.1126/sciadv.abc5961. - DOI - PMC - PubMed

Publication types

MeSH terms