. 2021 Jan 4;12(1):105.
doi: 10.1038/s41467-020-20302-0.

Early-life-trauma triggers interferon-β resistance and neurodegeneration in a multiple sclerosis model via downregulated β1-adrenergic signaling

Affiliations

Early-life-trauma triggers interferon-β resistance and neurodegeneration in a multiple sclerosis model via downregulated β1-adrenergic signaling

Yee Ming Khaw et al. Nat Commun. .

Abstract

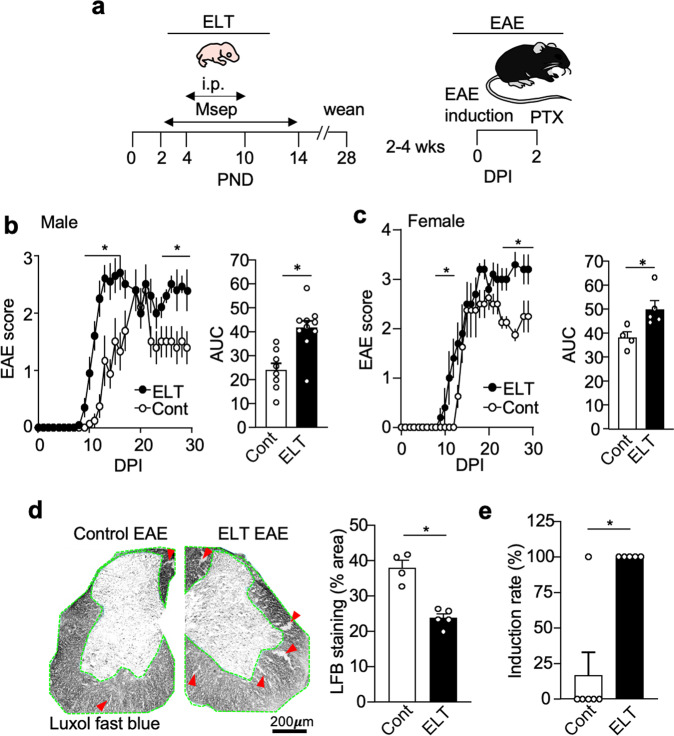
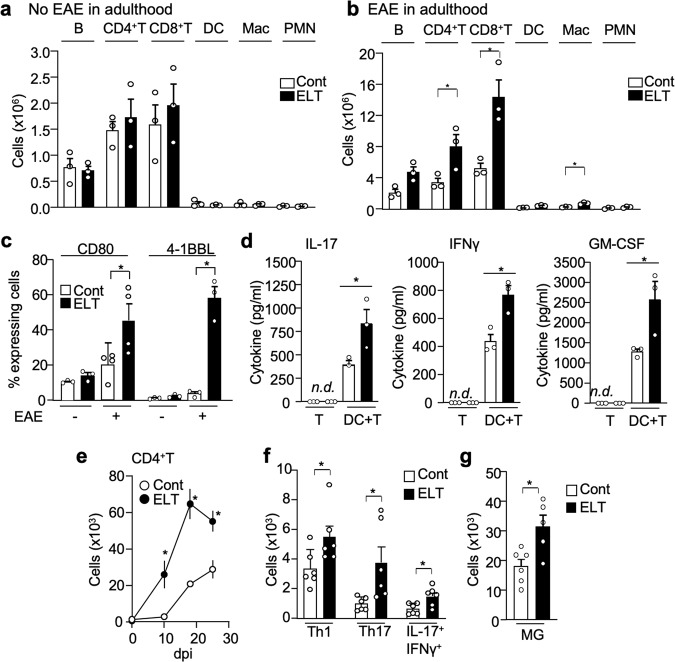
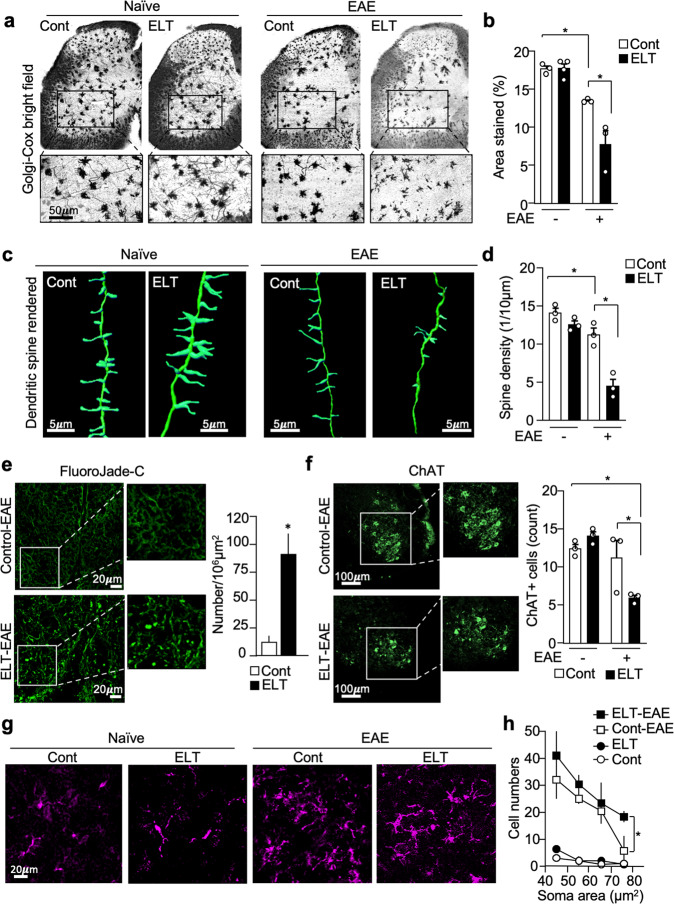
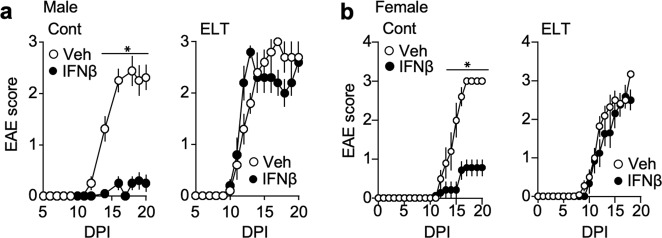
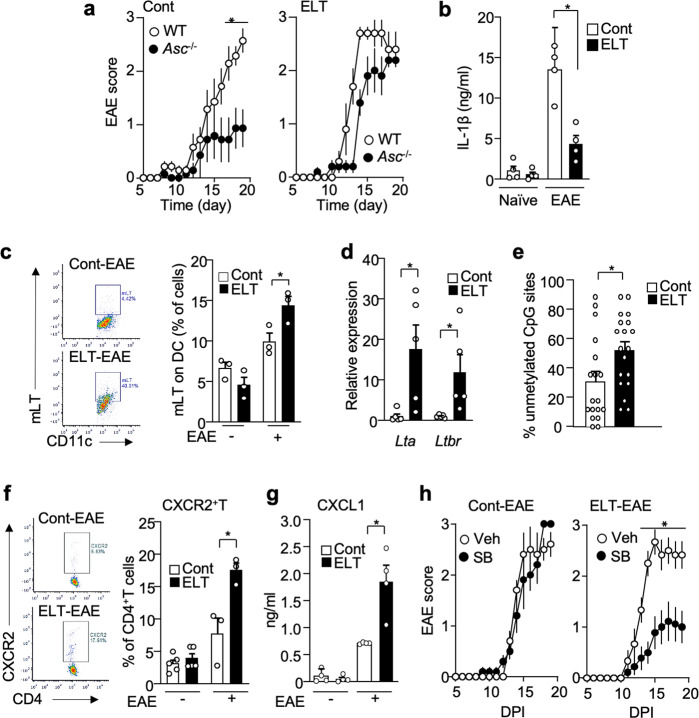
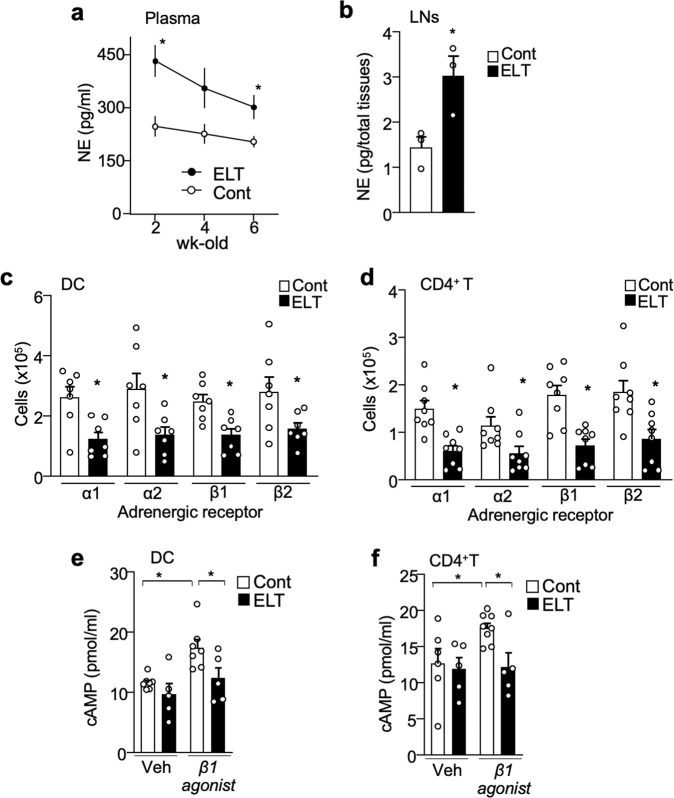
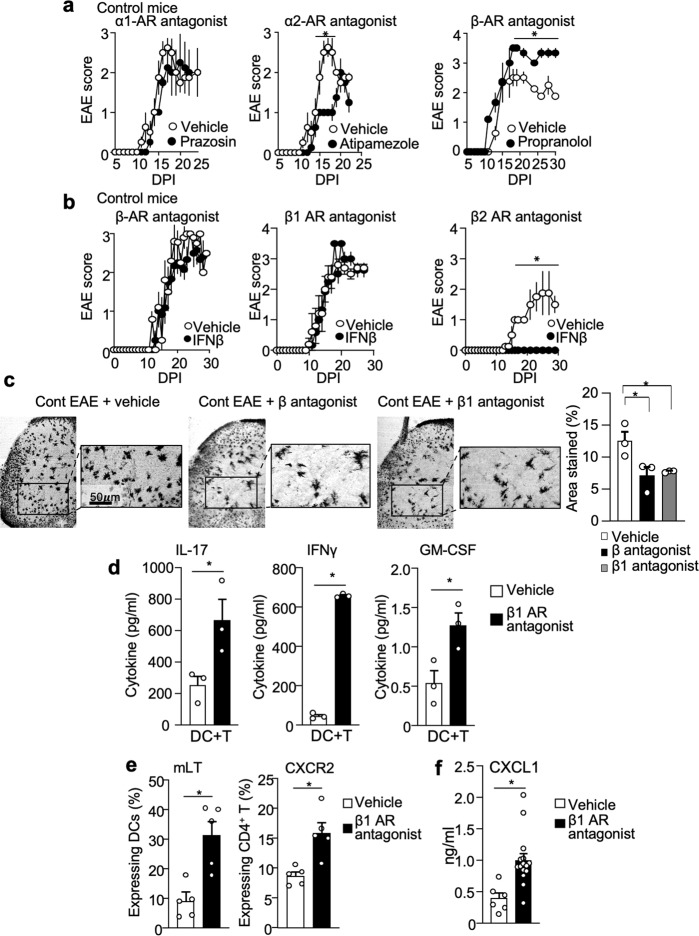
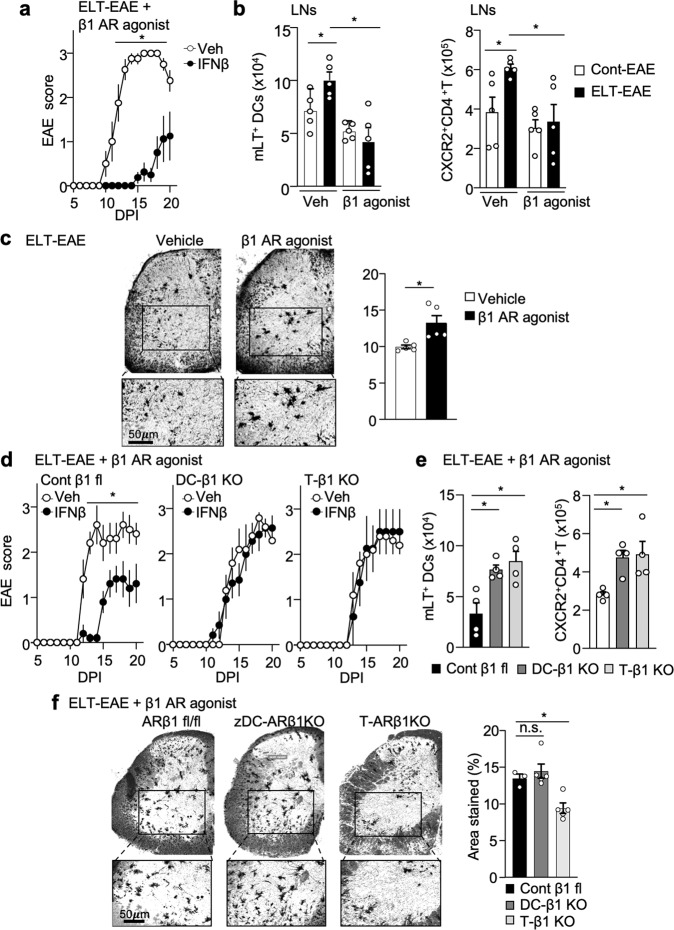
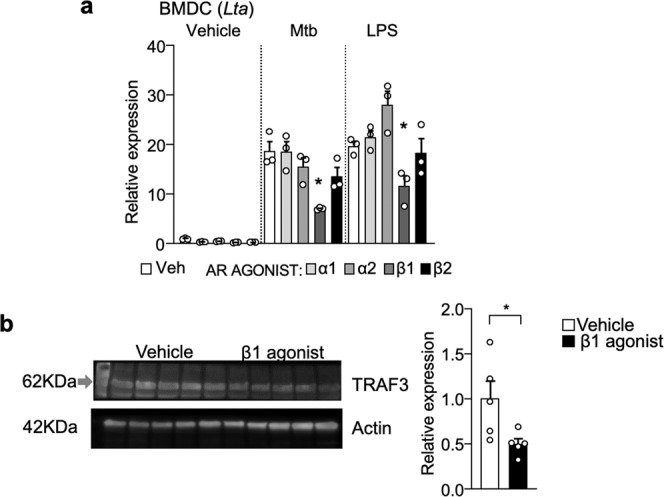
Environmental triggers have important functions in multiple sclerosis (MS) susceptibility, phenotype, and trajectory. Exposure to early life trauma (ELT) has been associated with higher relapse rates in MS patients; however, the underlying mechanisms are not well-defined. Here we show ELT induces mechanistic and phenotypical alterations during experimental autoimmune encephalitis (EAE). ELT sustains downregulation of immune cell adrenergic receptors, which can be attributed to chronic norepinephrine circulation. ELT-subjected mice exhibit interferon-β resistance and neurodegeneration driven by lymphotoxin and CXCR2 involvement. These phenotypic changes are observed in control EAE mice treated with β1 adrenergic receptor antagonist. Conversely, β1 adrenergic receptor agonist treatment to ELT mice abrogates phenotype changes via restoration of immune cell β1 adrenergic receptor function. Our results indicate that ELT alters EAE phenotype via downregulation of β1 adrenergic signaling in immune cells. These results have implications for the effect of environmental factors in provoking disease heterogeneity and might enable prediction of long-term outcomes in MS.


Conflict of interest statement

The authors declare no competing interests.

Figures

Fig. 1
Fig. 1. ELT impacts EAE susceptibility, severity, and duration in both male and female mice.
a Schematic representation of experimental procedure. PND and DPI indicate postnatal day and day post-EAE induction, respectively. b Mean clinical EAE scores and cumulative scores of male mice (Cont EAE: n = 8, ELT-EAE: n = 10). c Mean clinical EAE scores and cumulative scores of female mice (Cont EAE: n = 4, ELT-EAE: n = 5). d Spinal cord  sections of EAE mice stained for myelin using Luxol-fast blue at 20 dpi (Cont EAE: n = 4, ELT-EAE: n = 5) with quantitative analysis of stained area. Green outline indicates analyzed white matter region of interest. Red arrows indicate representative demyelination regions. e EAE induction rate among mice treated with low-dose Mtb (50 μg/mouse, Cont EAE: n = 6, ELT-EAE: n = 5). Results are representatives of at least two independent experiments. Each dot represents averaged data per animal. Data are represented as mean ± SEM. Two-tailed Student’s t-test, *P < 0.05. Exact P values for asterisks: b 0.0010, c 0.0288, d 0.0004, and e 0.0112.
Fig. 2
Fig. 2. ELT alters peripheral and CNS immune cell profiling.
a, b Absolute immune cell numbers (B cell: CD19+, CD4+T cell: CD3+CD4+, CD8+T: CD3+CD8+, dendritic cell: CD11b+CD11c+, macrophage: CD11b+CD11c, neutrophil: CD11b+Ly6Ghigh) in control and ELT mice without (a) and with (b) EAE. Cells were isolated from draining lymph nodes were isolated from EAE mice at 10 dpi (n = 3 per group). c Percentage of co-stimulatory molecule (CD80 and 4-1BBL) expressing dendritic cells (CD80: n = 4 per group: 4-1BBL: n = 3 per group). d Amount of cytokines IL-17, interferon γ (IFNγ), and GM-CSF in supernatant derived from culture conditions 72 h post culture initiation. CD4+ T cells were isolated from draining lymph nodes of ELT-EAE or control EAE mice on 10 dpi to be supplemented with MOG (10 μg/ml) and cultured alone or with isolated dendritic cell isolated from ELT-EAE or control EAE mice (n = 3 per group). White and black bars represent data from control and ELT conditions, respectively. e Absolute numbers of CD4+T (CD45+CD3+CD4+) cells in spinal cord isolated from EAE mice on 0, 10, 18, and 25 dpi (n = 5 per group). f Absolute numbers of IL-17+-secreting CD4+T (Th17), interferon γ+-secreting CD4+T cells (Th1), and IL-17+ interferon γ+ CD4+T cells in the spinal cord of EAE mice at 25 dpi (n = 6 per group). g Absolute numbers of microglia (MG: CD45lowCD11b+) in the spinal cord at 25 dpi (n = 5 per group). Each dot represents averaged data per animal. Data are represented as mean ± SEM. Two-tailed Student’s t-test, *P < 0.05. Exact P values for asterisks (from left to right): b 0.0497, 0.0172, 0.0050; c 0.0456, 0.0013; d 0.0478, 0.0164, 0.0470; e 0.005, 0.0004, 0.0062; f 0.045, 0.022, 0.021; and g 0.0140.
Fig. 3
Fig. 3. Severe neuron damage in ELT-EAE mice.
a, b Golgi–Cox stained lumbar spinal cord sections of EAE mice isolated at 30 dpi (a) with quantification of area stained/per field (b) (Cont naïve: n = 3, ELT naïve: n = 4, Cont EAE: n = 3, ELT-EAE: n = 3). c, d CRSR imaging of Golgi–Cox-stained dendrites in lumbar spinal cord ventral horn region (c) with quantification of dendritic spine density at 30 dpi (d) (n = 3 animals/group, 60 dendrites/group). e FluoroJade-C-stained lumbar spinal cord sections of EAE mice isolated at 20 dpi with quantification of area stained/per field (Cont EAE: n = 7, ELT-EAE: n = 4). f ChAT+ neuron-stained lumbar spinal cord sections of EAE mice isolated at 30 dpi (n = 3 per group). g Representative image of Iba1+ cells in spinal cord ventral horn at 30 dpi. Representative image was randomly selected from pooled images from two independent staining experiments. h Iba1+ cell count categorized by soma size in the lumbar spinal cord ventral horn (L5–6) at 30 dpi (n = 3 per group). Each dot represents averaged data per animal. Data are represented as mean ± SEM. Two-tailed Student’s t-test, *P < 0.05. Exact P values for asterisks (from left to right): b 0.0005, 0.0350; d 0.0382, 0.0102; e 0.0007; f 0.0007, 0.0072; h 0.0204.
Fig. 4
Fig. 4. ELT-EAE mice are interferon-β resistant.
a, b Mean clinical EAE scores of control EAE and ELT-EAE male (a) and female (b) mice with or without interferon β (IFNβ) treatment (Male Cont-Vehicle: n = 8, Male Cont-IFNβ: n = 10, Male ELT-Vehicle: n = 5, Male ELT-IFNβ: n = 5, Female Cont-Vehicle: n = 5, Female Cont-IFNβ: n = 7, Female ELT-Vehicle: n = 5, Female ELT-IFNβ: n = 5). Interferon-β was treated from 0 to 10 dpi every other day. All data represent mean ± SEM. Two-tailed Student’s t-test, *P < 0.05. Exact P values for asterisks are derived from AUC (from left to right): a <0.0001, b <0.0001.
Fig. 5
Fig. 5. Distinct immune markers in ELT-EAE mice.
a EAE scores after EAE induction in control- and ELT mice of wild type and Asc−/− mice (Cont-WT: n = 4, Cont-Asc−/−: n = 5, ELT-WT: n = 6, ELT-Asc/−: n = 5). b Serum levels of IL-1β at 10 dpi (Cont naïve: n = 4, ELT naïve: n = 4, Cont EAE: n = 3, ELT-EAE: n = 3). c Percentage of mLT-expressing dendritic cells (DC) at 10 dpi (n = 3 animals/group). d Expression of Lta and Ltbr mRNA in DC obtained from lymph nodes of control EAE and ELT-EAE mice at 10 dpi (n = 5 animals/group). e Percentage of unmethylated CpG sites in the promoter region of LT gene in dendritic cells isolated from lymph nodes of control and ELT mice without EAE at 10 dpi (n = 18 colonies). f Percentage of CXCR2-expressing CD4+T cells at 10 dpi (Cont naïve: n = 5, ELT naïve: n = 5, Cont EAE: n = 3, ELT-EAE: n = 3). g Serum levels of CXCL1 at 10 dpi (n = 4 animals/group). h EAE score of mice treated with CXCR2 inhibitor SB225002 (SB) or saline (Cont-Vehicle: n = 5, Cont-SB: n = 5, ELT-Vehicle: n = 6, ELT-SB: n = 9). Male mice were used for experiments. Each dot represents averaged data per animal. Data are represented as mean ± SEM. Two-tailed Student’s t-test, *P < 0.05. Exact P values for asterisks (from left to right): a 0.0131; b 0.0032; c 0.0449; d 0.0252, 0.0447; e 0.0210; f 0.0221; g 0.0088; and h 0.0084.
Fig. 6
Fig. 6. ELT downregulates adrenergic signaling in immune cells.
a Plasma levels of norepinephrine (NE) in 2-, 4-, and 6-week-old control and ELT mice (Cont-2wk-old: n = 5, Cont-4wk-old: n = 7, Cont-6wk-old: n = 8, ELT-2wk-old: n = 4, ELT-4wk-old: n = 4, ELT-6wk-old: n = 9). b Inguinal and axillary lymph node levels of norepinephrine (NE) in 4-week-old control and ELT mice (n = 3 animals/group). c, d Number of c dendritic cells (DC, n = 7 animals/group) and d CD4+T cells (n = 8 animals/group) expressing adrenergic receptors: α1, α2, β1, and β2 in lymph nodes of 3–4-week-old control and ELT mice. e, f Amount of cAMP derived from DC and CD4+T cells treated with vehicle or β1-AR agonist (Cont-DC-Veh: n = 7, ELT-DC-Veh: n = 5, Cont-DC-β1 agonist: n = 7, ELT-DC-β1 agonist: n = 5, Cont-CD4+T-Veh: n = 6, ELT-CD4+T-Veh: n = 5, Cont-CD4+T-β1 agonist: n = 8, ELT-CD4+T-β1 agonist: n = 5). Immune cells were isolated from control and ELT mice without EAE. Male mice were used for experiments. Each dot represents averaged data per animal. Data are represented as mean ± SEM. Student’s t-test, *P < 0.05. Exact P values for asterisks (from left to right): a 0.0093, 0.0239; b 0.0353; c 0.0068, 0.0245, 0.0041, 0.0446; d 0.0009, 0.0335, 0.0008, 0.0080; e 0.0017, 0.0435; and f 0.0293, 0.0111.
Fig. 7
Fig. 7. β1 adrenergic receptor antagonism is sufficient to reproduce the ELT-induced EAE phenotypes.
a EAE scores of control mice with intraperitoneal injections of α1-AR antagonist (prazosin, 5 mg/kg), α2-AR antagonist (atipamezole, 5 mg/kg), or β-AR antagonist (propranolol, 5 mg/kg) with vehicle control (n = 4 animals/group). All drugs were treated from 0 to 10 dpi every other day. b EAE scores of IFNβ-treated control EAE mice subjected to β-AR antagonist (propranolol, 5 mg/kg), β1-AR antagonist (metoprolol tartrate, 5 mg/kg), β2-AR antagonist (ICI 118,55, 1 mg/kg), or vehicle treatment (β-AR antagonist-Veh: n = 5, β-AR antagonist-IFNβ: n = 5, β1-AR antagonist-Veh: n = 5, β1-AR antagonist-IFNβ: n = 6, β2-AR antagonist-Veh: n = 4, β2-AR antagonist-IFNβ: n = 4). c Representative images stained quantification of Golgi–Cox staining in the ventral lumbar spinal cord region of vehicle-treated and β1-AR antagonist-treated control EAE mice at 30 dpi. Quantification of area stained by Golgi–Cox (n = 3 animals/group). d Amount of cytokines IL-17, interferon γ (IFNγ), and GM-CSF in supernatant derived from culture conditions 72 h post culture initiation. CD4+T cells were isolated from draining lymph nodes of control EAE mice and mice subjected to β1-AR antagonist (n = 3 animals/group). e Percentages of mLT-expressing lymph node DCs and CXCR2-expressing CD4+T cells from EAE mice with β1-AR antagonist or vehicle treatment (n = 5 animals/group). f Serum levels of CXCL1 at 10 dpi (n = 4 animals/group). Male mice were used for experiments. Each dot represents averaged data per animal. Data are represented as mean ± SEM. Student’s t-test, *P < 0.05. Exact P values for asterisks (from left to right): a 0.0004; b <0.0001; c 0.0498; 0.0318; d 0.0462, <0.0001, 0.0322; e 0.0032, 0.0048; f 0.0034.
Fig. 8
Fig. 8. β1-AR agonist treatment is sufficient to rescue ELT-EAE subtype.
a EAE scores of IFNβ-treated ELT-EAE mice subjected to β1-AR agonist (Xamoterol, 3 mg/kg) treatment (ELT-β1-AR agonist-Veh: n = 4, ELT-β1-AR agonist-IFNβ: n = 8). Interferon-β was treated from 0 to 9 dpi once every 3 days. Xamoterol was treated from 0 to 10 dpi every other day. b Absolute number of mLT-expressing lymph node DCs and CXCR2-expressing CD4+T cells from EAE mice with β1-AR agonist or vehicle treatment (n = 5 animals/group). c Golgi–Cox-stained lumbar spinal cord sections of ELT-EAE mice treated either with vehicle or with β1-AR agonist isolated at 30 dpi with quantification of area stained/per field (n = 5 animals/group). d EAE scores of IFNβ-treated control β1-AR fl ELT-EAE mice, dendritic cell (DC)-specific β1-AR knockout ELT-EAE mice, and T cell-specific β1-AR knockout ELT-EAE mice subjected to β1-AR agonist (Xamoterol, 3 mg/kg) treatment (ELT-β1-AR agonist-Cont-Veh: n = 5, ELT-β1-AR agonist-Cont-IFNβ: n = 5, ELT-β1-AR agonist-DC-β1KO-Veh: n = 5, ELT-β1-AR agonist-DC-β1KO-IFNβ: n = 7, ELT-β1-AR agonist-T-β1KO-Veh: n = 5, ELT-β1-AR agonist-T-β1KO-IFNβ: n = 5). Interferon-β was treated from 0 to 9 dpi once every 3 days. Xamoterol was treated from 0 to 10 dpi every other day. e Absolute number of mLT-expressing lymph node DCs and CXCR2-expressing CD4+T cells from control β1-AR fl ELT-EAE mice, DC-specific β1-AR knockout ELT-EAE mice, and T cell-specific β1-AR knockout ELT-EAE mice subjected to β1-AR agonist (Xamoterol, 3 mg/kg) treatment (n = 4 animals/group). f Golgi–Cox-stained lumbar spinal cord sections of β1-AR agonist treated ELT-EAE mice of different transgene knockout conditions at 30 dpi with quantification of area stained/per field (ELT-β1-AR agonist-Cont: n = 3, ELT-β1-AR agonist-DC-β1KO: n = 5, ELT-β1-AR agonist-T-β1KO: n = 5). Male mice were used for experiments. Each dot represents averaged data per animal. Data are represented as mean ± SEM. Student’s t-test, *P < 0.05. Exact P values for asterisks (from left to right): a 0.0027; b 0.0258, 0.0131, 0.0223, 0.0159; c 0.0135; d 0.0054; e 0.0110, 0.0145, 0.0033, 0.0244; and f 0.0077.
Fig. 9
Fig. 9. β1-AR agonist treatment prevents upregulation of mLT in BMDC.
a Relative expression of Lta mRNA in BMDC treated with adrenergic agonists and/or LPS and Mtb in vitro (n = 3 per group). Vehicle or AR agonists (100 µM) were pretreated to BMDC for 18 h. Then LPS (1 µg/ml) or heat-killed Mtb (100 µg/ml) was treated for 3 h. b Representative western blot and quantification for TRAF3 in BMDC 18 h after vehicle or β1-AR agonist (100 µM). n = 5 replicates/group. Each dot represents averaged data per animal. Data are represented as mean ± SEM. Student’s t-test, *P < 0.05. Exact P values for asterisks (from left to right): a 0.0042, 0.0249; b 0.0415.

References

    1. Hunter SF. Overview and diagnosis of multiple sclerosis. Am. J. Manag Care. 2016;22:s141–s150. - PubMed
    1. Quintana FJ, et al. Antigen microarrays identify unique serum autoantibody signatures in clinical and pathologic subtypes of multiple sclerosis. Proc. Natl Acad. Sci. USA. 2008;105:18889–18894. doi: 10.1073/pnas.0806310105. - DOI - PMC - PubMed
    1. Lassmann H, Bruck W, Lucchinetti C. Heterogeneity of multiple sclerosis pathogenesis: implications for diagnosis and therapy. Trends Mol. Med. 2001;7:115–121. doi: 10.1016/S1471-4914(00)01909-2. - DOI - PubMed
    1. Disanto G, et al. Heterogeneity in multiple sclerosis: scratching the surface of a complex disease. Autoimmune Dis. 2010;2011:932351. - PMC - PubMed
    1. Cepok S, et al. Identification of Epstein-Barr virus proteins as putative targets of the immune response in multiple sclerosis. J. Clin. Invest. 2005;115:1352–1360. doi: 10.1172/JCI200523661. - DOI - PMC - PubMed

Publication types

MeSH terms