. 2021 Jan 4;7(1):1.
doi: 10.1038/s41514-020-00054-3.

Mitochondrial health is enhanced in rats with higher vs. lower intrinsic exercise capacity and extended lifespan

Affiliations

Mitochondrial health is enhanced in rats with higher vs. lower intrinsic exercise capacity and extended lifespan

Miguel A Aon et al. NPJ Aging Mech Dis. .

Abstract

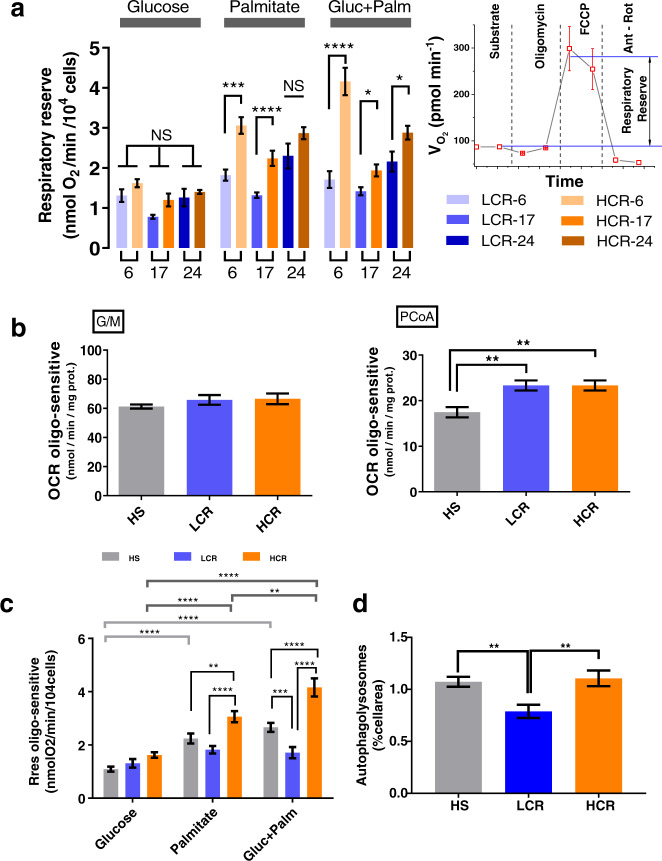
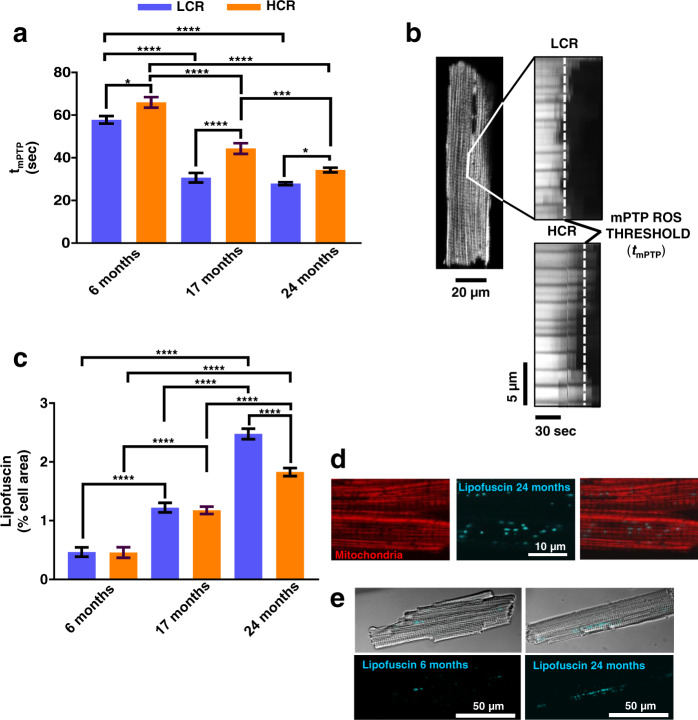
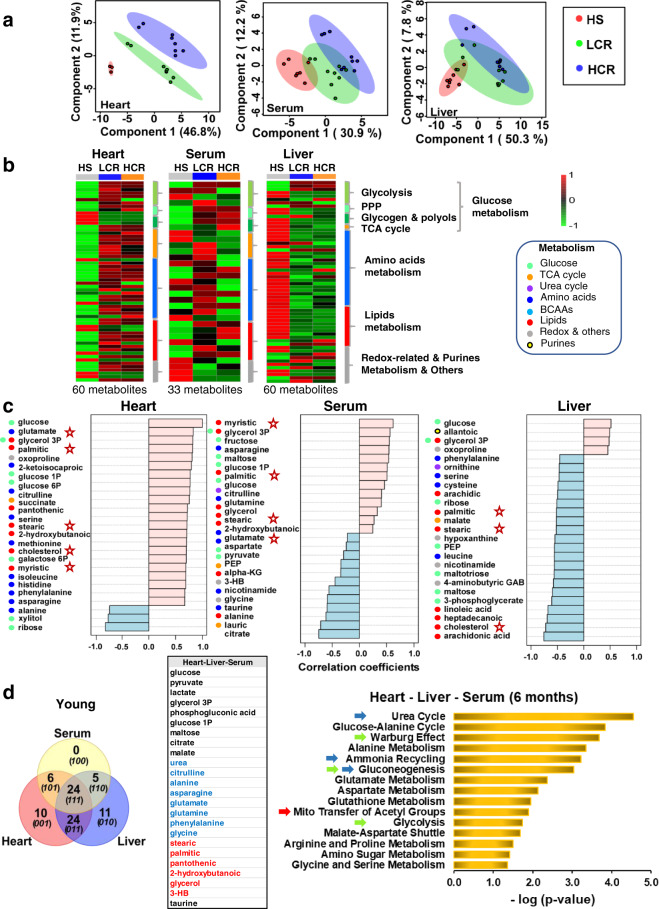
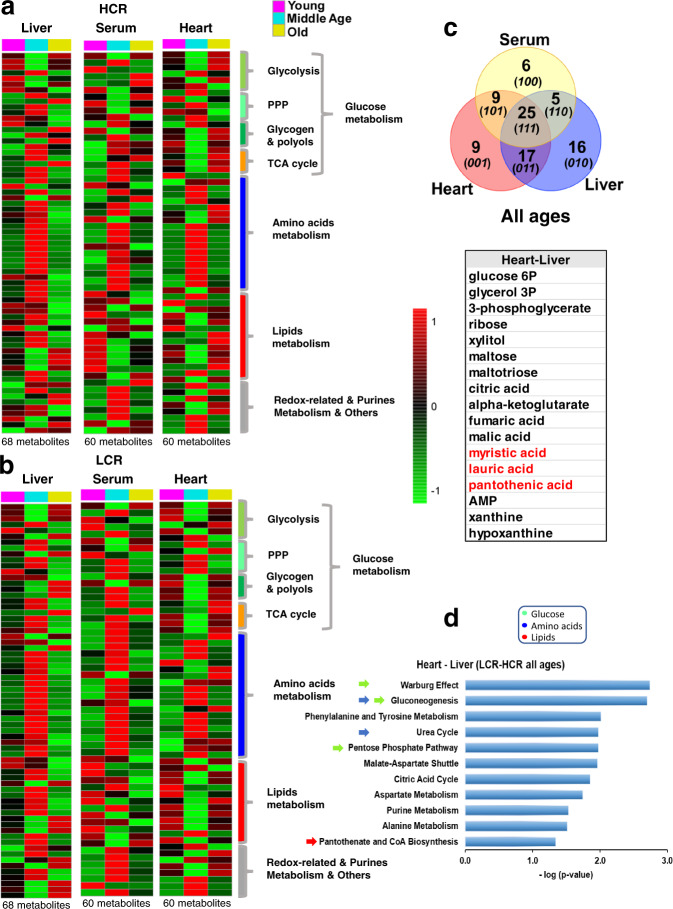
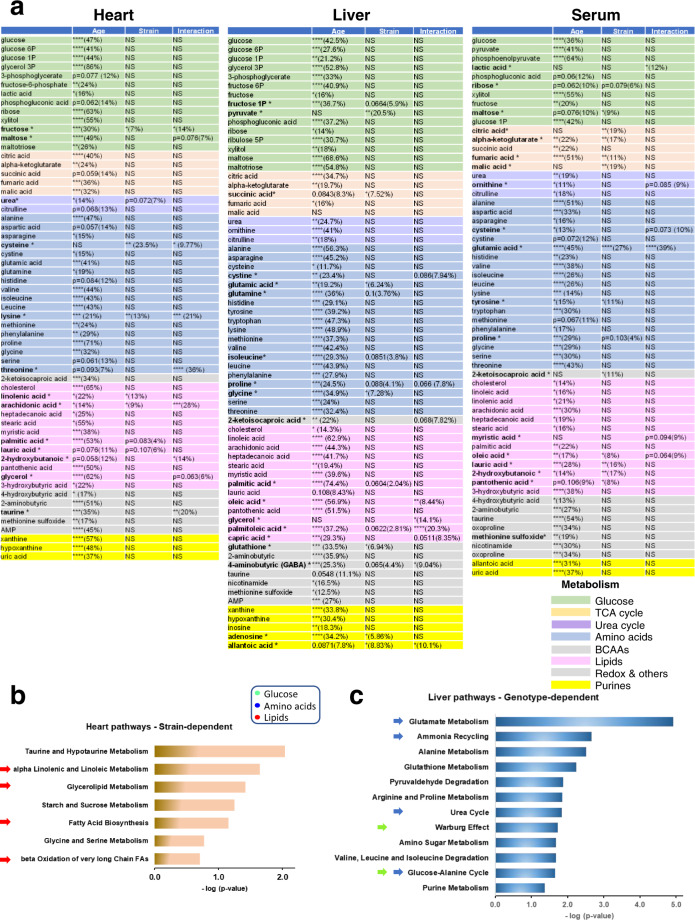
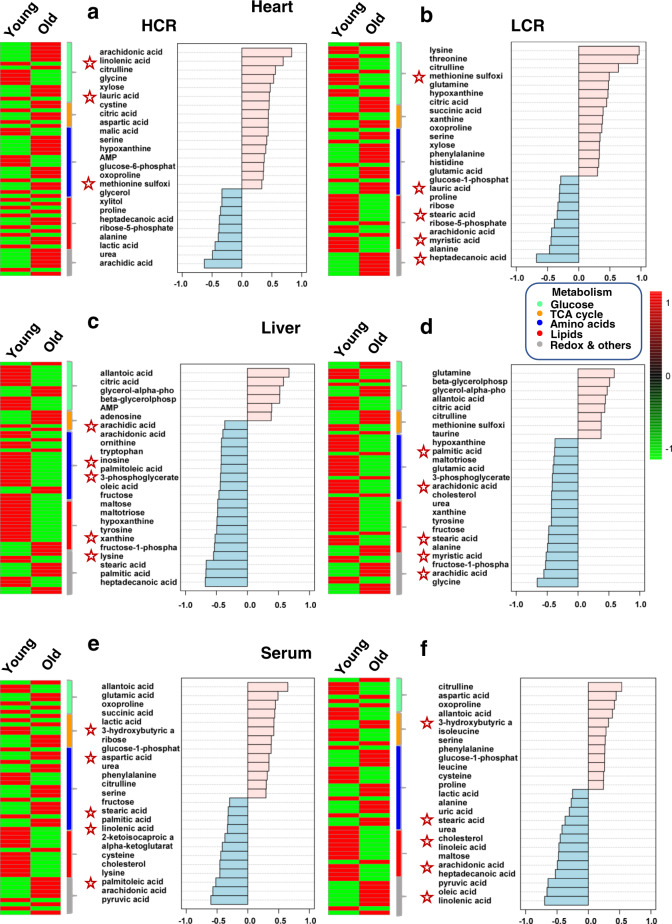
The intrinsic aerobic capacity of an organism is thought to play a role in aging and longevity. Maximal respiratory rate capacity, a metabolic performance measure, is one of the best predictors of cardiovascular- and all-cause mortality. Rats selectively bred for high-(HCR) vs. low-(LCR) intrinsic running-endurance capacity have up to 31% longer lifespan. We found that positive changes in indices of mitochondrial health in cardiomyocytes (respiratory reserve, maximal respiratory capacity, resistance to mitochondrial permeability transition, autophagy/mitophagy, and higher lipids-over-glucose utilization) are uniformly associated with the extended longevity in HCR vs. LCR female rats. Cross-sectional heart metabolomics revealed pathways from lipid metabolism in the heart, which were significantly enriched by a select group of strain-dependent metabolites, consistent with enhanced lipids utilization by HCR cardiomyocytes. Heart-liver-serum metabolomics further revealed shunting of lipidic substrates between the liver and heart via serum during aging. Thus, mitochondrial health in cardiomyocytes is associated with extended longevity in rats with higher intrinsic exercise capacity and, probably, these findings can be translated to other populations as predictors of outcomes of health and survival.


Conflict of interest statement

The authors declare no competing interests.

Figures

Fig. 1
Fig. 1. Respiratory reserve (Rres) in isolated cardiomyocytes from HCR and LCR as a function of substrate and age.
a Rres, defined as the difference between the oxygen consumption rate (OCR) OCRFCCP minus the OCRsubstr (inset; see also Supplementary Fig. 1), was quantified in ventricular cardiomyocytes isolated from HCR or LCR rats at the indicated ages (6, 17, or 24 months old). Cardiomyocytes were assayed in the presence of 5 mM glucose or 0.2 mM palmitate bound to fatty acid-free bovine serum albumin, 4 : 1, or the combination of both substrates added in the first part of the assay (marked as substrate in the inset) before subsequent additions as described in “Cardiomyocytes isolation and high-throughput respiratory measurements” in “Methods”. See related Supplementary Fig. 1 for OCR measurements, full experimental design, experiments/n-values, and Supplementary Figs 2 and 3 for additional two-way ANOVA with Tukey’s multiple comparison test (GraphPad Prism 8.0) and all data points. b OCR-oligomycin sensitive obtained with mitochondria isolated from the hearts of 6-month-old HS (3 rats/experiments, n = 62), LCR (4 rats/experiments, n = 85), or HCR (4 rats/experiments, n = 90) rats, and assayed in the presence of glutamate/malate (G/M) or palmitoyl CoA (PCoA)/malate as detailed in “Methods”. See related Supplementary Fig. 5 including all data points. The statistical analysis corresponds to one-way ANOVA with Tukey’s multiple comparison test (GraphPad Prism 8.0). c Rres of cardiomyocytes isolated from 6-month-old HS (3 rats/experiments, n = 66–72), LCR (4 rats/experiments, n = 37–47), or HCR (4 rats/experiments, n = 37–48) rats, as indicated in the presence of glucose or palmitate or their combination (see “Methods” for details and related Supplementary Fig. 6). Two-way ANOVA analysis with Tukey’s multiple comparison test was performed with GraphPad Prism 8.0 using substrate and strain as factors. d Autophagy in cardiomyocytes isolated from 6-month-old HS (3 rats/experiments, n = 78), LCR (4 rats/experiments, n = 52), or HCR (4 rats/experiments, n = 53) rats (see “Methods” for details and related Supplementary Fig. 7a, which, in addition, shows measurements of tmPTP (Supplementary Fig. 7b) and lipofuscin (Supplementary Fig. 7c). The statistical analysis corresponds to one-way ANOVA with Tukey’s multiple comparison test (GraphPad Prism 8.0). In all cases, data are represented as mean ± SEM and the statistical significance is indicated by *p < 0.05; **p < 0.01; ***p < 0.001; ****p < 0.0001; NS not significant. FCCP Trifluoromethoxy carbonylcyanide phenylhydrazone.
Fig. 2
Fig. 2. Confocal live fluorescence imaging and electron microscopy (EM) of autophagy/mitophagy in LCR and HCR cardiomyocytes during aging.
a Depicted are the levels of autophagy/mitophagy quantified as % cell area covered by autophagy vesicles in isolated cardiomyocytes from 6 (LCR: 4 rats/experiments, n = 54; HCR: 4 rats/experiments, n = 53), 17 (LCR: 4 rats/experiments, n = 66; HCR: 5 rats/experiments, n = 70), and 24 (LCR: 5 rats/experiments, n = 94; HCR: 7 rats/experiments, n = 112) months old rats, using high-resolution confocal microscopy of formed autophagic vesicles labeled by the fluorescent CYTO-ID for autophagy detection (green) according to manufacturer’s instructions (see “Confocal fluorescence imaging” and “Electron microscopy” in “Methods”) and mitochondrial staining with 100 nM TMRM (red). See related Supplementary Fig. 8a for additional two-way ANOVA with Tukey’s multiple comparison test (GraphPad Prism 8.0) and all data points. b Quantification of total autophagy/mitophagy figures (autophagosomes [early] + autophagolysosomes [late]) observed by EM and normalized with respect to the cell volume using stereological procedures (see “Confocal fluorescence imaging” and “Electron microscopy” in “Methods”) in samples of LCR and HCR cardiomyocytes from 6 (LCR: 2 rats/experiments, n = 40; HCR: 2 rats/experiments, n = 40), 17 (LCR: 2 rats/experiments, n = 48; HCR: 2 rats/experiments, n = 47), and 24 (LCR: 2 rats/experiments, n = 37; HCR: rats/experiments, n = 35) months old rats. c Quantification of autophagic flux (late/(early + late)) figures observed by EM in samples of LCR and HCR cardiomyocytes from 6 (LCR: 2 rats/experiments, n = 38; HCR: 2 rats/experiments, n = 35; NS, p = 0.14), 17 (LCR: 2 rats/experiments, n = 49; HCR: 2 rats/experiments, n = 41; NS, p = 0.34), and 24 (LCR: 2 rats/experiments, n = 38; HCR: 2 rats/experiments, n = 27; NS, p = 0.17) months old rats. For b, c, see Supplementary Fig. 9a, b for additional two-way ANOVA with Tukey’s multiple comparison test (GraphPad Prism 8.0) and all data points. d Representative examples of cardiomyocytes; clockwise, from top left: CYTO-ID-stained autophagic vesicles, TMRM, transmission light microscopy, merge, and detailed (zoomed) image of a cardiomyocyte: CYTO-ID-stained autophagic vesicles, TMRM, transmission light microscopy, merge. e Representative electron micrographs of autophagy/mitophagy figures in cardiomyocytes isolated from LCR and HCR hearts at the indicated ages. Bar size = 0.5 µm in all panels. “Early” figures of autophagosomes (depicted in A, B, E, F, I, J) were identified by its content (morphologically intact, mostly mitochondria) and a double limiting membrane separated by a narrow electron-lucent cleft. “Late” figures of autophagolysosomes (depicted in C, D, G, H, K, L), delimited by single membranes, represent an advanced stage of autophagosomes where a lysosome has merged, and the content comprises partially degraded, irregular, electron-dense or pale material depending upon time of formation. f Interpretative scheme of autophagy/mitophagy describing the stages of this process measured by EM quantification. In all cases, data are represented as mean ± SEM. The statistical significance is indicated by *p < 0.05; **p < 0.01; ***p < 0.001; ****p < 0.0001; NS not significant.
Fig. 3
Fig. 3. Confocal live fluorescence imaging of mitochondrial fitness and lipofuscin in LCR and HCR cardiomyocytes during aging.
a mPTP-ROS threshold (tmPTP) as index of mitochondrial fitness was quantified in isolated TMRM-loaded cardiomyocytes from 6 (LCR: 4 rats/experiments, n = 47; HCR: 4 rats/experiments, n = 46), 17- (LCR: 4 rats/experiments, n = 44; HCR: 5 rats/experiments, n = 44), and 24 (LCR: 5 rats/experiments, n = 79; HCR: 7 rats/experiments, n = 91) months old rats, using high-resolution confocal fluorescent microscopy. tmPTP reflects the average time required for the photoproduced ROS to cause mPTP opening induction. b Representative example of tmPTP determination in LCR vs. HCR cardiomyocytes. c Lipofuscin quantification as % cell area covered by progressive age-dependent accumulation of lipofuscin as revealed by autofluorescence of cardiomyocytes from 6 (LCR: 3 rats/experiments, n = 55; HCR: rats/experiments, n = 56), 17 (LCR: 2 rats/experiments, n = 33; HCR: 2 rats/experiments, n = 34), and 24 (LCR: 5 rats/experiments, n = 80; HCR: 5 rats/experiments, n = 97) months old rats. d Zoomed image showing, in detail, accumulated lipofuscin as visualized by autofluorescence (blue) and TMRM-loaded mitochondria (red), and e representative examples of cardiomyocytes, full-scale, at 6 and 24 months of age. In all cases, data are represented as mean ± SEM. The statistical significance is indicated by *p < 0.05; **p < 0.01; ***p < 0.001; ****p < 0.0001; NS not significant.
Fig. 4
Fig. 4. Systems metabolomics of heart, serum, and liver in 6 months age HS, LCR, and HCR rats.
Untargeted metabolomics performed in young (6 months) age rat: heart (HS, n = 3; HCR, n = 8; LCR, n = 8), liver (HS, n = 8; HCR, n = 9; LCR, n = 9), and serum (HS, n = 7; HCR, n = 9; LCR, n = 9) samples. a Partial least-square discriminant analysis (PLS-DA) of significantly changed metabolites from the heart (left), serum (mid), and liver (right). b Average heatmaps of significantly changed metabolites from the heart (left), serum (middle), and liver (right) of HS (left lane), LCR (middle lane), and HCR (right lane) displayed as accumulation (red) or depletion (green) according to the pseudocolor scale on the right of the maps. The brackets and legend on the right of the heatmaps indicate the main metabolic pathways to which the metabolites belong. See also related Supplementary Fig. 10. c Correlation pattern plots highlighting the 25 most significantly changing metabolites for sequentially arranged HS-LCR-HCR meaning that the accumulation/depletion patterns correspond to HCR. Metabolite groups are denoted by different colors. Stars denote metabolites that are shunted between liver and heart according to the patterns of depletion/accumulation. d Venn diagrams of unique and shared metabolites between the heart, liver, and serum from HS-LCR-HCR at young (6 months) age (left panels) and bar graph of significantly enriched pathways (p < 0.05; right panel) by the “core” metabolome constituted by 24 shared metabolites, independently from organ and strain (middle table). For analysis details, see “Bioinformatic and statistical analyses” in “Methods”.
Fig. 5
Fig. 5. Cross-sectional heatmaps of significantly changed metabolites from heart, serum, and liver in HCR and LCR rats as a function of age.
Average heatmaps of significantly changed metabolites from HCR (a) and LCR (b) in the heart at young, 6 months (HCR, n = 8; LCR, n = 8), middle, 17 months (HCR, n = 7; LCR, n = 8), and old, 24 months (HCR, n = 6; LCR, n = 6) age; the liver at young, 6 months (HCR, n = 9; LCR, n = 9), middle, 17 months (HCR, n = 10; LCR, n = 11), and old, 24 months (HCR, n = 9; LCR, n = 8) age; and serum at young, 6 months (HCR, n = 9; LCR, n = 9), middle, 17 months (HCR, n = 8; LCR, n = 8), and old, 24 months (HCR, n = 9; LCR, n = 8) age, ordered according to metabolic pathways. The pseudocolor scale (1 to −1 on the right of the heatmaps) reflects accumulation (red) or depletion (green) for each tissue at each age. See also related Supplementary Figs 11 and 12. c Venn diagrams of the unique and shared significant metabolites from serum and heart-liver of LCR-HCR across ages. The table (bottom) shows the 17 metabolites shared by the heart and liver, independently from strain and age, which were subjected to pathways enrichment analysis. d Bar graph of enriched pathways (p < 0.05) by significant metabolites shared by heart and liver. For analysis details, see “Bioinformatic and statistical analyses” in “Methods”.
Fig. 6
Fig. 6. Comparative two-way ANOVA analysis of significantly changed metabolites in the heart–liver–serum of HCR and LCR, and the % of their variance influenced by age, strain, or their interaction.
a Using two-way ANOVA analysis of significantly changed metabolites as a function of age, we determined the relative role of age vs. strain in all three organs. The relative significance of the influence exerted by age (young, middle, and old), genotype (HCR and LCR), and their interaction was determined in the heart, liver, and serum (top, left, middle and right tables, respectively). The color shading indicates the metabolic pathways to which metabolites belong, according to the legend at the bottom right. As most metabolic intermediates show variations with age, an #, next to the metabolite name, has been added to highlight the metabolites displaying significant differences due to the strain or the interaction between age and strain. Two-way ANOVA analysis with Tukey’s multiple comparison test was performed with GraphPad Prism 8.0 using age and strain as factors. In all cases, the statistical significance is indicated by *p < 0.05; **p < 0.01; ***p < 0.001; ****p < 0.0001, and the percentage of the variance due to the factor (age or strain) is expressed between brackets. Also, if 0.1 > p > 0.05, the p-value is informed together with the percent of variance. Number of experiments and n-values are informed in the legend of Fig. 5. b, c Bar graphs of significantly enriched pathways (p < 0.05) by strain-dependent metabolites in the heart (b) and liver (c). Pathways enrichment analysis was performed with the module “Pathways Analysis” of MetaboAnalyst 4.0, a web-based resource for metabolomics analysis (see “Bioinformatic and statistical analyses” in “Methods”).
Fig. 7
Fig. 7. Comparative metabolomics of HCR vs. LCR, young vs. old, in the heart, liver and serum.
Displayed are the average heatmaps and correlation plots of significantly changed metabolites in a, b the heart, c, d liver, and e, f serum from HCR (a, c, e) and LCR (b, d, f). In the correlation plots, the 25 most significantly changed metabolites (positively, in pink, or negatively, in light blue) are shown, according to the transition sequence young-old, meaning which metabolites tend to increase or decrease with old age in LCR or HCR in the respective organ. Stars highlight metabolites of significance mentioned in the main text. n-values corresponding to the different strains and organs at young and old age are informed in the legend of Fig. 5. See also related Supplementary Figs 13–15.

References

    1. Koch LG, et al. Intrinsic aerobic capacity sets a divide for aging and longevity. Circ. Res. 2011;109:1162–1172. doi: 10.1161/CIRCRESAHA.111.253807. - DOI - PMC - PubMed
    1. Hill AV. The physiological basis of athletic records. Nature. 1925;116:544–548. doi: 10.1038/116544a0. - DOI
    1. Gabriel BM, Zierath JR. The limits of exercise physiology: from performance to health. Cell Metab. 2017;25:1000–1011. doi: 10.1016/j.cmet.2017.04.018. - DOI - PubMed
    1. Hawley JA, Hargreaves M, Joyner MJ, Zierath JR. Integrative biology of exercise. Cell. 2014;159:738–749. doi: 10.1016/j.cell.2014.10.029. - DOI - PubMed
    1. Weibel ER, Hoppeler H. Exercise-induced maximal metabolic rate scales with muscle aerobic capacity. J. Exp. Biol. 2005;208:1635–1644. doi: 10.1242/jeb.01548. - DOI - PubMed

LinkOut - more resources