. 2021 Jan 4;4(1):30.
doi: 10.1038/s42003-020-01516-w.

miR-379 deletion ameliorates features of diabetic kidney disease by enhancing adaptive mitophagy via FIS1

Affiliations

miR-379 deletion ameliorates features of diabetic kidney disease by enhancing adaptive mitophagy via FIS1

Mitsuo Kato et al. Commun Biol. .

Erratum in

Abstract

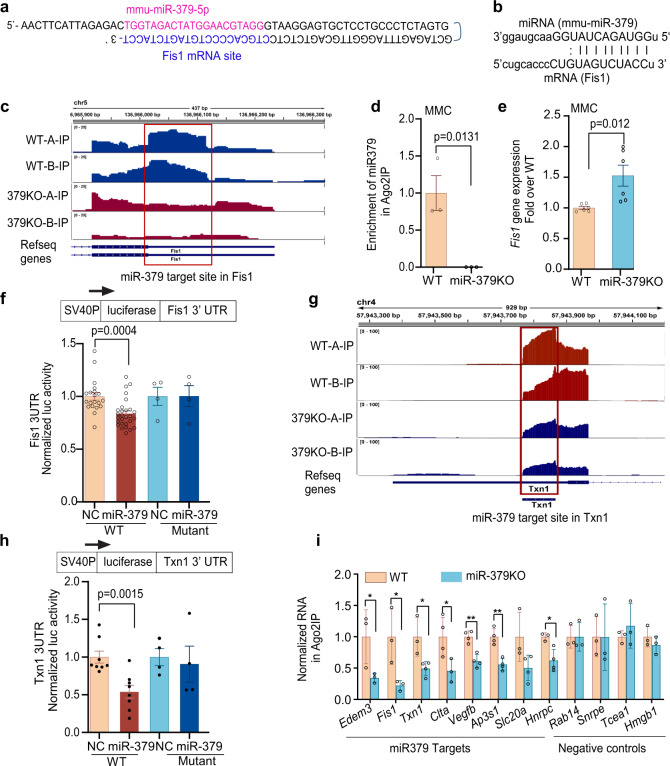
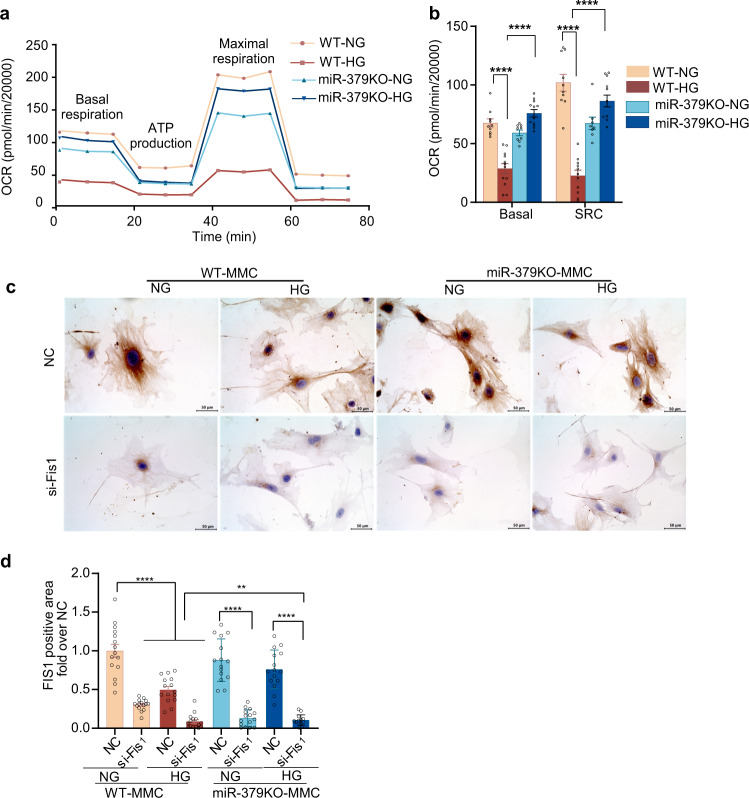
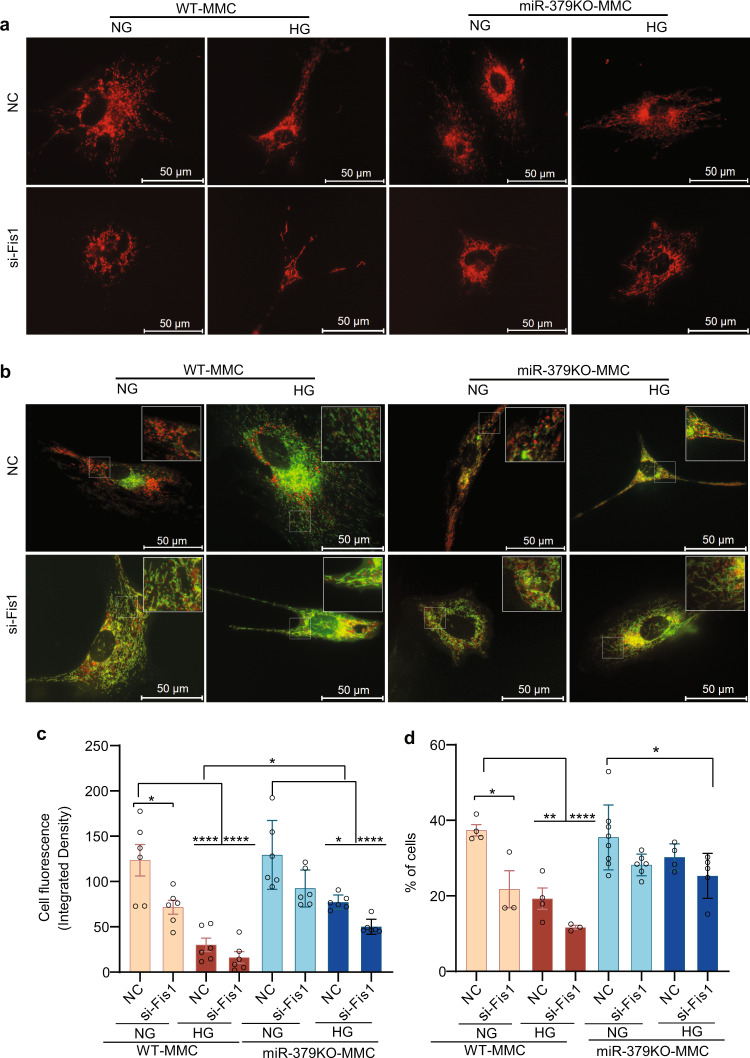
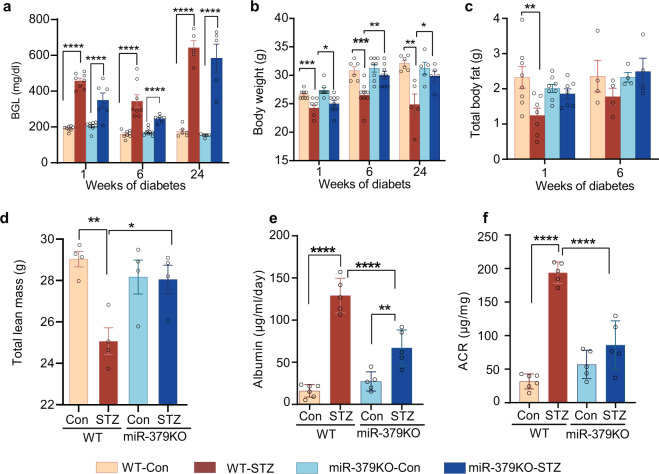
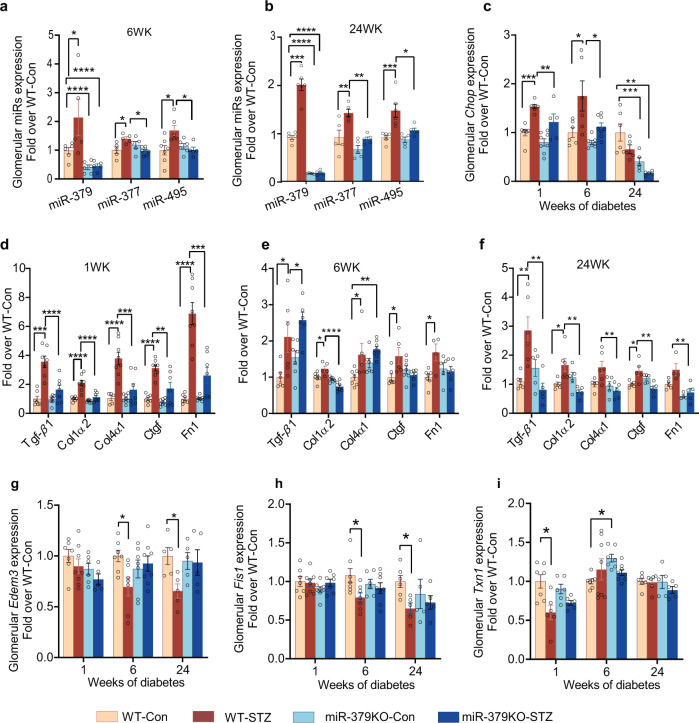
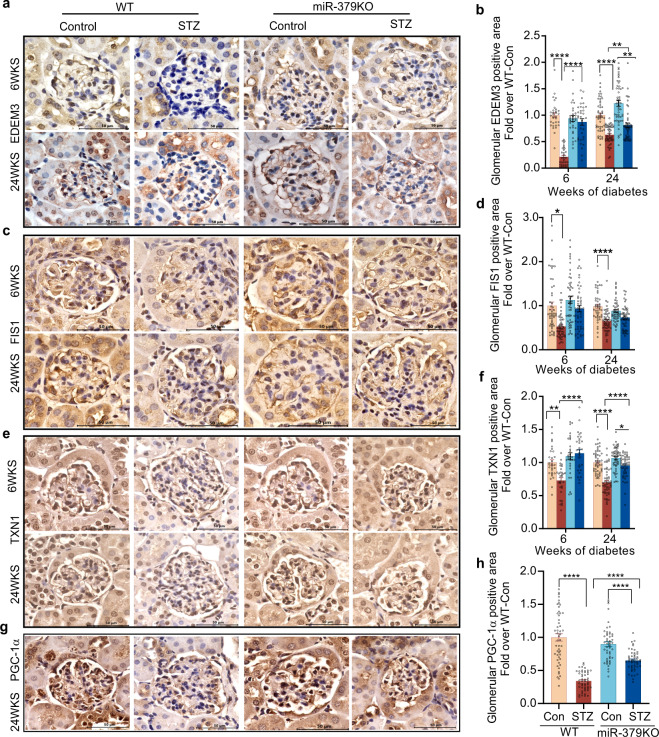
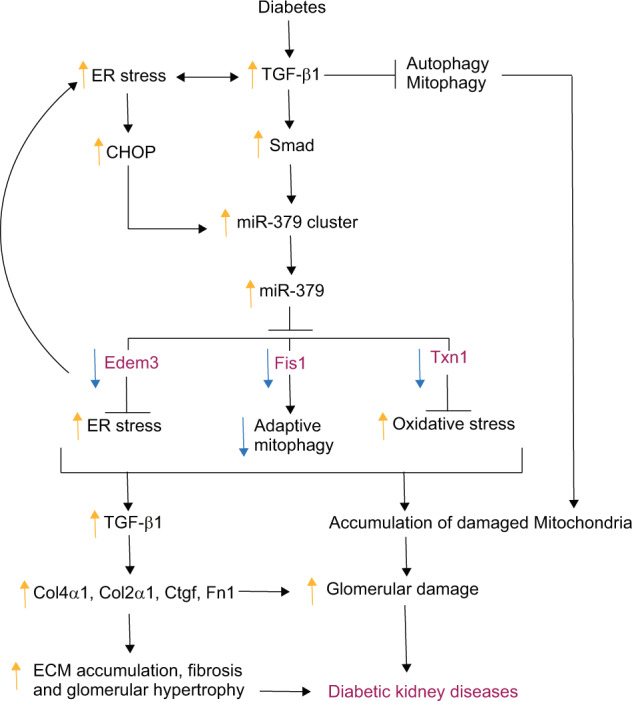
Diabetic kidney disease (DKD) is a major complication of diabetes. Expression of members of the microRNA (miRNA) miR-379 cluster is increased in DKD. miR-379, the most upstream 5'-miRNA in the cluster, functions in endoplasmic reticulum (ER) stress by targeting EDEM3. However, the in vivo functions of miR-379 remain unclear. We created miR-379 knockout (KO) mice using CRISPR-Cas9 nickase and dual guide RNA technique and characterized their phenotype in diabetes. We screened for miR-379 targets in renal mesangial cells from WT vs. miR-379KO mice using AGO2-immunopreciptation and CLASH (cross-linking, ligation, sequencing hybrids) and identified the redox protein thioredoxin and mitochondrial fission-1 protein. miR-379KO mice were protected from features of DKD as well as body weight loss associated with mitochondrial dysfunction, ER- and oxidative stress. These results reveal a role for miR-379 in DKD and metabolic processes via reducing adaptive mitophagy. Strategies targeting miR-379 could offer therapeutic options for DKD.


Conflict of interest statement

The authors declare no competing interests.

Figures

Fig. 1
Fig. 1. Generation of miR-379 knockout (KO) mice by CRISPR-Cas9 editing.
a Schematic genomic location of the miR-379 megacluster (MGC) of miRNAs (miR-379-3072) and structure of wild-type (WT) and miR-379 knockout (KO) mice. The miR-379 MGC is located on mouse chromosome 12 within the host lncRNA (lncMGC) and consists of ~40 miRNAs. miR-379 is the most 5′-miRNA, miR-495, miR-377, and miR-3072 are in the middle, and miR-882 is located far upstream of cluster. b Sequences of miR-379 genomic regions WT (upper) and KO (lower, 36 bp deletion). Positions of guide RNAs used for editing by CRISPR-Cas9 approach are shown by arrows. Sequences of mature miR-379 are represented in blue and the precursor miR-379 in pink. PAM sequences (NGG) are underlined. c Left, genotypes of WT and a founder (31F) mouse from tail DNA samples. The founder [31F (+/−), left panel] shows a 36 bp shorter PCR fragment (i.e., deletion of miR-379). Lane M: molecular weight markers. Right, germline transmission of miR-379 deletion. The female founder heterozygote (31F+/−) was crossed with a WT male and the deletion was transmitted to the next generation; multiple heterozygotes (+/−), WT, and/or miR-379 deletion are shown. Homozygotes (−/−, miR-379 deletion) were obtained by crossing heterozygous mice. The miR-379KO mouse colony was expanded by crossing the homozygous mice. d Significant decrease of glomerular miR-379 RNA expression in miR-379KO mice compared to WT mice (n = 5–6/group). Statistical analyses for two groups were performed by Student’s t-test. Data are presented as mean ± SEM.
Fig. 2
Fig. 2. Identification of miR-379 targets.
a Example of hybrid sequence of miR-379 in pink and Fis1 in blue. b Alignment of miR-379 and its target site in the Fis1 3′-UTR (miRanda; microRNA.org). c Enrichment of AGO2 IP-seq RNA reads at miR-379 target site in Fis1 3′-UTR in WT mouse mesangial cells (MMC), with notable reduction in miR-379KO MMC. Two independent samples (A and B) from WT MMC (WT-A-IP and WT-B-IP) and miR-379KO MMC (379KO-A-IP and, 379KO-B-IP) were examined. d Enrichment of miR-379 RNA in AGO-IP in MMC isolated from kidney glomeruli of WT mice and significant reduction in miR-379KO MMC (n = 3/group). e Significant increase of Fis1 gene expression in miR-379KO MMC compared to WT MMC, suggesting Fis1 is a target of miR-379 (n = 6/group). f Significant decrease of WT Fis1 3′-UTR luciferase reporter activity by transfection with miR-379 mimic oligonucleotide, compared to mutant Fis1 3′-UTR reporter under similar conditions, further supporting Fis1 3′-UTR to a true target of miR-379. g Enrichment of AGO2 IP-seq RNA reads at the 3′-UTR of Txn1 gene in WT MMC and its significant reduction in miR-379KO MMC. Two independent samples (A and B) from WT MMC (WT-A-IP and WT-B-IP) and miR-379KO MMC (379KO-A-IP and 379KO-B-IP) were examined. h Significant decrease of WT Txn1 3′-UTR luciferase reporter activity induced by miR-379 mimics, compared with no change in mutant Txn1 3′-UTR reporter by miR-379 mimics. NC, negative control mimic; miR-379, miR-379 mimic. i RT-qPCR validation of the expression of enriched candidate genes identified by AGO2 IP-seq. RNA expression of all eight candidate miR-379 targets tested was decreased in AGO2-IP from miR-379KO MMC compared to WT MMC. Rab14, Snrpe, Tcea1, and Hmgb1 were used as negative controls because their enrichments in AGO2 IP-seq were not significantly changed between miR-379KO and WT MMC. Each dot indicates one biological repeat. Statistical analyses for two groups were performed by Student’s t-test, and for multiple comparisons one-way ANOVA with Tukey’s post hoc test was used. *P < 0.05, **P < 0.01. All data are presented as mean ± SEM.
Fig. 3
Fig. 3. Mitochondrial function assays in MMC under normal and high-glucose conditions.
a Seahorse XF Cell Mito Stress test for mitochondrial function at basal conditions, ATP production, and maximal respiration levels using MMC from WT or miR-379KO mice cultured with normal glucose (NG, 5.5 mM) or high glucose (HG, 25 mM) for 72 h. b Oxygen consumption rates (OCRs) were calculated in basal and spare respiratory capacity (SRC) levels in NG and HG condition (20,000 cells per well of 96-well assay plate). c Representative images of IHC staining to detect FIS1 expression (brown color) in negative control (NC) and Fis1 siRNA (si-Fis1)-transfected MMC from WT or miR-379KO mice cultured with NG or HG. d Bar graph quantifications showing significant reduction in FIS1 levels in si-Fis1-transfected NG- or HG-treated WT and miR-379KO MMC compared to NC, and significant decrease in FIS1 levels in HG-treated WT MMC but not miR-379KO MMC (n = 15 cells/group). The in vitro experiments were performed with at least three biological replicates. One-way ANOVA with Tukey’s post hoc test for multiple comparisons. **P < 0.01, ****P < 0.0001. All data are presented as mean ± SEM. NC, negative control siRNA. si-Fis1, Fis1 siRNA.
Fig. 4
Fig. 4. Mitochondrial dysfunction and mitophagy assays in MMC under normal and high-glucose conditions.
a Representative images of WT and miR-379KO MMC transfected with the DsRed2-Mito-7 plasmid, which fluorescently labels mitochondria with red emission spectra (quantification in c). WT and miR-379KO MMC treated with NC siRNA or Fis1 siRNA were transfected with DsRed2-Mito-7 reporter. Upper panel (with NC siRNA): in HG conditions (25 mM glucose), mitochondrial signal intensity (red fluorescence) was significantly reduced compared to NG (5.5 mM glucose) conditions in both WT and miR-379KO MMC, but to a lesser extent in miR-379KO MMC. Lower panel: with si-Fis1: WT-MMC cells treated with si-Fis1 show decreased intensity in mitochondrial fluorescent signals in NG and HG conditions. miR-379KO MMC with si-Fis1 under HG conditions depicted more significant changes than under NG conditions. The degree of reduction of fluorescence (mitochondrial quality) under HG conditions was much lower in miR-379KO MMC compared to WT MMC. b Representative images showing adaptive mitophagy in MMC examined by expressing the pCLBW-cox8-EGFP-mCherry reporter (quantification in d). WT and miR-379KO MMC MMC treated with NC siRNA or Fis1 siRNA were transfected with pCLBW-cox8-EGFP-mCherry and then treated with HG (25 mM) or NG (5.5 mM) for 5 days at 37 °C and 5% CO2. Upper panels (with NC siRNA): adaptive mitophagy shows marked decrease in WT-MMC after 5 days of HG treatment (decrease in red mCherry fluorescence) but not in NG; lower panels (with si-Fis1): Fis1 siRNA significantly reduced mitophagy in WT MMC in NG and HG conditions, but no significant changes were detected in miR-379KO MMC even under HG conditions. Adaptive mitophagy was significantly reduced only in miR-379KO MMC treated with Fis1 siRNA in HG conditions relative to NC under NG conditions. c Bar graph quantification of DsRed2-Mito-7 staining data (shown in a) based on analysis of integrated density (n = 6 cells/group). d Bar graph of quantitative analysis of the number of red-only puncta per cell from data in b (n = 3–8 cells/group). These in vitro experiments in MMC were performed with at least three biological replicates. One-way ANOVA with Tukey’s post hoc tests for multiple comparisons in panels c and d. *P < 0.05, **P < 0.01, ****P < 0.0001. All data are presented as mean ± SEM. NC, negative control siRNA. si-Fis1, Fis1 siRNA. Scale bar, 50 µm.
Fig. 5
Fig. 5. Physiological parameters of diabetic and nondiabetic mice.
a Diabetes was induced in WT and miR-379KO mice by STZ injections as described in the “Methods.” Non-fasting blood glucose levels (BGL) in WT and miR-379KO mice at indicated time periods during 24 weeks after diabetes onset compared to control (Con) (n = 5/group). bd, Body weights and body composition analysis using Echo/MRI system. b Body weight (n = 8/group, n = 6–9/group, and n = 5–6/group for 1, 6, and 24 weeks post diabetes onset, respectively). c Total body fat (n = 8 and n = 4 for 1 and 6 weeks of diabetes, respectively). d Total lean mass (n = 4 for 6 weeks of diabetes). e, f Kidney function (urine albumin excretion) was examined using ELISA in 24 h urine collections after 24 weeks of diabetes. e Urine albumin level (n = 4–5/group). f Albumin/creatinine ratio (ACR) (n = 4–5/group). Each dot indicates the value from each mouse. One-way ANOVA with post hoc Tukey’s test for multiple comparisons. *P < 0.05, **P < 0.01, ***P < 0.001, ****P < 0.0001. All data are presented as mean ± SEM.
Fig. 6
Fig. 6. Histological evaluation of kidney cortex samples from WT and miR-379KO mice (control and diabetic).
a PAS (Periodic acid–Schiff stain) staining in control mice and diabetic mice at 6 and 24 weeks after diabetes onset. Representative images show glomerular mesangial area and extracellular matrix (ECM) accumulation. b Quantitative analysis of PAS-positive glomerular areas at 6 and 24 weeks post diabetes induction (n = 30 glomeruli/group). c Masson’s trichrome staining to detect fibrosis in WT and miR-379KO mice 24 weeks after diabetes onset. Representative images show fibrosis (blue color) in WT-STZ mice that is reduced in miR-379KO mice. Scale bar, 50 µm. d Representative images of the glomerular basement membrane (GBM) and podocyte structure using transmission electron microscopy (TEM). Representative TEM images show GBM thickness (Red arrow) and podocyte foot process effacement in WT-STZ mice, whereas these were not observed in miR-379KO-STZ mice (intact podocyte foot processes, blue arrow). Scale bar, 2 µm. e Quantitative analysis of GBM (n = 64–100 measurements/group). f Excessive mesangial expansion (white arrows) in WT-STZ mice at 24 weeks after diabetes onset. Scale bar, 0.5 µm. g Representative transmission electron micrographs of mitochondrial structure at 24 weeks after diabetes onset. Regular internal structure and elongated mitochondria (blue arrow), mitochondrial disrupted cristae (red arrow). h Quantitative analysis of mitochondrial area in each condition (n = 40 measurement/group). Scale bar, 0.5 µm. Results are expressed as fold over WT-Con. i Representative images show immunofluorescence staining to detect glomerular p57-positive podocytes (green) and nucleus (blue) at 24 weeks after diabetes onset. Scale bar, 50 µm. j Quantitative analysis of p57-positive podocytes at 24 weeks after diabetes onset (n = 30 glomeruli/group). Results are expressed as fold over WT-Con. k IHC staining for p57-positive podocytes (brown). Scale bar, 50 µm. One-way ANOVA with post hoc Tukey’s test for multiple comparisons. *P < 0.05, **P < 0.01, ***P < 0.001, ****P < 0.0001. All data are presented as mean ± SEM.
Fig. 7
Fig. 7. Glomerular expression of cluster miRNAs, profibrotic genes, and miR-379 target genes in WT and miR-379KO mice.
a, b Expression of indicated miRNAs (miRs) in control and STZ-treated WT and miR-379KO mice at a, 6 and b, 24 weeks after diabetes onset (n = 4–6/group). c Expression of glomerular Chop, an ER stress-responsive transcription factor (n = 5–8/group, n = 6–8/group, and n = 5–6/group for 1, 6, and 24 weeks of diabetes, respectively). Results are expressed as fold over WT-Con, after normalization with internal control U6. df Glomerular expression of profibrotic genes, Tgf-β1, Col1a2, Col4a1, Ctgf, and Fn1 at 1, 6, and 24 weeks (df) after diabetes onset (n = 5–8/group, n = 5–8/group, and n = 5–6/group for 1, 6, and 24 weeks of diabetes, respectively). gi Glomerular expression of miR-379 target genes. g Edem3, h Fis1, and i Txn1 were measured in WT and miR-379KO mice (n = 5–8/group, n = 6–8/group, and n = 5–6/group at 1, 6, and 24 weeks of diabetes, respectively). Results are expressed as fold over WT-Con, after normalization with internal control Cypa. Each dot indicates the value from each mouse. Statistical analyses were performed by one-way ANOVA with post hoc Tukey’s test for multiple comparisons. *P < 0.05, **P < 0.01, ***P < 0.001, ****P < 0.0001. All data are presented as mean ± SEM.
Fig. 8
Fig. 8. Immunohistochemical staining and quantitative analysis of miR-379 target proteins.
a, b EDEM3 (n = 32 and 50 glomeruli/group for 6 and 24 weeks, respectively), c, d FIS1 (n = 50 glomeruli/group), e, f TXN1 (n = 30 and 50 glomeruli/group for 6 and 24 weeks, respectively), and g, h PGC-1a (n = 50 glomeruli/group) protein in kidney cortex sections from WT and miR-379KO mice at 6 and 24 weeks after diabetes onset. Scale bar, 50 µm. Bar graph results are expressed as fold over WT-Con. Statistical analyses were performed by one-way ANOVA with post hoc Tukey’s test for multiple comparisons. *P < 0.05, **P < 0.01, ****P < 0.0001. All data are presented as mean ± SEM.
Fig. 9
Fig. 9. Proposed model illustrating the role of miR-379 in promoting early features of kidney disease in diabetic mice.
Diabetic conditions induce expression of the miR-379 cluster via TGF-β signaling. This increase includes upregulation of miR-379 and subsequent downregulation of its targets (Edem3, Fis1, Txn1) related to ER stress, adaptive mitophagy, mitochondrial dysfunction, and oxidant stress, which are directly involved in the development of early features of DKD, such as ECM accumulation, glomerular hypertrophy, and fibrosis. Activated ER stress can also increase CHOP transcription factor and the miR-379 cluster miRNAs, creating a positive feedback. Genetic deletion of miR-379 can diminish these alterations induced by diabetes, interrupt the auto-feedback, and protect against DKD progression.

Comment in

  • Promises and challenges of miRNA therapeutics.
    Long J, Danesh FR. Long J, et al. Am J Physiol Renal Physiol. 2022 Dec 1;323(6):F673-F674. doi: 10.1152/ajprenal.00251.2022. Epub 2022 Oct 20. Am J Physiol Renal Physiol. 2022. PMID: 36264885 Free PMC article. No abstract available.

References

    1. Kanwar YS, Sun L, Xie P, Liu FY, Chen S. A glimpse of various pathogenetic mechanisms of diabetic nephropathy. Annu. Rev. Pathol. 2011;6:395–423. doi: 10.1146/annurev.pathol.4.110807.092150. - DOI - PMC - PubMed
    1. Forbes JM, Cooper ME. Mechanisms of diabetic complications. Physiol. Rev. 2013;93:137–188. doi: 10.1152/physrev.00045.2011. - DOI - PubMed
    1. Kato M, Natarajan R. Epigenetics and epigenomics in diabetic kidney disease and metabolic memory. Nat. Rev. Nephrol. 2019;15:327–345. doi: 10.1038/s41581-019-0135-6. - DOI - PMC - PubMed
    1. Meng X-M, Nikolic-Paterson DJ, Lan HY. TGF-β: the master regulator of fibrosis. Nat. Rev. Nephrol. 2016;12:325. doi: 10.1038/nrneph.2016.48. - DOI - PubMed
    1. Reidy K, Kang HM, Hostetter T, Susztak K. Molecular mechanisms of diabetic kidney disease. J. Clin. Investig. 2014;124:2333–2340. doi: 10.1172/JCI72271. - DOI - PMC - PubMed

Publication types