Comparative Study
. 2021 Jan 4;4(1):29.
doi: 10.1038/s42003-020-01520-0.

A single day of TGF-β1 exposure activates chondrogenic and hypertrophic differentiation pathways in bone marrow-derived stromal cells

Affiliations
Comparative Study

A single day of TGF-β1 exposure activates chondrogenic and hypertrophic differentiation pathways in bone marrow-derived stromal cells

Kathryn Futrega et al. Commun Biol. .

Abstract

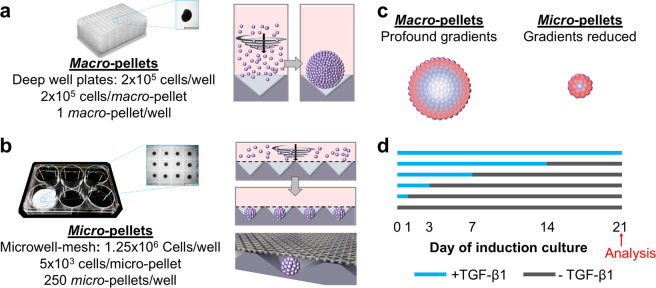
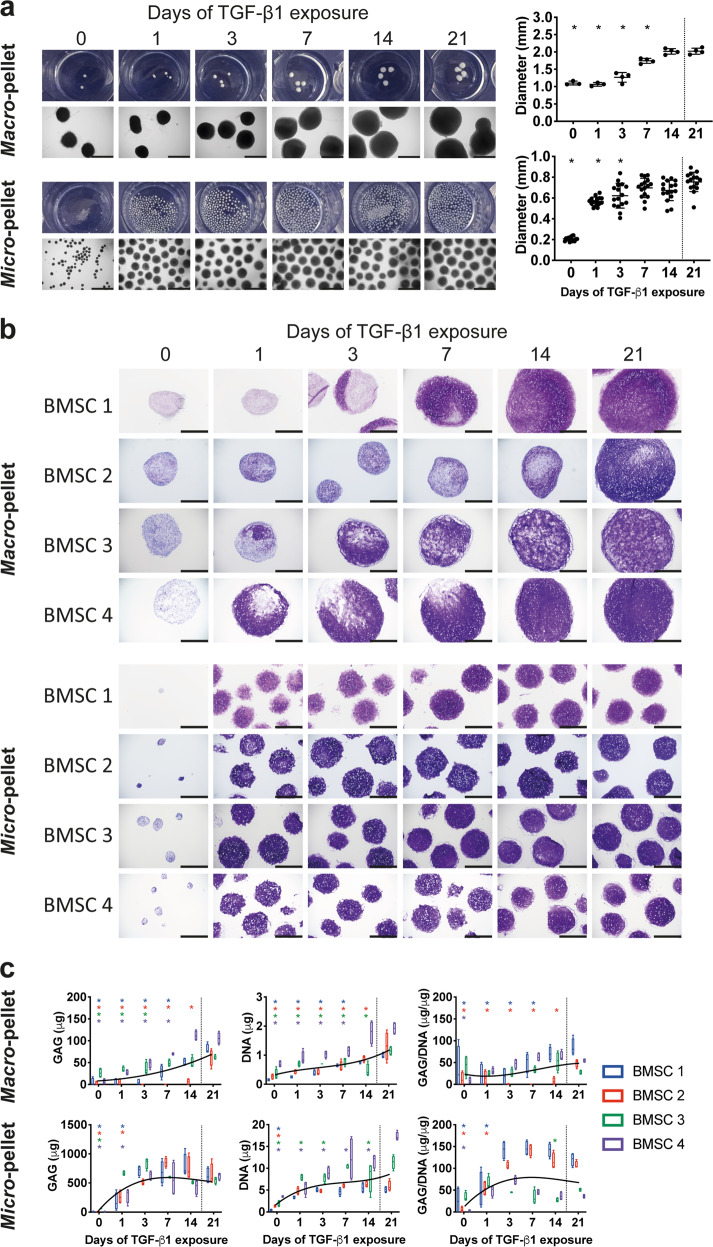
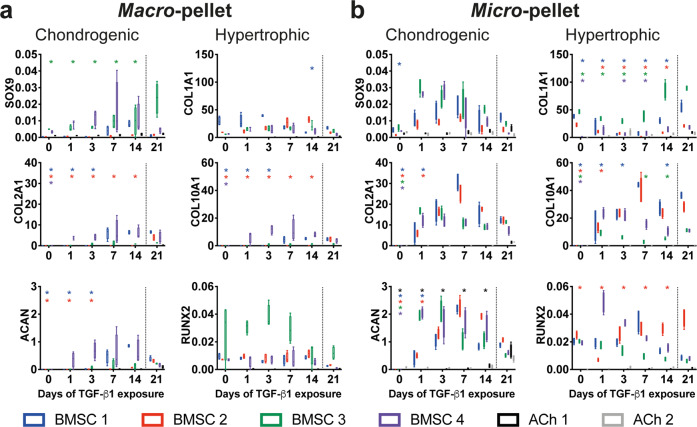
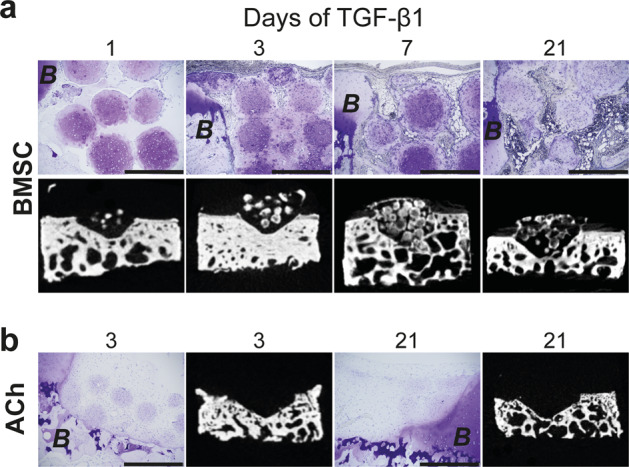
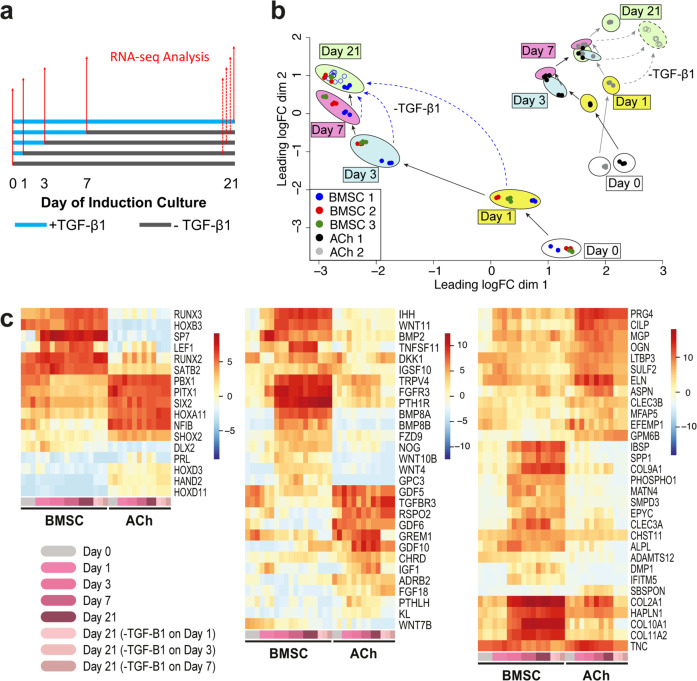
Virtually all bone marrow-derived stromal cell (BMSC) chondrogenic induction cultures include greater than 2 weeks exposure to transforming growth factor-β (TGF-β), but fail to generate cartilage-like tissue suitable for joint repair. Herein we used a micro-pellet model (5 × 10³ BMSC each) to determine the duration of TGF-β1 exposure required to initiate differentiation machinery, and to characterize the role of intrinsic programming. We found that a single day of TGF-β1 exposure was sufficient to trigger BMSC chondrogenic differentiation and tissue formation, similar to 21 days of TGF-β1 exposure. Despite cessation of TGF-β1 exposure following 24 hours, intrinsic programming mediated further chondrogenic and hypertrophic BMSC differentiation. These important behaviors are obfuscated by diffusion gradients and heterogeneity in commonly used macro-pellet models (2 × 10⁵ BMSC each). Use of more homogenous micro-pellet models will enable identification of the critical differentiation cues required, likely in the first 24-hours, to generate high quality cartilage-like tissue from BMSC.


Conflict of interest statement

The authors declare no competing interests.

Figures

Fig. 1
Fig. 1. Schematic of experimental procedures.
a, b Different cell seeding densities were used to generate macro-pellets or micro-pellets of specific size in deep-well plates or Microwell-mesh plates, respectively. Micro-pellets were retained in discrete microwells by the nylon mesh bonded over the microwell openings (see Supplementary Movie 1). Retention by the mesh enabled long-term micro-pellet culture, including multiple medium exchanges. c Diffusion gradients are reduced in smaller diameter micro-pellets relative to larger diameter macro-pellets,. d Cultures were carried out for 21 days total, with blue lines representing culture days with TGF-β1 in the medium, and gray lines representing culture days without TGF-β1 in the medium.
Fig. 2
Fig. 2. Cartilage-like tissues derived from BMSCs after 21 days in vitro differentiation with TGF-β1 exposure for the number of days indicated.
a Gross photographs and brightfield microscopy images of whole BMSC-derived tissues (scale bars for microscopy images, 1 mm), and corresponding diameters. b Toluidine blue stain of glycosaminoglycan (GAG) matrix in macro- and micro-pellet tissue cross-sections are shown for four unique BMSC donors (scale bars, 500 μm). c GAG, DNA, and normalized GAG/DNA quantification for each BMSC donor. Asterisks are shown for values that are significantly lower than the corresponding 21 days of TGF-β1 exposure control. Box plots: n = 4 for each donor; *P < 0.05.
Fig. 3
Fig. 3. Cartilage-like tissues derived from ACh after 21 days in vitro differentiation with TGF-β1 exposure for the number of days indicated.
a Gross photographs and brightfield microscopy images of whole ACh-derived tissues (scale bars for microscopy images, 1 mm), and corresponding diameters. b Toluidine blue stain of macro- and micro-pellet tissue cross-sections are shown for two unique ACh donors (scale bars, 500 μm). c GAG, DNA, and normalized GAG/DNA quantification for ACh donors. Asterisks are shown for values that are significantly lower than the corresponding 21 days of TGF-β1 exposure control. Box plots: n = 4 for each donor; *P < 0.05.
Fig. 4
Fig. 4. qPCR analysis of cartilage-like tissues derived from BMSCs or ACh on day 21 of culture, following varying days of TGF-β1 exposure.
a qPCR from macro-pellet cultures, b qPCR from micro-pellet cultures. All values are compared with the standard 21 days of TGF-β1 exposure control (separated by the dotted line). Gene expression values represent 2−ΔCt, normalized to GAPDH. Asterisks are shown for values that are significantly lower than the corresponding 21 days of TGF-β1 exposure control. Box plots: n = 4 for each donor; *P < 0.05.
Fig. 5
Fig. 5. Micro-pellet tissue formation in vivo.
Analysis of micro-pellets formed from a BMSCs or b ACh implanted subcutaneously in NSG mice for 8 weeks in bovine defect models. Histological sections showed that BMSC and ACh micro-pellets appeared highly remodeled with reduced GAG staining (Toluidine blue), and only BMSCs formed bone-like tissues (scale bars, 500 μm). Micro-CT analysis confirmed the presence of mineralized tissue in BMSC micro-pellets, unlike ACh micro-pellets. Representative images are shown for 21 day in vitro differentiated tissues with TGF-β1 exposure for days indicated above the images. Surrounding bovine cartilage and bone tissue is marked with the letter “B” to indicate bovine tissue.
Fig. 6
Fig. 6. RNA-sequencing analysis.
a Whole transcriptome analysis was performed for BMSC and ACh cultures treated with TGF-β1 (blue lines) and harvested on days 0, 1, 3, 7, and 21 as indicated by the solid red arrows (BMSC donors 1, 2, and 3, and ACh donor 1 and 2). Additionally, for BMSC donor 1 and ACh donor 2, RNA-seq analysis was performed on day 21 following TGF-β1 withdrawal on days 1, 3, and 7, represented by dashed red arrows. b MDS plot reveals the convergence of BMSC cultures on a common gene expression profile by day 21. This gene expression profile was common in 21-day cultures, despite being exposed to exogenous TGF-β1 for different durations (1, 3, 7, or 21 days). BMSC and ACh gene expression was dissimilar in samples treated in the same way. Solid arrows in the MDS plot show the progression of gene expression profiles from day 0 cultures maintained continuously in TGF-β1, and analyzed on day 1, 3, 7, or 21. Dashed arrows point to the changes in global gene expression on day 21, following TGF-β1 withdrawal from cultures on day 1, 3, or 7. c Differentially expressed genes related to osteochondral transcription factors (left), soluble factors and receptor signaling (middle), and ECM molecules and ECM biosynthesis (right). Each timepoint in the heatmap is represented by a color shown on the bottom row of the heatmap, which corresponds to the color key on the bottom left of the figure. Each BMSC timepoint has three columns, representing three unique BMSC donors, and each ACh timepoint has two columns, representing two unique ACh donors; only one BMSC donor and one ACh donor was sequenced on day 21 with TGF-β1 withdrawal on day 1, 3, or 7, and are represented by the lighter pink shades; heatmap colors represent the average of normalized logCPM values from three culture wells.

Similar articles

Cited by

References

    1. Somoza RA, Welter JF, Correa D, Caplan AI. Chondrogenic differentiation of mesenchymal stem cells: challenges and unfulfilled expectations. Tissue Eng. Part B Rev. 2014;20:596–608. doi: 10.1089/ten.teb.2013.0771. - DOI - PMC - PubMed
    1. Sacchetti B, et al. Self-renewing osteoprogenitors in bone marrow sinusoids can organize a hematopoietic microenvironment. Cell. 2007;131:324–336. doi: 10.1016/j.cell.2007.08.025. - DOI - PubMed
    1. Hunziker EB, Quinn TM, Hauselmann HJ. Quantitative structural organization of normal adult human articular cartilage. Osteoarthr. Cartil. 2002;10:564–572. doi: 10.1053/joca.2002.0814. - DOI - PubMed
    1. Markway BD, et al. Enhanced chondrogenic differentiation of human bone marrow-derived mesenchymal stem cells in low oxygen environment micropellet cultures. Cell Transplant. 2010;19:29–42. doi: 10.3727/096368909X478560. - DOI - PubMed
    1. Futrega K, et al. The microwell-mesh: a novel device and protocol for the high throughput manufacturing of cartilage microtissues. Biomaterials. 2015;62:1–12. doi: 10.1016/j.biomaterials.2015.05.013. - DOI - PubMed

Publication types

Substances