. 2021 Jan 4;12(1):81.
doi: 10.1038/s41467-020-20439-y.

Dose-dependent response to infection with SARS-CoV-2 in the ferret model and evidence of protective immunity

Affiliations

Dose-dependent response to infection with SARS-CoV-2 in the ferret model and evidence of protective immunity

Kathryn A Ryan et al. Nat Commun. .

Abstract

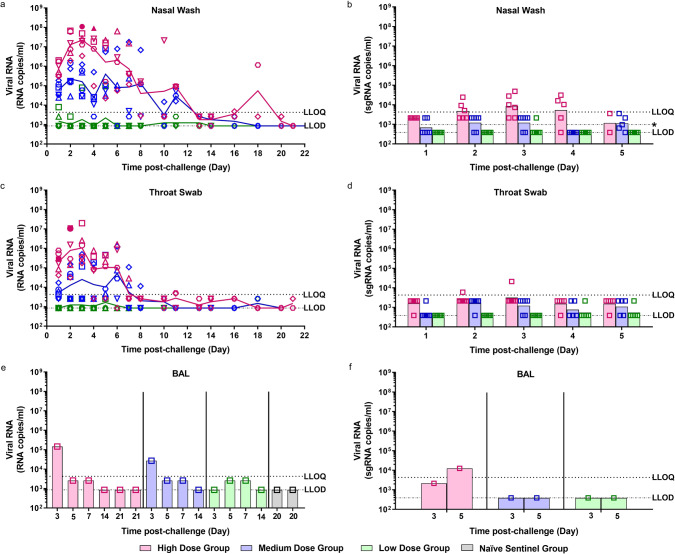
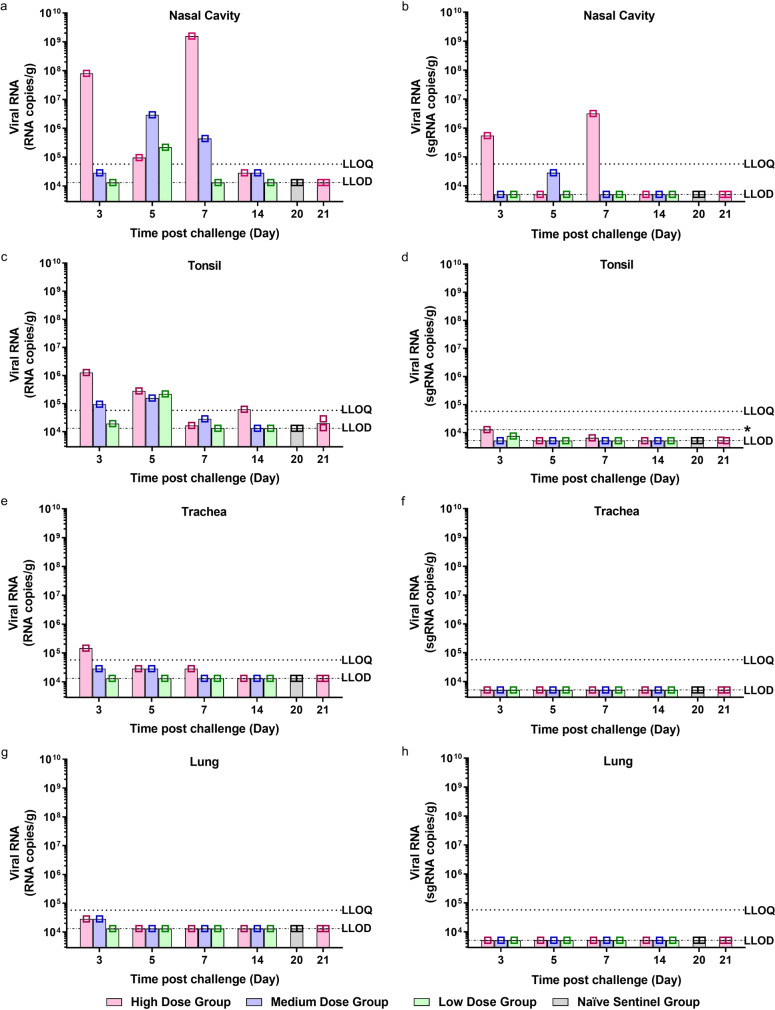
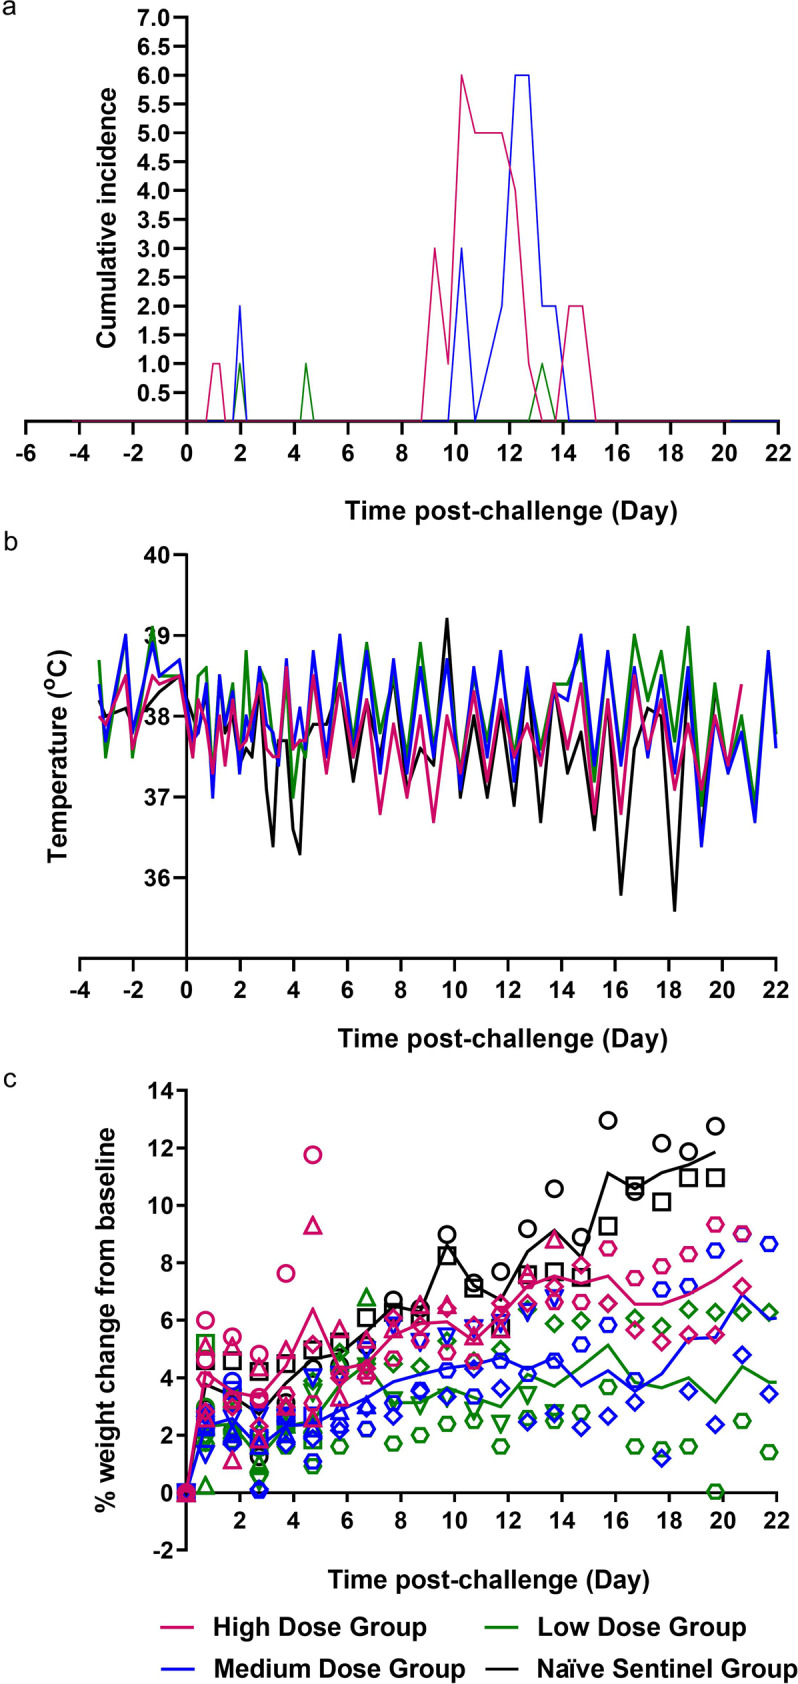
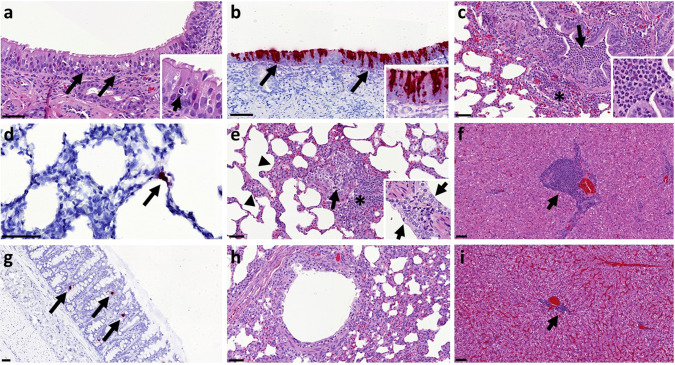
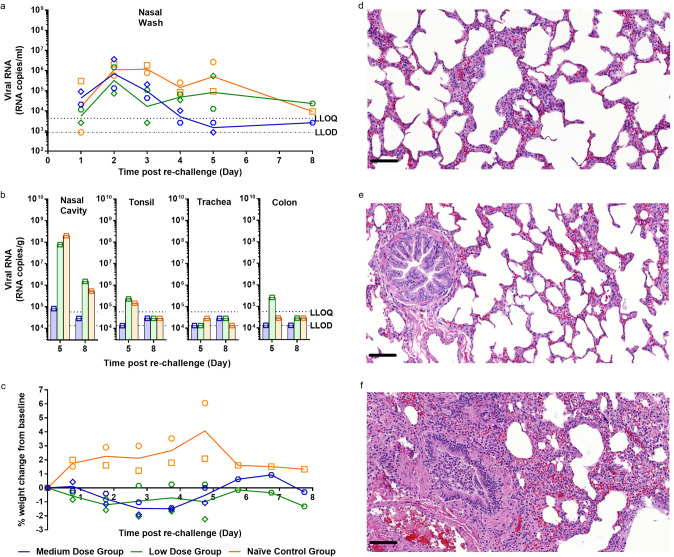
There is a vital need for authentic COVID-19 animal models to enable the pre-clinical evaluation of candidate vaccines and therapeutics. Here we report a dose titration study of SARS-CoV-2 in the ferret model. After a high (5 × 10⁶ pfu) and medium (5 × 10⁴ pfu) dose of virus is delivered, intranasally, viral RNA shedding in the upper respiratory tract (URT) is observed in 6/6 animals, however, only 1/6 ferrets show similar signs after low dose (5 × 10² pfu) challenge. Following sequential culls pathological signs of mild multifocal bronchopneumonia in approximately 5-15% of the lung is seen on day 3, in high and medium dosed groups. Ferrets re-challenged, after virus shedding ceased, are fully protected from acute lung pathology. The endpoints of URT viral RNA replication & distinct lung pathology are observed most consistently in the high dose group. This ferret model of SARS-CoV-2 infection presents a mild clinical disease.


Conflict of interest statement

The authors declare no competing interests.

Figures

Fig. 1
Fig. 1. Viral RNA Shedding.
Nasal washes and swabs were collected at days 1 to 8, 10, 11, 13, 14, 16, 18 and 20 pc for all virus challenged groups. Viral genomic RNA was quantified by RT-qPCR at all timepoints. No viral RNA was detected in any samples taken from the naïve sentinel ferrets. Samples that were found to be positive by plaque assay are represented by a solid shape. (a) Nasal washes (c) Throat swabs (e) Bronchoalveolar lavage (BAL) collected at necropsy (numbers indicate day post-challenge the ferret was euthanised). Symbols show values for individual animals, lines represented the calculated group geometric means. The presence of viral subgenomic RNA was assessed in (b) nasal washes, (d) throat swabs and (f) BAL from 1 to 5 dpc. Bars show geometric mean for each group and symbols show values for each individual animal. n = 6 ferrets per group with numbers decreasing by 1 at 3, 5, 7 and 14 dpc. The dashed horizontal lines show the lower limit of quantification (LLOQ) and the lower limit of detection (LLOD). [*LLOD range for nasal washes represents 2 undetected samples at 5 dpc had <5 µl template tested].
Fig. 2
Fig. 2. Viral RNA Shedding in Tissues.
a, b Nasal cavity, c, d tonsil, e, f trachea and g, h lung were collected at euthanasia timepoints (days 3, 5, 7, 14, 20 and 21 pc) for all groups. n = 6 ferrets per group (n = 2 ferrets in the naive sentinel group), with one ferret from each group culled at each timepoint (except day 20 and 21 pc where n = 2 ferrets from the naive sentinel and high dose groups were culled respectively). Viral genomic RNA (a, c, e and f) and viral subgenomic RNA (b, d, f and h) was quantified by RT-qPCR. Bars show values for individual animals. The dashed horizontal lines show the lower limit of quantification (LLOQ) and the lower limit of detection (LLOD). *LLOD range for tonsil represents undetected samples homogenised in smaller volume.
Fig. 3
Fig. 3. Clinical Observations.
a Clinical observations were carried out four times daily (approximately 6 h apart) for the first 5 days and then twice daily (approximately 8 h apart) for the remaining time. Observations were summed for each group of ferrets. b Temperatures were taken at the same time as clinical observations, using the identifier chip, to ensure any peak of fever was recorded. Mean temperatures are displayed on the graph. c Weight was recorded daily and percentage weight change from baseline was plotted. Points show values for individual animals, lines represented the calculated group means. n = 6 ferrets per group (n = 2 ferrets in the naive sentinel group) with numbers decreasing by 1 at 3, 5, 7 and 14 dpc. The table illustrates the summed scores for each clinical observation noted for each of the groups during specific days post-challenge and post re-challenge. Activity in ferrets was scored as follows; 0 = alert and playful, 1 = alert, playful when stimulated, 2 = alert, not playful when stimulated, 3 = not alert or playful. Ruffled fur was given a score of 1. Activity scores of 1 were given to ferrets during the initial challenge. Upon re-challenge ferret activity was recorded as 1 or 2 indicating increased lethargy in ferrets following re-challenge.
Fig. 4
Fig. 4. Histopathological findings and presence of SARS-CoV-2 RNA in tissue sections from ferrets inoculated with SARS-CoV-2.
Two sections from each tissue or organ were evaluated independently by two qualified pathologists and representative images are shown. a Nasal cavity, day 3 pc, Group 1, H&E staining. Mild epithelial cell necrosis (arrows) and minimal inflammatory cell infiltration within the epithelium; bar = 50 μm; inset = close up image of an inflammatory cell within the epithelial layer. b Nasal cavity, day 3 pc, Group 1, SARS-CoV-2 viral RNA detection (RNASCope staining). Presence of viral RNA in abundant epithelial and sustentacular cells from the nasal cavity mucosa; bar = 50 μm; inset = close up image showing abundant viral RNA within the olfactory epithelium. c Lung, day 5 pc, Group 1, H&E staining. Moderate bronchopneumonia with neutrophil and macrophage inflammatory infiltrate within the bronchiolar lumina (arrow). Mild peribronchiolar infiltration of mononuclear cells (*); bar = 50 μm; inset = clse up image of the bronchiolar inflammatory cell infiltration showing abundant neutrophils. d Lung, day 3 pc, Group 2, SARS-CoV-2 viral RNA detection (RNASCope staining). Presence of viral RNA in type II pneumocyte (arrow); bar = 50 μm. e Lung, day 21 pc, Group 1, H&E staining. A Bronchiole with mild inflammatory infiltration in the lumina (arrow) and attenuation of the epithelial cells. Moderate peribronchiolar infiltration of mononuclear cells (*) and mild interalveolar septal inflammatory cell infiltration with thickening of the wall (arrowheads); bar = 50 μm; inset = close up image of mils pneumocyte II proliferation in the lung at day 7 pc. f Liver, day 21 pc, Group 1, H&E staining. Moderate multifocal hepatitis with mononuclear cell infiltration in the portal areas (arrow); bar = 50 μm. g Colon, day 3 pc, Group 1, SARS-CoV-2 viral RNA detection (RNASCope staining). Presence of viral RNA in scattered cell within the absorptive epithelium (arrows); bar = 50μm. h Lung, naïve animal, H&E staining. Bronchiole showing no inflammatory reaction; bar = 50 μm. i Liver, naïve animal, H&E staining. Minimal hepatitis with mononuclear cell infiltration in the portal areas (arrow); bar = 50 μm.
Fig. 5
Fig. 5. Re-challenge of ferrets with SARS-CoV-2.
a Nasal washes were collected at days 1–5 post re-challenge (days 29–33 post-original challenge). Viral RNA was quantified by RT-qPCR. b Nasal cavity, tonsil, trachea and colon were collected at euthanasia timepoints (days 5 and 8 post re-challenge) for all groups. Viral RNA was quantified by RT-qPCR. Bars show values for individual animals. The dashed horizontal lines show the lower limit of quantification (LLOQ) and the lower limit of detection (LLOD). c Percentage weight change from baseline. Baseline was calculated as average of the two most recent weights taken preceding re-challenge. n = 2 ferrets per group with numbers decreasing by 1 at 5 dpc. d Medium dose re-challenged ferret at day 5 post re-challenge. No remarkable changes in alveoli or terminal bronchiole. e Low dose re-challenged ferret at day 5 post re-challenge. No remarkable changes in alveoli or bronchiole. f Control group ferret challenged for the first time (day 28 pc). Inflammatory infiltration within bronchiolar lumen and mild infiltration of alveolar septa; lesions comparable with those observed in the original high dose group. Bar = 50 μm.

References

    1. Cui J, Li F, Shi Z-L. Origin and evolution of pathogenic coronaviruses. Nat. Rev. Microbiol. 2019;17:181–192. doi: 10.1038/s41579-018-0118-9. - DOI - PMC - PubMed
    1. Sutton TC, Subbarao K. Development of animal models against emerging coronaviruses: from SARS to MERS coronavirus. Virology. 2015;479–480:247–258. doi: 10.1016/j.virol.2015.02.030. - DOI - PMC - PubMed
    1. Lu R, et al. Genomic characterisation and epidemiology of 2019 novel coronavirus: implications for virus origins and receptor binding. Lancet. 2020;395:565–574. doi: 10.1016/S0140-6736(20)30251-8. - DOI - PMC - PubMed
    1. WHO. WHO Coronavirus Disease (COVID-19) Dashboard. https://covid19.who.int/ (WHO, 2020).
    1. WHO. Report of the WHO-China Joint Mission on Coronavirus Disease 2019 (COVID-19). https://www.who.int/docs/default-source/coronaviruse/who-china-joint-mis... (WHO, 2020).

Publication types