. 2021 Jun;26(6):1775-1789.
doi: 10.1038/s41380-020-00991-1. Epub 2021 Jan 4.

Homer1 promotes dendritic spine growth through ankyrin-G and its loss reshapes the synaptic proteome

Affiliations

Homer1 promotes dendritic spine growth through ankyrin-G and its loss reshapes the synaptic proteome

Sehyoun Yoon et al. Mol Psychiatry. 2021 Jun.

Abstract

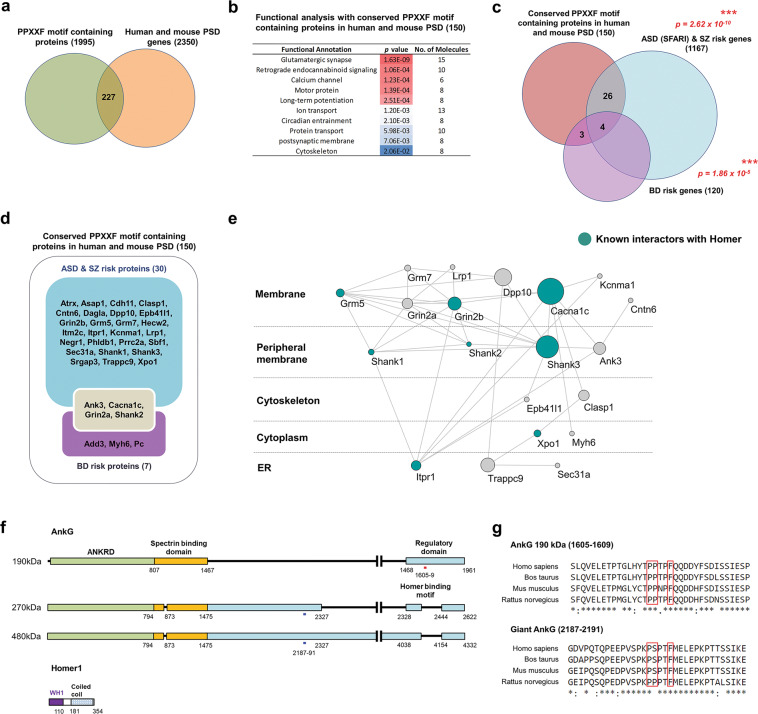
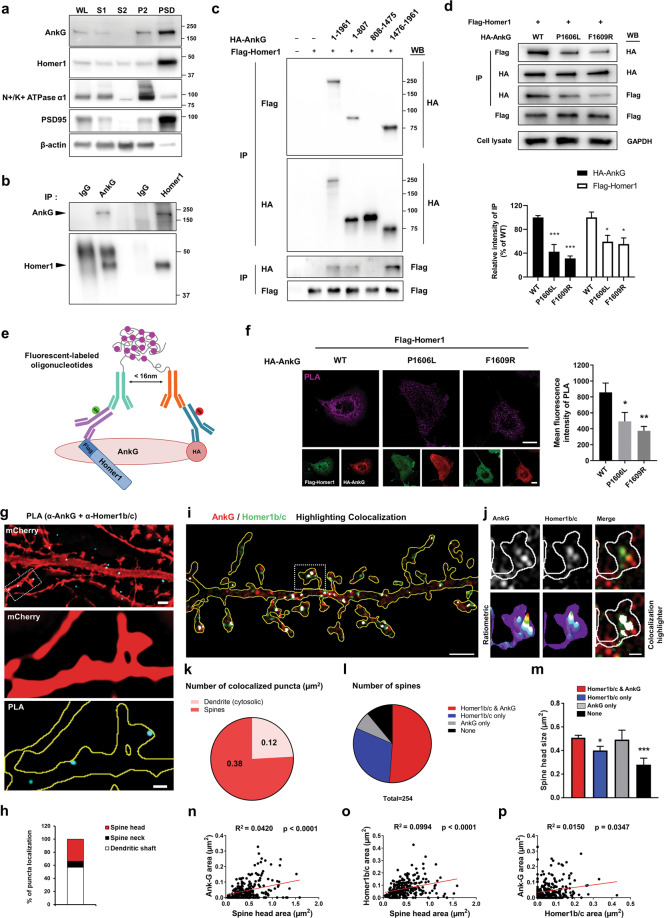
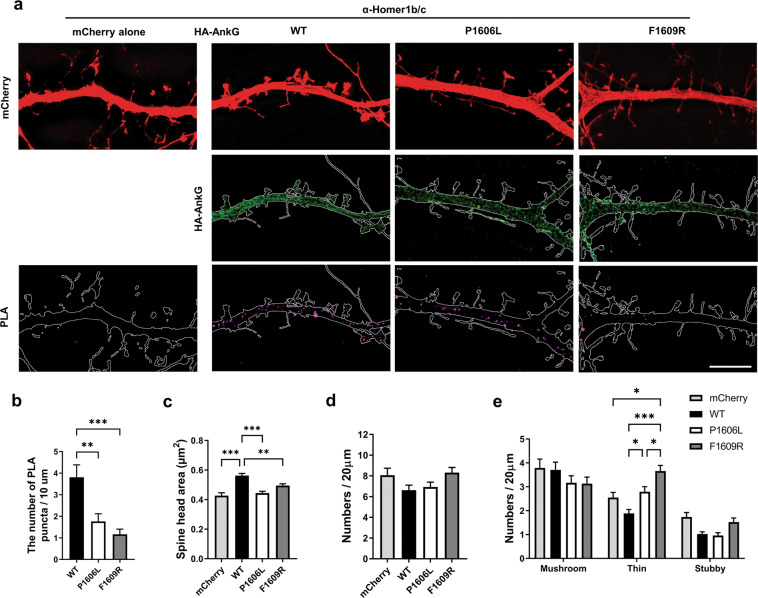
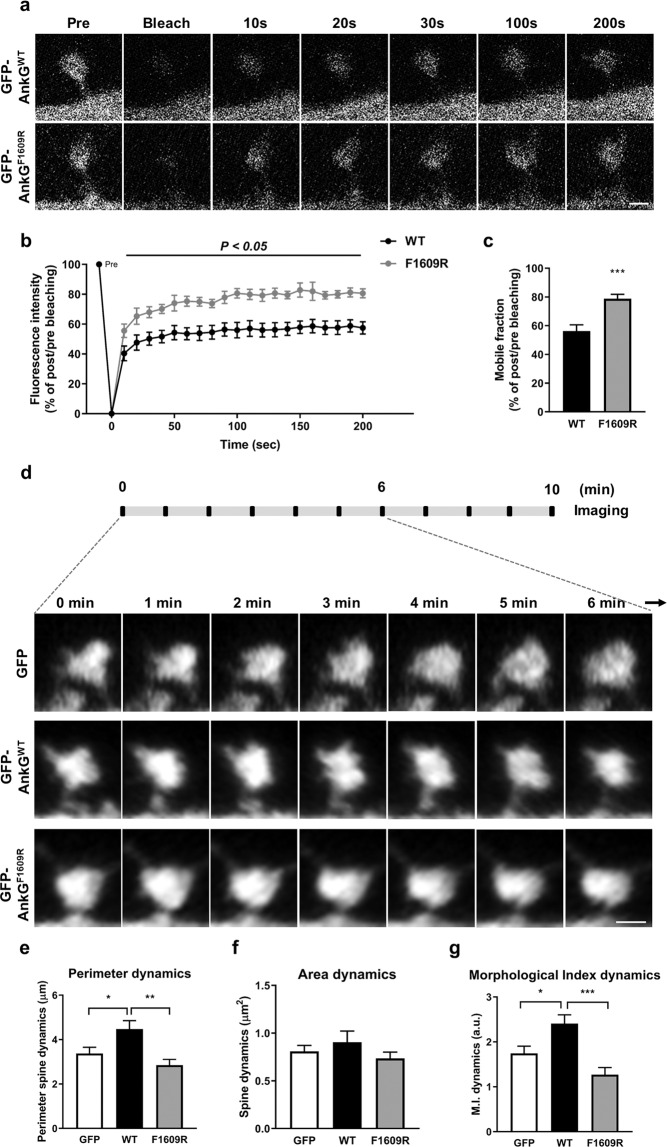
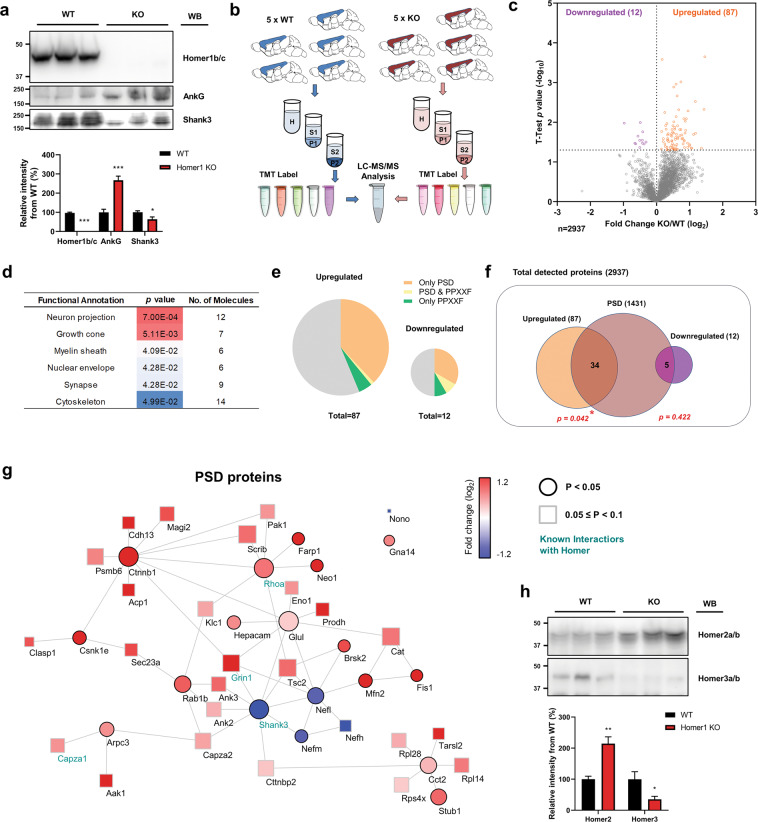
Homer1 is a synaptic scaffold protein that regulates glutamatergic synapses and spine morphogenesis. HOMER1 knockout (KO) mice show behavioral abnormalities related to psychiatric disorders, and HOMER1 has been associated with psychiatric disorders such as addiction, autism disorder (ASD), schizophrenia (SZ), and depression. However, the mechanisms by which it promotes spine stability and its global function in maintaining the synaptic proteome has not yet been fully investigated. Here, we used computational approaches to identify global functions for proteins containing the Homer1-interacting PPXXF motif within the postsynaptic compartment. Ankyrin-G was one of the most topologically important nodes in the postsynaptic peripheral membrane subnetwork, and we show that one of the PPXXF motifs, present in the postsynaptically-enriched 190 kDa isoform of ankyrin-G (ankyrin-G 190), is recognized by the EVH1 domain of Homer1. We use proximity ligation combined with super-resolution microscopy to map the interaction of ankyrin-G and Homer1 to distinct nanodomains within the spine head and correlate them with spine head size. This interaction motif is critical for ankyrin-G 190's ability to increase spine head size, and for the maintenance of a stable ankyrin-G pool in spines. Intriguingly, lack of Homer1 significantly upregulated the abundance of ankyrin-G, but downregulated Shank3 in cortical crude plasma membrane fractions. In addition, proteomic analysis of the cortex in HOMER1 KO and wild-type (WT) mice revealed a global reshaping of the postsynaptic proteome, surprisingly characterized by extensive upregulation of synaptic proteins. Taken together, we show that Homer1 and its protein interaction motif have broad global functions within synaptic protein-protein interaction networks. Enrichment of disease risk factors within these networks has important implications for neurodevelopmental disorders including bipolar disorder, ASD, and SZ.


Conflict of interest statement

The authors declare that they have no conflict of interest.

Figures

Fig. 1
Fig. 1. Multiple postsynaptic psychiatric risk factors include a Homer1-binding motif.
a Diagram of PPXXF motif-containing proteins in PSD. b Functional analysis of conserved (in human, bovine, mouse, and rat) PPXXF motif-containing proteins in PSD. c Enrichment of BD, ASD, and SZ risk factors (identified through GWAS, SFARI gene archive and de novo studies, respectively) among PPXXF motif-containing proteins in the combined human and mouse PSD. ***p < 0.001; hypergeometry test. d Diagram of PPXXF motif-containing proteins in the PSD is encoded by psychiatric risk genes. e Protein interaction network generated from the list of PPXXF motif-containing PSD proteins is encoded by psychiatric risk genes in d. The representative majority of a subnetwork is visualized and annotated by Cytoscape. The size of node indicates betweenness centrality. Known interactors with Homer1/2/3 from BioGrid and text mining were colored emerald. Edges indicate known and predicted protein-protein interactions, including experimental data from the STRING database. f Schematic representation of the Homer1 recognition motifs in ankyrin-G (190, 270, and 480 kDa) isoforms. g Amino acid sequence alignment of human, bovine, mouse, and rat ankyrin-G regions containing the Homer-binding motif PPXXF. Sequence alignments were performed by Clustal Omega. SFARI: Simons Foundation Autism Research Initiative.
Fig. 2
Fig. 2. Ankyrin-G 190 and Homer1b/c interaction in nanodomains within dendrites and spines.
a Western blot of subcellular fractionation from 16-week-old mouse cortex is probed with ankyrin-G, Homer1b/c, N+/K+ ATPase α1 (as a plasma membrane marker), PSD-95 (as a postsynaptic marker), and β-actin antibodies. Each lane was loaded with 10 µg of each sample. WL whole cell lysate, S1 cytosol/membranes, S2 cytosol, P2 crude synaptosomes, PSD PSD-enriched synaptosomal fraction. b Co-immunoprecipitation experiments with anti-ankyrin-G or anti-Homer1b/c from the PSD-enriched synaptosomal fraction. IgG control IgG, IP immunoprecipitation. c Binding of ankyrin-G and its truncation mutants to Homer1c. The top panel shows the immunoprecipitated full-length ankyrin-G or the truncated versions of ankyrin-G co-expressed with Homer1c. d Effects of point mutations in the PPXXF Homer-binding motif of ankyrin-G (P1606L and F1609R) on the interaction with Homer1c. The HEK293T cell lysate was analyzed by immunoblotting with HA or Flag antibody. n = 4 per each group. F(2, 9) = 24.10; F(2, 9) = 6.17; *p < 0.05, ***p < 0.001; followed by one-way ANOVA followed by a Bonferroni test. Data are represented as mean ± SEM. e Schematic representation for the in situ proximity ligation assay (PLA). f Confocal images for detection of the interaction between HA-ankyrin-G wild-type (WT) or point mutants (red) and Flag-Homer1c (green) with PLA (magenta) in COS7 cells. Scale bar, 20 µm (top and bottom). Bar graph of the PLA signal with the mutants of HA-ankyrin-G and Flag-Homer1c. n = 13 per each group. F(2, 36) = 6.48; *p < 0.05, **p < 0.01; one-way ANOVA followed by a Bonferroni test. Data are represented as mean ± SEM. g SIM image of a mCherry-expressing neuron to detect the interaction between ankyrin-G and Homer1b/c by PLA (cyan). Scale bar, 2 µm (top panel). Zoomed images were shown from the boxed area in the top panel. Scale bar, 0.5 µm (middle and botton panels). h Bar graph showing the PLA puncta ratio in spines versus dendrites, n = 9 cells. i SIM image of mCherry-expressing neurons immunostained for anti-ankyrin-G (red) and anti-Homer1b/c (green). Scale bar, 2 µm. Colocalization is shown in white by ‘colocalization highlighter’ in ImageJ. j High-resolution image of boxed spine in i. Bottom panels: ratiometric images and colocalization (white). Scale bar, 0.5 µm. k Pie chart showing the highlighted puncta ratio of spines versus dendrites per spine area. l Pie chart of expression patterns of ankyrin-G and Homer1b/c in spines. m Spine head size from the chart (k) was analyzed with a bar graph. F(3, 250) = 5.77; *p < 0.05, ***p < 0.001; one-way ANOVA followed by a Bonferroni test. Data are represented as mean ± SEM. Correlation plot of the size of anti-ankyrin-G (n) or anti-Homer1b/c (o) nanodomains versus spine head area, and the size of anti-ankyrin-G versus anti-Homer1b/c nanodomains (p). n = 13 cells. Head area: 0.452 ± 0.017 µm2; anti-ankyrin-G nanodomain area: 0.032 ± 0.002 µm2; anti-Homer1b/c area: 0.056 ± 0.003 µm2.
Fig. 3
Fig. 3. Mutation of the PPXXF binding motif in ankyrin-G 190 attenuates its interaction with Homer1b/c in dendrites.
a SIM images to detect the interaction between HA-ankyrin-G WT or mutants (P1606L or F1609R) and anti-Homer1b/c by in situ PLA. The PLA was conducted after transfection of HA-ankyrin-G WT or mutant constructs into the cultured mouse cortical neurons. Negative control was transfected with only mCherry construct. Scale bar, 2 µm. b The number of PLA puncta per 10 µm from HA-ankryn-G WT, P1606L, and F1609R transfected neurons. PLA was performed with anti-Homer1b/c and anti-HA antibodies. F(2, 123) = 11.75. c Spine head size from mushroom spines was analyzed from only mCherry or HA-ankryn-G WT, P1606L, and F1609R transfected neurons with mCherry. F(3, 1445) = 18.62. d Total numbers of all spines were counted. F(3, 141) = 3.64. e Mushroom, thin, and stubby types of spine morphology were analyzed. F(6, 423) = 5.59. n = 13 (only mCherry), 17 (WT), 19 (P1606L), 21 (F1609R) cells. *p < 0.05; **p < 0.01; ***p < 0.001; one-way ANOVA followed by a Bonferroni test for bd and two-way ANOVA followed by a Bonferroni test for e. Data are represented as mean ± SEM.
Fig. 4
Fig. 4. Mutation of the PPXXF binding motif in ankyrin-G 190 increases its mobile fraction in spines and reduces spine head dynamics.
a Representative time-lapse of fluorescence recovery in a FRAP experiment in neurons overexpressing GFP-ankyrin-G 190 WT or F1609R. Scale bar, 1 µm. b Quantification of GFP-ankyrin-G or mutant fluorescence intensity in each spine every 10 s for 200 s. F(20, 126) = 19.32; two-way ANOVA followed by a Bonferroni test. Data are represented as mean ± SEM. c The graph of the mobile fraction (% of post per pre bleaching at 200 s) in GFP-ankyrin-GWT and GFP-ankyrin-GF1609R-overexpressing neurons (n = 7 cells per each group, 3–5 spines from a neuron on three independent experiments). t(12) = 4.24; ***p < 0.001; two-tailed Student’s ttest was performed. d Time-lapse imaging of spine head dynamics. Neurons were co-transfected with tdTomato together with GFP, GFP-ankyrin-GWT or GFP-ankyrin-GF1069R and imaged for 10 min. Seven representative images from 0 to 6 min taken at different time points were shown. e Analysis of perimeter dynamics from spine head. F(2, 48) = 7.28. f Quantification of area dynamics from spine head area. F(2, 48) = 1.05. g Spine morphological index (M.I. = P2/4πA) dynamics in 10 min from spines. F(2, 48) = 11.22. GFP: n = 17 spines, GFP-ankyrin-GWT: n = 16 spines, GFP-ankyrin-GF1069R: n = 18 spines; all spines were measured from 9 neurons per each group on four independent experiments. *p < 0.05; **p < 0.01; ***p < 0.001; one-way ANOVA followed by a Bonferroni test. Data are represented as mean ± SEM. See also Movie 1.
Fig. 5
Fig. 5. The proteome is remodeled in the cortex of HOMER1 KO mice.
a Levels of Homer1b/c (t(8) = 25.45), ankyrin-G (t(8) = 6.32), and Shank3 (t(8) = 2.54) proteins in P2 (crude synaptosomes) samples from the cortex of 3-week-old WT or HOMER1 KO mice. n = 5 per each group. *p < 0.05; ***p < 0.001; two-tailed Student’s t test was performed. Data are represented as mean ± SEM. b Scheme of experimental work-flow of the proteomic analysis. c Volcano plot showing the fold change of individual protein levels versus significance between WT and HOMER1 KO mice. Significantly upregulated proteins are in orange (p < 0.05), significantly downregulated proteins are in purple (p < 0.05), and all other proteins are in gray. d Gene ontology (GO) analysis of statistically overrepresented biological processes among the significantly differentially regulated proteins in HOMER1 KO mice. The analysis was performed from data in c by DAVID. e Pie charts showing the presence in the PSD, inclusion of a PPXXF motif, or both, among the proteins significantly upregulated (left) and significantly downregulated (right) in HOMER1 KO versus WT mice. Gray indicates proteins that do belong to any of the categories. f Diagram showing the number of either upregulated or downregulated proteins presents in the PSD. Significance was tested by hypergeometric tests. g Cytoscape analysis of PSD proteins with altered levels coded by fold and significance of change. Circular nodes indicate p < 0.05 and rectangular nodes indicate 0.05 ≤ p < 0.1. Edges indicate predicted protein-protein interaction, including experimental data from the STRING database. The size of nodes indicates betweenness centrality. Previously known Homer1/2/3 interactors labeled in emerald. h Levels of Homer2a/b (t(8) = 4.80) and Homer3a/b (t(8) = 2.49) proteins in P2 samples from the cortex of 3-week-old WT or HOMER1 KO mice. n = 5 per each group. *p < 0.05; **p < 0.01; two-tailed Student’s t test was performed. Data are represented as mean ± SEM.

References

    1. Bosch M, Hayashi Y. Structural plasticity of dendritic spines. Curr Opin Neurobiol. 2012;22:383–8. doi: 10.1016/j.conb.2011.09.002. - DOI - PMC - PubMed
    1. Glantz LA, Lewis DA. Decreased dendritic spine density on prefrontal cortical pyramidal neurons in schizophrenia. Arch Gen Psychiatry. 2000;57:65–73. doi: 10.1001/archpsyc.57.1.65. - DOI - PubMed
    1. Hutsler JJ, Zhang H. Increased dendritic spine densities on cortical projection neurons in autism spectrum disorders. Brain Res. 2010;1309:83–94. doi: 10.1016/j.brainres.2009.09.120. - DOI - PubMed
    1. Irwin SA, Galvez R, Greenough WT. Dendritic spine structural anomalies in fragile-X mental retardation syndrome. Cereb Cortex. 2000;10:1038–44. doi: 10.1093/cercor/10.10.1038. - DOI - PubMed
    1. Konopaske GT, Lange N, Coyle JT, Benes FM. Prefrontal cortical dendritic spine pathology in schizophrenia and bipolar disorder. JAMA Psychiatry. 2014;71:1323–31. doi: 10.1001/jamapsychiatry.2014.1582. - DOI - PMC - PubMed

Publication types