. 2021 Feb;6(2):196-208.
doi: 10.1038/s41564-020-00816-5. Epub 2021 Jan 4.

Metabolic cooperation and spatiotemporal niche partitioning in a kefir microbial community

Affiliations

Metabolic cooperation and spatiotemporal niche partitioning in a kefir microbial community

Sonja Blasche et al. Nat Microbiol. 2021 Feb.

Abstract

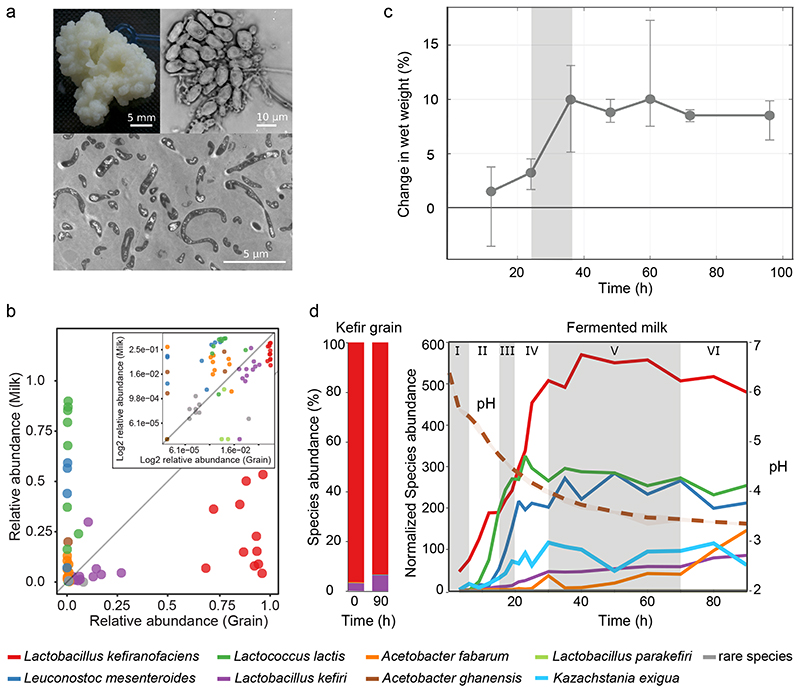
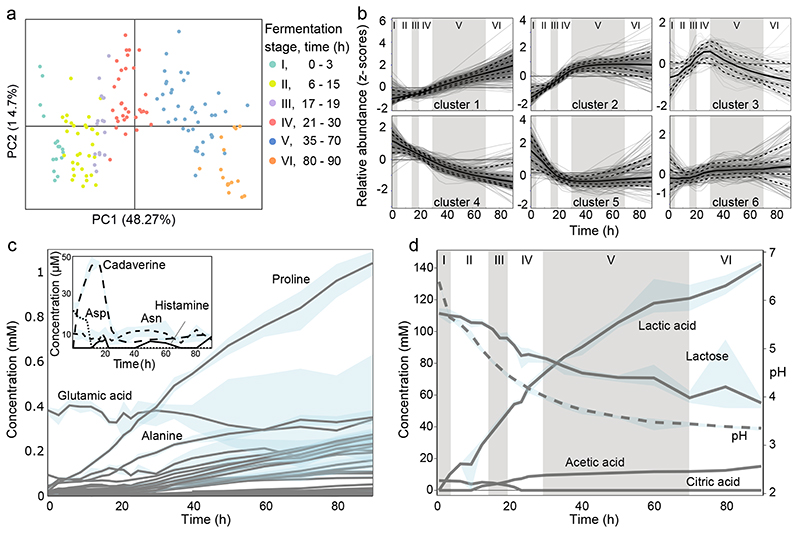
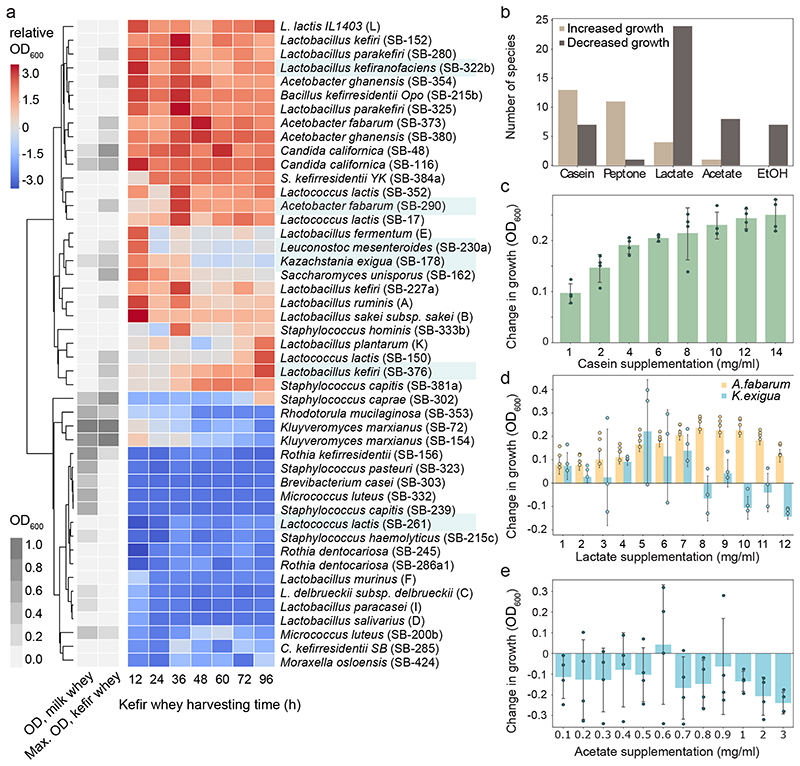
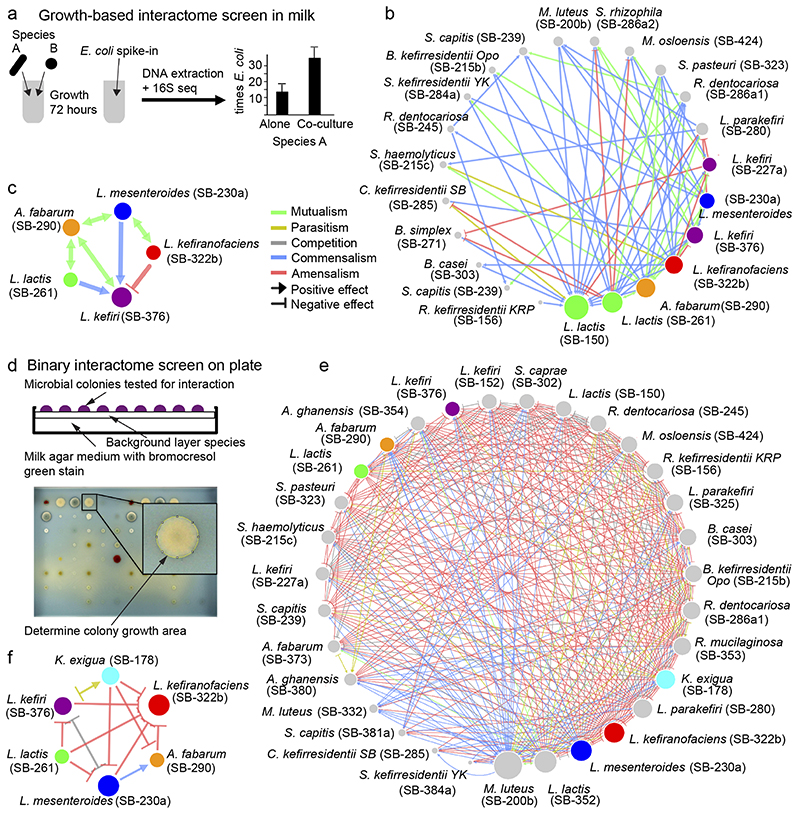
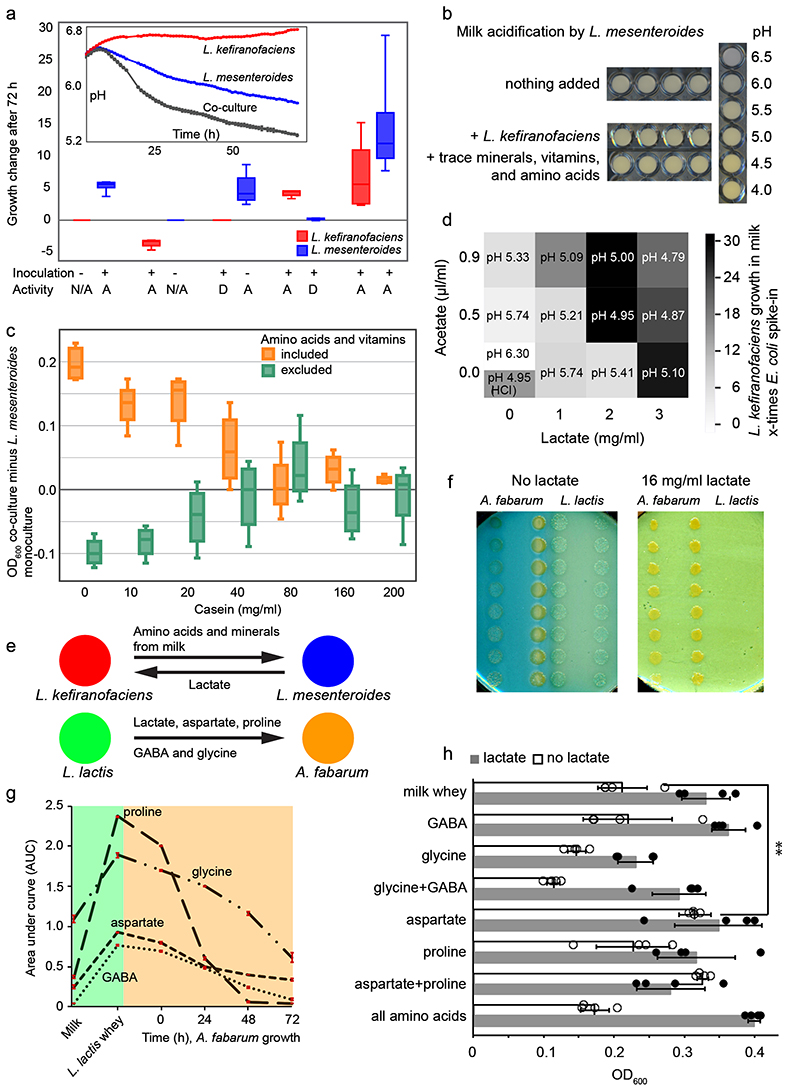
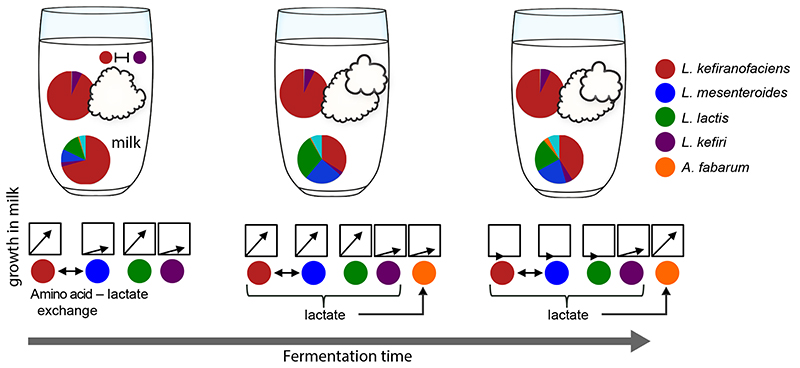
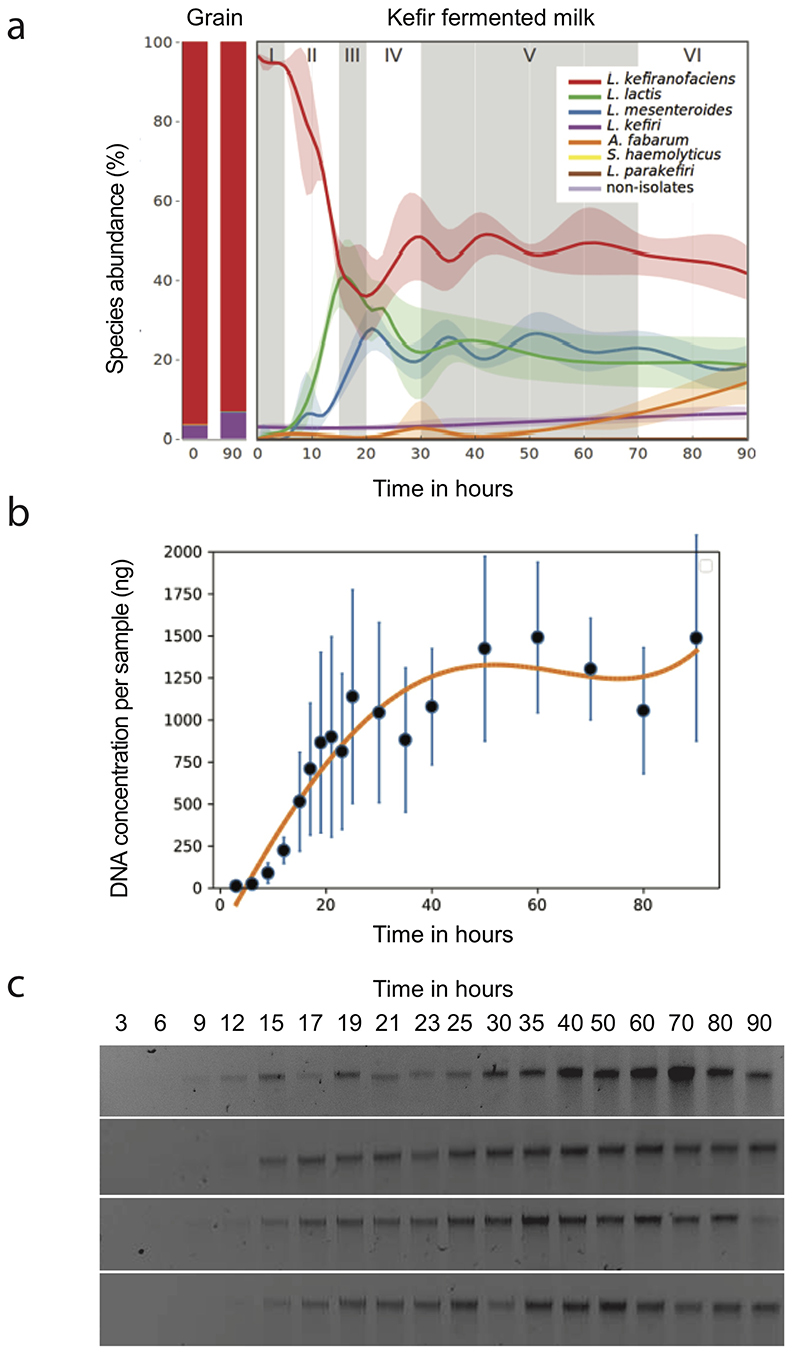
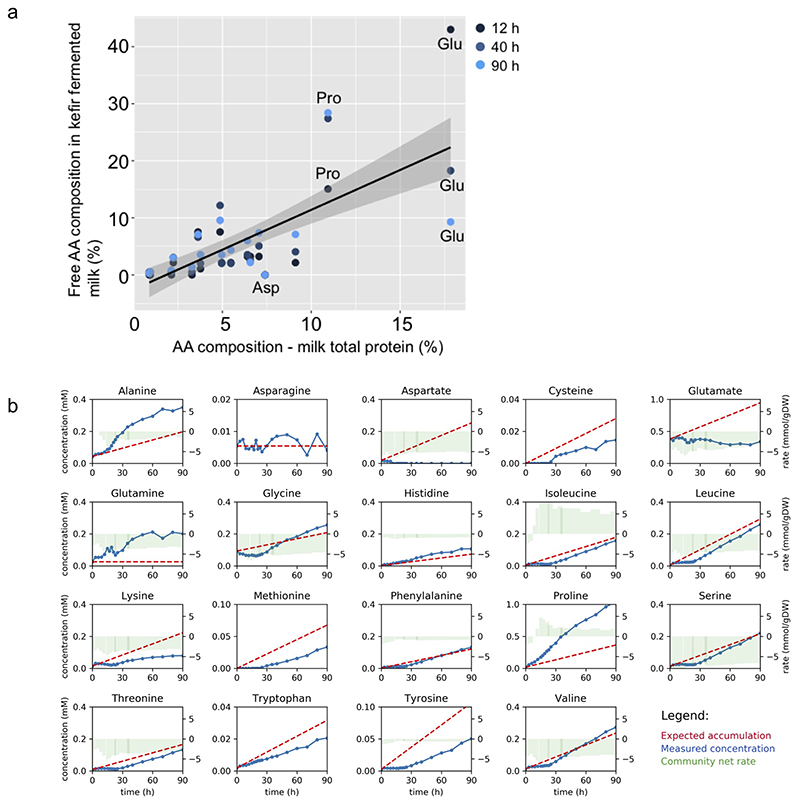
Microbial communities often undergo intricate compositional changes yet also maintain stable coexistence of diverse species. The mechanisms underlying long-term coexistence remain unclear as system-wide studies have been largely limited to engineered communities, ex situ adapted cultures or synthetic assemblies. Here, we show how kefir, a natural milk-fermenting community of prokaryotes (predominantly lactic and acetic acid bacteria) and yeasts (family Saccharomycetaceae), realizes stable coexistence through spatiotemporal orchestration of species and metabolite dynamics. During milk fermentation, kefir grains (a polysaccharide matrix synthesized by kefir microorganisms) grow in mass but remain unchanged in composition. In contrast, the milk is colonized in a sequential manner in which early members open the niche for the followers by making available metabolites such as amino acids and lactate. Through metabolomics, transcriptomics and large-scale mapping of inter-species interactions, we show how microorganisms poorly suited for milk survive in-and even dominate-the community, through metabolic cooperation and uneven partitioning between grain and milk. Overall, our findings reveal how inter-species interactions partitioned in space and time lead to stable coexistence.


Conflict of interest statement

Competing interests

The authors declare no competing interests.

Figures

Fig. 1
Fig. 1. Kefir community undergoes extensive compositional change during milk fermentation.
a, Example images of (top left) macroscopic kefir grain, (top right) light microscopy of a region with high yeast density, and (bottom) and transmission electron microscopy of bacteria embedded in the grain matrix. b, The relative abundances of major kefir bacteria (color key at bottom) in fermented milk are in stark contrast to that in the grain. Each point represents a distinct kefir grain (geographic origin and collection dates in Table S2). (Inset) log-scaled data. c, The reference kefir grain (kefir GER6, OG2) gains weight during milk fermentation. N=4 biologically independent samples; error bars = mean values +/- SD; grey shading marks the time-window of the grain growth (Data in Supplementary Table 18). d, Kefir community undergoes compositional change in milk yet features stable grain composition. (Left) Relative species abundances in the grain at the start and end of fermentation. (Right) Species dynamics in the fermented milk during kefir fermentation (stages labeled) are revealed by 16S amplicon sequencing (bacteria) and qPCR (yeast, K. exigua). Species-abundance estimates are normalized by total DNA yield from extracted samples. Shown values are average over eight replicates (four biological replicates, each with two technical replicates; the relative abundance and their variations are shown in Extended Data Fig. 3a). Dotted line shows pH change during fermentation. See also Supplementary Table 19.
Fig. 2
Fig. 2. Metabolite changes during kefir fermentation depict niche dynamics.
a, Principal component analysis of untargeted metabolomics data shows sequential changes in the milk fraction. Samples are colored according to the six fermentation stages as determined by species dynamics (Fig. 1d). b, Changes in metabolite ions during fermentation reveals diverse patterns including continuous utilization (cluster 4) and bell-shaped pattern suggestive of cross-feeding (cluster 3). All ions detected by FIA-qTOF MS were grouped into 6 clusters via k-means clustering (Methods). Solid line, median values of the ions in each cluster; dashed lines, 10%, 25%, 75%, and 90% of the metabolites, respectively. The six fermentation stages are marked by roman numerals. For a-b, average values are shown from eight replicates (four biological replicates, each with two technical replicates). Quantitative assessment of c, free amino acids and polyamines, and d, carbohydrates and organic acid changes during kefir fermentation suggest major role of the depicted metabolites in orchestrating species dynamics. For c-d, average values are shown from four biological replicates. The blue shaded areas in c and d, indicate the data range. The molecules shown in the inlay of c are present at low concentrations. Only a small amount of histamine is produced during kefir fermentation, and though cadaverine – an undesired by-product - accumulated early on, its concentration dropped to very low levels by 24 h.
Fig. 3
Fig. 3. Growth performance of individual kefir community members highlight inter-species dependencies for milk colonization.
a, Growth of kefir isolates in milk whey and kefir whey (community-spent medium) are in contrast. Grey, growth measurements (OD600) in milk whey (left column) and maximum growth across kefir whey collected at different harvesting time (right column). The heatmap shows species growth in kefir whey harvested at different time points relative to that in the milk whey. Species names in blue highlight most abundant kefir species in kefir GER6. b, Growth of kefir community members is impacted by major fermentation products (lactate, acetate, and ethanol (EtOH)) and by protein sources casein and peptone added to milk whey (Methods). Shown are the number of species (counts) with increased or decreased growth for each product. Species displaying significant changes (two-sided t-test, p<0.01; N=4) in at least 70% of the concentrations tested were considered to be promoted or suppressed by the tested component. Raw data is available in Supplementary Table 20. c, Adding casein increases the growth of L. lactis. During whey preparation, most of the casein is removed, so that milk whey only contains ~20% of the protein content of bovine milk. Protein supplementation of milk whey with 1-16 mg/ml casein hydrolysate partially restores natural protein content. d, Lactate supports Acetobacter and K. exigua growth in milk whey at different concentrations. e, Acetate has no supportive effect on the growth of K. exigua. In c-e, changes in species growth are assessed relative to growth in non-supplemented milk whey. N=4, biologically independent samples with exception of K. exigua in d (N=3); error bars = mean values +/- SD.
Fig. 4
Fig. 4. Interactions between kefir community members are extensive and qualitatively differ between solid and liquid phases.
a, Schematic of the method used to assess growth-promoting or growth-inhibiting interactions between kefir species in milk. Species abundance in mono- and co-cultures was assessed via 16S amplicon sequencing with quantitative E. coli spike-in. b-c, Kefir species (b – all tested species, c – abundant species) exhibit predominantly positive (commensal and mutualistic) interactions in milk. In b-c, data are based on three biological replicates. d, (Top) Schematic of the method used to detect species interactions on milk plates (Methods). Each species was plated as a background layer on milk plates containing bromocresol green; all query species were pinned on top. (Bottom) Colony area was assessed as a growth metric. e-f, Kefir species (e – all tested species, f – abundant species) exhibit predominantly negative interactions on milk plates. Node size represents the number of interactions with other species. Data are based on at least four biological replicates for each interaction pair.
Fig. 5
Fig. 5. Unraveling selected metabolic interactions in kefir.
a, L. kefiranofaciens and L. mesenteroides benefit from each other when both species are alive. While L. kefiranofaciens benefits from dead L. mesenteroides, L. mesenteroides only profits from live L. kefiranofaciens. D=dead (heat or ethanol treated), A=alive, N/A=not present. N=4, biologically independent samples; the boxplot represents the interquartile range including the median, and the ends of the whiskers represent ±1.5× interquartile range. b, Addition of amino acid mix, vitamin mix, and trace minerals enhances milk acidification by L. mesenteroides in a way comparable to co-culture with L. kefiranofaciens. c, Difference between L. mesenteroides growth in monoculture and its co-culture with L. kefiranofaciens underlines the role of proteolytic activity in the interaction between these two species. Shown are the data based on growth (OD600) in milk whey enriched with amino acids, vitamins, and varying amounts of casein peptides. N=4, biologically independent samples; the boxplot represents the interquartile range including the median, and the ends of the whiskers represent ±1.5× interquartile range. Grey shaded boxes, separators between adjacent casein peptide levels. d, Supplementation of lactate and acetate in various proportions supports the growth of L. kefiranofaciens in milk by a combination of lowering pH (which alone improves growth at pH 4.95, adjusted with HCl) and increasing lactate availability. Acetate supplementation does not exceed the effect of pH alone (N=4, biologically independent samples). e, Metabolites exchanged between L. kefiranofaciens and L. mesenteroides and between A. fabarum and L. lactis. f, Growth of A. fabarum and L. lactis on milk agar plates with and without lactate supplementation (16 mg/ml) suggests lactate cross-feeding. g, Aspartate, proline, glycine, and GABA are cross-fed between L. lactis and A. fabarum (N=3; error bars, standard deviation). h, Acetobacter growth in milk whey, and in milk whey plus 8 mg/ml lactate, supplemented with various amino acids and GABA. Lactate additionally boosts Acetobacter growth in all cases except aspartate (and aspartate plus proline) supplementation. N=4; error bars, standard deviation; **p=0,0054 (two-sided t-test). Data for Fig. 5c, d and h can be found in Supplementary Tables 21, 22 and 23, respectively. Data are presented as mean values +/- SD.
Fig. 6
Fig. 6. Kefir community exhibits a “basecamp lifestyle”.
The community in the grain undergoes only minor compositional changes, while the community of microbes that colonizes the milk fraction continuously changes as fermentation proceeds. The grain thus serves as a basecamp that provides inoculum for orderly milk colonization with accompanying metabolite dynamics (Fig. 1 and 2). This basecamp also serves as a reservoir of community members for the next transfer into fresh milk.
Extended Data Fig. 1
Extended Data Fig. 1. Additional information related to Fig. 1d.
a, Temporal dynamics of bacterial composition during fermentation in the kefir fermented milk assessed by 16S amplicon sequencing. The non-isolates represent the sum of all species, which are not in the kefir isolate collection. The fermentation is split into 6 different stages depending on the abundance changes of the major species. The shaded area marks the data range. N=4, biologically independent samples. b, Fitting of DNA concentration dynamics to sigmoid curve. N=4, biologically independent samples, error bars = mean values +/- SD. c, DNA extracted from fermentation samples. DNA concentration estimates, measured using Qubit (Supplementary Table 19), were used to determine absolute abundances shown in Fig. 1d. Raw gel images are depicted in Supplementary Fig. 3.
Extended Data Fig. 2
Extended Data Fig. 2. Amino acid dynamics in milk and kefir fermented milk.
a, Comparison of amino acid composition of milk total protein with that of free amino acids observed in kefir after 12 h, 40 h, and 90 h fermentation. Milk total protein amino acid composition used is average from two previous reports (Park, 2007; Schönfeldt et al., 2011),. Lines depict the best linear fit and grey shading the 95% confidence interval of the linear fit. b, Comparison of expected accumulation (red dotted lines) and measured concentrations (blue lines) of amino acids in milk kefir. Green bars indicate the model-based estimation of uptake (negative values) and secretion (positive values) by kefir microbes.
Extended Data Fig. 3
Extended Data Fig. 3. Effect of EDTA and protein addition on grain wet-weight gain after 72 h fermentation.
Kefir grains grown in whey harvested after 36 h fermentation reveal decreased growth that is restored by casein supplementation. Addition of EDTA inhibits grain growth in both milk and casein-supplemented kefir whey. N=4, error bars =SD.
Extended Data Fig. 4
Extended Data Fig. 4. Effect of acetate on growth of K. exigua, R. mucilaginosa, S. unisporus, and K. marxianus. S. unisporus and K. marxianus profit from low acetate concentrations
K. exigua and R. mucilaginosa, are inhibited even by small acetate supplements. Changes in species growth are assessed relative to growth in non-supplemented milk whey. N=4, biologically independent samples, error bars = mean values +/- SD.
Extended Data Fig. 5
Extended Data Fig. 5. Lactate concentration shapes consecutive time-windows of growth of Kazachstania exigua (yeast) and Acetobacter fabarum
a, Evolution of lactate and acetate concentration during kefir fermentation. Different symbols mark data from replicates (N=4). Colored block arrows indicate optimal lactate concentration ranges for the K. exigua and A. fabarum (Fig. 3d). Dotted lines connect the time-windows corresponding to these concentration ranges to the time-windows in panel B. b, Growth of kefir species over time with dotted lines marking the time-windows corresponding to the lactate concentration ranges from (a). c, Growth of K. exigua and A. fabarum in kefir spent whey harvested at different time points (N=4 biologically independent samples; error bars = SD). Data are presented as mean values +/- SD.
Extended Data Fig. 6
Extended Data Fig. 6. Interaction network between kefir species based on milk acidification assay.
a, Schematic depiction of the method used to map metabolic interactions based on fermentation acidification kinetics. Species were grown in 96-well plates alone or in pairs; acidification of milk was assessed with a soluble pH-indicator. Positive interactions were identified as those that showed increased acidification in co-culture compared to mono-cultures, while negative interactions as those that showed decreased acidification in co-culture. b, Network of metabolic interactions between kefir species (Interaction calling based on N = 6; 3 biological and 2 technical replicates). Node sizes indicate number of interactions. Raw R-values extracted from scan images are provided in Supplementary Table 24.
Extended Data Fig. 7
Extended Data Fig. 7. Kefir grain growth profits from rare species and supplements
Different kefir species were supplemented to the UHT-milk used for kefir propagation in this study (Methods). This suspension was then used as a medium to grow kefir grains in. The gain in wet-weight after 3 passages (circa 1 week) was then compared to kefir grains grown in milk and milk supplemented with proteinase K and yeast extract, respectively. Compared to the negative control, many rare species and few main kefir species supported the growth of the kefir grain. However, the effect of addition of proteinase K and yeast extract to the milk medium had the biggest effect on grain growth. Significance estimated by using two-sided t-test, p-values: * <0.05, ** <0.01, *** <0.001. N=4 biologically independent samples, data are presented as mean values +/- SD. P-values: L. mesenteroides, 0,045; L. lactis (SB-150), 0,00034; S. haemolyticus, 0,0026; R. dentocariosa, 0,0012; Rhodotorula, 0,033; proteinase K, 0,00018; yeast extract, 8,83351E-07.
Extended Data Fig. 8
Extended Data Fig. 8. Contrast between the prevalence of positive and negative interactions between kefir species in milk (Liquid) and on milk plates (Solid).
Extended Data Fig. 9
Extended Data Fig. 9. Integrated view of metabolite cross-feeding between, left: L. kefiranofaciens and L. mesenteroides, and right: L. lactis and A. fabarum, based on genome-scale metabolic modeling, gene expression data and metabolite measurements.
The colored metabolic maps connected to species mark reactions in the metabolic network that are assessed to be up- or down-regulated in co-cultures.
Extended Data Fig. 10
Extended Data Fig. 10. Kefir community shift when passaged using kefir fermented milk as an inoculum instead of the kefir grain.

References

    1. Mueller DB, Vogel C, Bai Y, Vorholt JA. The Plant Microbiota: Systems-Level Insights and Perspectives. 2016 doi: 10.1146/annurev-genet-120215-034952. - DOI - PubMed
    1. Palleja A, et al. Recovery of gut microbiota of healthy adults following antibiotic exposure. Nat Microbiol. 2018;3 - PubMed
    1. Faith JJ, et al. The Long-Term Stability of the Human Gut Microbiota. Science. 2013;340 - PMC - PubMed
    1. Shade A, et al. Lake microbial communities are resilient after a whole-ecosystem disturbance. ISME J. 2012;6:2153–2167. - PMC - PubMed
    1. Allesina S, Tang S. Stability criteria for complex ecosystems. Nature. 2012;483:205–208. - PubMed

Publication types