. 2021 Jan 4;4(1):27.
doi: 10.1038/s42003-020-01543-7.

Systemic viral spreading and defective host responses are associated with fatal Lassa fever in macaques

Affiliations

Systemic viral spreading and defective host responses are associated with fatal Lassa fever in macaques

Nicolas Baillet et al. Commun Biol. .

Abstract

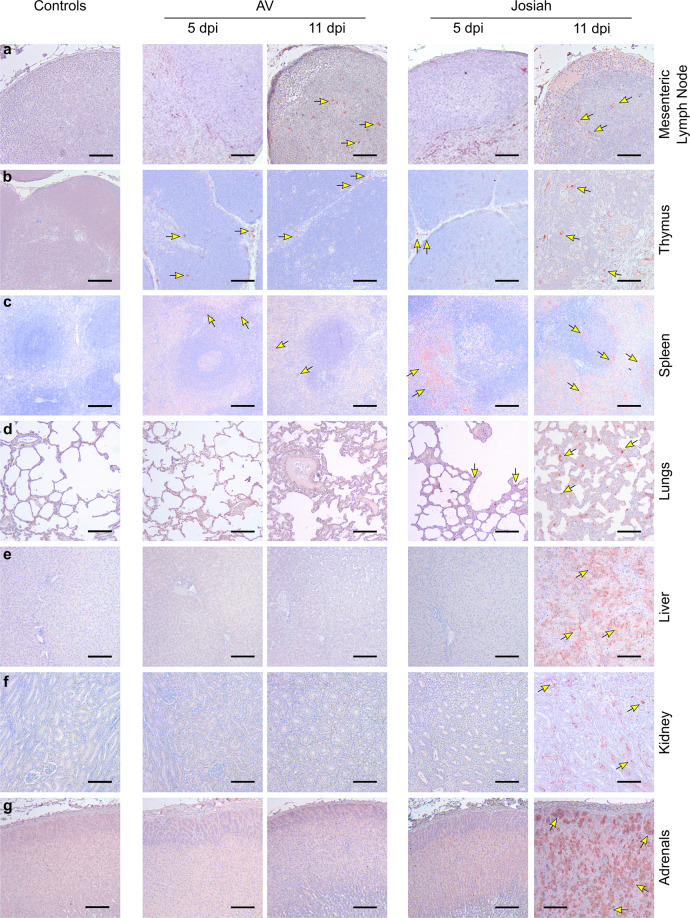
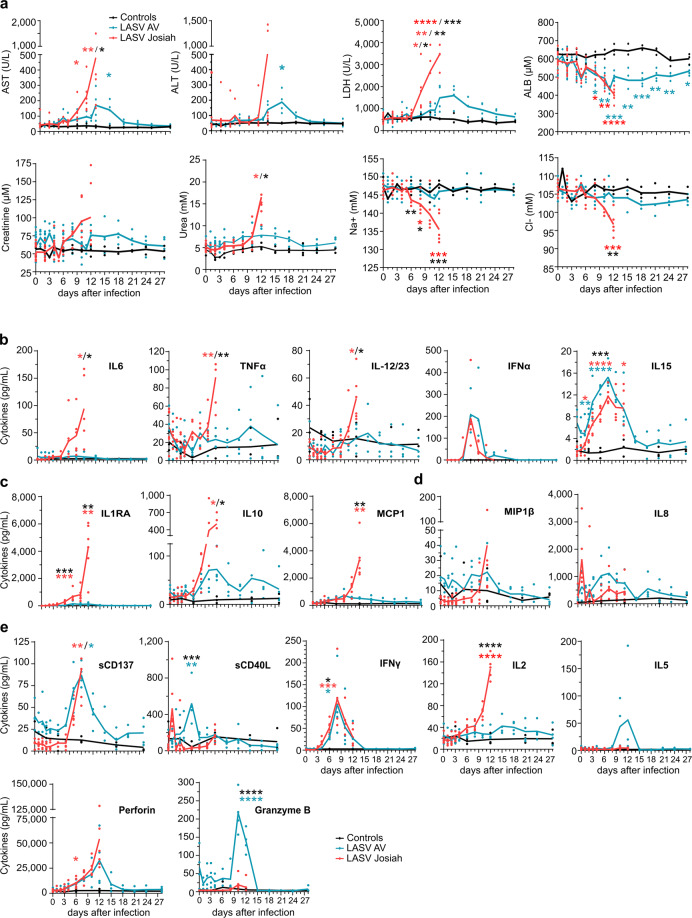
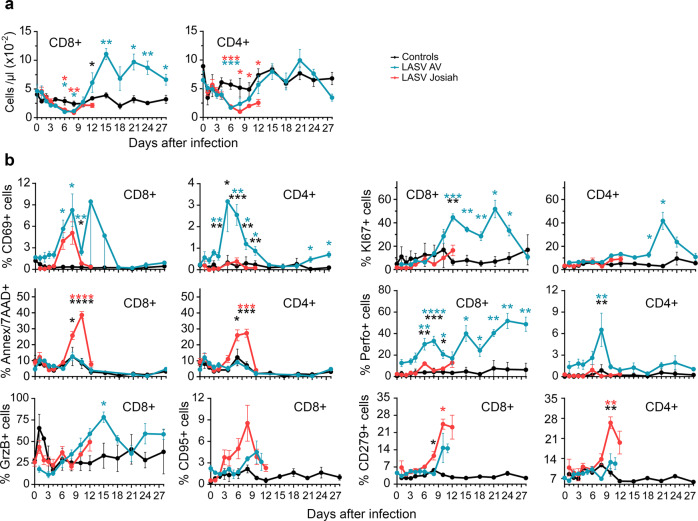
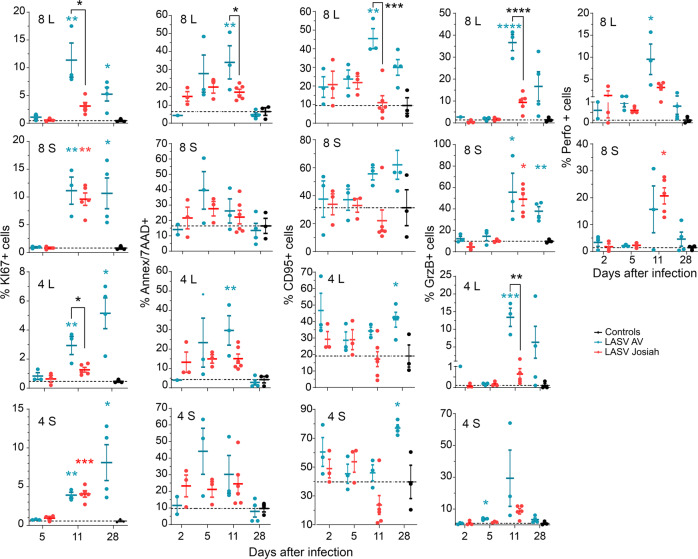
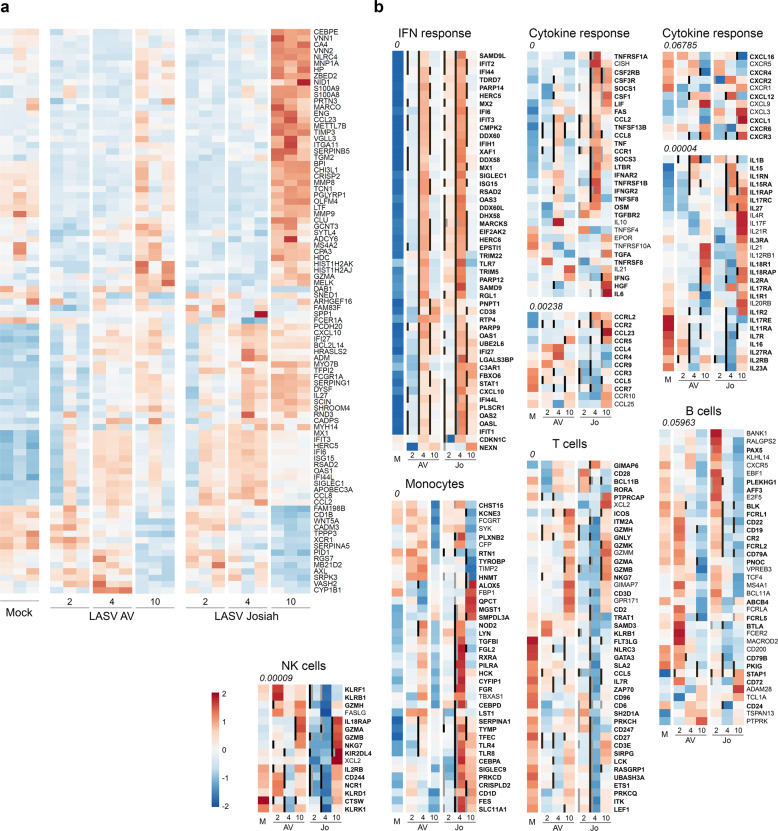
Lassa virus (LASV) is endemic in West Africa and induces a viral hemorrhagic fever (VHF) with up to 30% lethality among clinical cases. The mechanisms involved in control of Lassa fever or, in contrast, the ensuing catastrophic illness and death are poorly understood. We used the cynomolgus monkey model to reproduce the human disease with asymptomatic to mild or fatal disease. After initial replication at the inoculation site, LASV reached the secondary lymphoid organs. LASV did not spread further in nonfatal disease and was rapidly controlled by balanced innate and T-cell responses. Systemic viral dissemination occurred during severe disease. Massive replication, a cytokine/chemokine storm, defective T-cell responses, and multiorgan failure were observed. Clinical, biological, immunological, and transcriptomic parameters resembled those observed during septic-shock syndrome, suggesting that similar pathogenesis is induced during Lassa fever. The outcome appears to be determined early, as differentially expressed genes in PBMCs were associated with fatal and non-fatal Lassa fever outcome very early after infection. These results provide a full characterization and important insights into Lassa fever pathogenesis and could help to develop early diagnostic tools.


Conflict of interest statement

The authors declare that they have no competing interests.

Figures

Fig. 1
Fig. 1. Clinical and virological features of Lassa fever.
a Clinical score, survival rate, and monitoring of body temperature are presented. Results show mean values and individual data for each cohort, except for survival rate, represented with a Kaplan–Meier curve. Controls (n = 3), LASV-AV (n = 4), LASV-Josiah (n = 6). *p < 0.05, **p < 0.01, ***p < 0.001, ****p < 0.0001, as determined by a one-way ANOVA multiple comparisons test for analysis between controls and AV- and Josiah-infected animals and by a t test for comparison between only controls and AV-infected NHPs. Red asterisks indicate a significant difference between LASV-Josiah and controls, blue asterisks a significant difference between LASV-AV and controls, and black asterisks a significant difference between LASV-Josiah and LASV-AV. b Quantification of viral load and infectious particles in the plasma of animals according to the time after LASV infection. Mean values of each cohort and individual data points are presented as the number of viral RNA copies/ml (viral load) or FFU/ml (infectious particles) according to the time after challenge with AV (blue dots) or Josiah (red dots). LASV-AV (n = 4), LASV-Josiah (n = 6). The individual data at the time before the death of all LASV-Josiah-infected primates were used to calculate the mean determined at 12 DPI *p < 0.05, **p < 0.01, as determined by a Student’s t test. c Quantification of viral RNA copies and infectious particles per milligram of various tissues, including inguinal lymph nodes (ILN), mesenteric lymph nodes (MLN), small intestine (Small int.), large intestine (Large int.), the reproductive system (ovaries or testicles) (Reprod. system), and cerebrospinal fluid (CSF) at 2 (left panel), 5 (middle panel), and 11 (right panel) DPI. Individual and mean values are presented for the two cohorts. *p < 0.05, as determined by a Student’s t test.
Fig. 2
Fig. 2. Examples of LASV spreading as a function of the severity of the disease.
Immunohistochemistry of LASV-GP (red) during the course of the disease in a MLNs, b thymus, c spleen, d lungs, e liver, f kidneys, and g adrenal glands. a, b Scale bars: 100 µm. cg Scale bars: 200 µm. Key immunohistological features are indicated by arrows.
Fig. 3
Fig. 3. Biochemical and inflammatory responses monitoring after LASV challenge.
a Analysis of biological parameters during LASV infection. The data from longitudinally followed and sequentially killed animals at 2, 5, and 11 DPI were collected: controls (n = 3 animals), LASV-AV (n = 10), LASV-Josiah (n = 12). The individual data at the time before the death of all longitudinally followed LASV-Josiah-infected primates were collected to calculate the mean determined at 12 DPI. Results show the mean (curve) and individual data points for each group. Statistical analyses were performed and are presented as in Fig. 1. Quantification of pro-inflammatory cytokines b, anti-inflammatory cytokines c, chemokines d, and T-cell response-related mediators e in plasma according to the time after LASV infection. be Results show the mean (curve) and individual data points for each group: controls (n = 3), LASV-AV (n = 4), LASV-Josiah (n = 6). Statistical analyses were performed and are presented as in Fig. 1.
Fig. 4
Fig. 4. Analysis of circulating innate immune cells after LASV challenge.
a The number of leukocytes, granulocytes, mDC (HLA-DR+ CD14 CD1c+ and HLA-DR+ CD14 CD11c+), and monocytes (HLA-DR+ CD14+) in the blood is presented according to the time after LASV infection. The percentage of CD10 cells among granulocytes is also presented. The percentage of monocytes expressing CD80, CD86, or CD40 is shown. Results show the mean ± standard error of the mean (SEM) for each group: controls (n = 3), LASV-Josiah (n = 6, except for day 14 where n = 2) and AV-infected animals (n = 4) were analyzed for leukocyte, granulocyte, CD10, and monocyte numbers. For mDC, CD80, CD86, and CD40 analysis, six AV-infected animals were analyzed from day 0 to 6 and three of them from day 8 to 11. b The number of circulating NK cells (CD8+ CD3 CD20 cells) is presented, as well as the percentage of KI67+, CD107a+, NKp80+, and NKG2D+ cells among NK cells (n = 3 for controls, n = 6 for LASV-Josiah, and n = 4 for AV-infected animals). Statistical analyses were performed and are presented as in Fig. 1. Individual values can be found in Supplementary data 1 for a and b. c The proportion of NK cells (CD8+ CD3 CD20) expressing KI67, (granzyme B) GrzB, CD107a, CXCR3, and NKp80 was quantified in spleen (S, upper graphs) and MLN (L, lower graphs) of controls (n = 3), AV- (n = 3), and Josiah-infected (n = 3) animals, as well as the percentage of CD16+ CD56 cells among NK cells. Individual values and mean ± SEM are expressed for each group. Statistical analyses were performed and are presented as in Fig. 1.
Fig. 5
Fig. 5. Analysis of B-cell responses after LASV challenge.
a The number of B cells (CD20+) in the blood is presented according to the time after LASV infection. Results show the mean ± SEM of control (n = 3), AV (n = 4), and Josiah (n = 6) animals. b Detection of LASV-specific IgM and IgG in animals after LASV infection by ELISA. Individual data (points) and mean values ± SEM for each cohort (curves) are presented. LASV-AV (n = 4), LASV-Josiah (n = 6). **p < 0.01, ***p < 0.001, as determined by a Student’s t test. The percentage of naive/unconventional memory (N/UM) B cells (CD20+ CD38mid CD27 CD10), of conventional memory (CM) B cells (CD20+ CD38mid CD27+ CD10), and of plasma B cells (CD20low CD38bright CD27+) among B cells (CD20+) is presented, as well as the percentage of KI67+ cells among N/UM and CM B cells is presented for blood c and spleen (S, upper graphs) and MLN (L, lower graphs). Individual values can be found in Supplementary data 1 for a, b and c. d The percentage of KI67+ among transitional memory (TM) B cells (CD20+ CD38mid CD10+ CD27) is also presented for SLOs. Results show the mean ±SEM of control (n = 3), AV (n = 4 for PBMC and three for SLOs), and Josiah (n = 6 and three for SLOs) animals, as well as individual values. Statistical analyses were performed and are presented as in Fig. 1.
Fig. 6
Fig. 6. Analysis of T-cell responses in PBMC after LASV challenge.
a The number of CD8+ and CD4+ T cells in the blood is presented according to the time after LASV infection. b The percentage of circulating CD8+ (left) and CD4+ (right) T cells expressing CD69, KI67, Annexin V and 7AAD (Ann/7AAD), perforin (Perfo), GrzB, CD95, or CD279 is shown according to the time after LASV infection. Results show the mean ± SEM of control (n = 3), AV (n = 4), and Josiah (n = 6) animals. Statistical analyses were performed and are presented as in Fig. 1. Individual values can be found in Supplementary data 1.
Fig. 7
Fig. 7. Analysis of T-cell responses in SLO.
The percentage of CD8+ and CD4+ T cells in MLNs (L) and spleen (S) expressing KI67, Annexin V and 7AAD (Ann/7AAD), CD95, GrzB, or perforin (Perfo) is presented in control (black dots), AV-infected (blue dots), and Josiah-infected (red dots) animals. Results show the individual data and the mean ± SEM for each group (n = 3). *p < 0.05, **p < 0.01, ***p < 0.001, ***p < 0.0001, as determined by a one-way ANOVA or a Kruskal–Wallis multiple comparisons test. Significant differences are presented as in Fig. 1.
Fig. 8
Fig. 8. Analysis of transcriptomic data of PBMCs.
a Heatmap of the 100 most differentially expressed (DE) genes (absolute Log2 fold-change larger than 5). Gene expression was standardized using VST transformation, hence centered and scaled to make the gene expression comparable. Each column corresponds to the mean gene expression of the three animals of each group for a given timepoint. b Heatmap of gene expression of six gene sets. Significant genes are highlighted with bold labels and corresponding significant comparisons are displayed by gray (significant difference between Josiah and AV for a given day) and black vertical bars (significant difference with the mock condition). Gene expression was standardized using VST transformation, centered and scaled to make the gene expression comparable, hence averaged by condition and timepoint. An enrichment test was performed, using a one-tailed Fisher test. P values were adjusted on multiple comparisons using Benjamini–Hochberg correction and were presented under the gene set name.
Fig. 9
Fig. 9. Analysis of transcriptomic data of organs and of genes related to sepsis in PBMCs.
Heatmap of gene expression of five gene sets in spleen a MLN, b, and liver c presented as in Fig. 8b, except that only the DE genes are listed. Gene expression was standardized using VST transformation, hence centered and scaled to make the gene expression comparable. Each column corresponds to the mean gene expression of the three animals of each group for a given timepoint. The Log2 fold-changes of genes found DE in this study and known to be upregulated d or downregulated e in PBMCs during severe sepsis were calculated between PBMCs of LASV-infected and mock animals and represented by light and dark colors for 4 and 10 DPI, respectively.
Fig. 10
Fig. 10. Identification of genes that can be used as early markers of infection and severity.
a Individual probabilities of infection status estimated by a random forest: each dot represents an estimation of the probability for an animal to be infected or not, at 2, 4, and 10 DPI and at 28 DPI for mock animals: the higher the probability, the greater the risk of an animal being infected. Josiah-infected animals are represented by red dots, AV-infected animals by blue dots, and mock-infected animals by green dots. The mean probability ± SEM is represented in red for Josiah, blue for AV, and black for mock animals. Probabilities were computed by applying the random forest method to the gene expression of OAS2, OASL, IFIT3, IFI44L-201, SCO2, USP18, and CCL8. The kinetics of Log2 normalized counts are also shown for each gene. b Individual probabilities to have a severe/fatal LASV infection were estimated and are represented as in a, except that mock animals were not included in this analysis. Probabilities were computed by applying the random forest method to the gene expression of CPED1, CCR1, ARG2, PLVAP, SORBS3, and 40S RPS7. c Heatmaps of DE genes in PBMCs at 1 DPI. The genes that were statistically associated with infection status are indicated by a blue asterisk, whereas those associated with disease severity/lethal outcome are indicated by a red asterisk. Gene expression was standardized using VST transformation, hence centered and scaled to make the gene expression comparable. Each column displays gene expression of a given animal. The expression of CPED1, ARG2, PLVAP, and SORBS3 1 DPI in PBMCs of Josiah- and AV-infected NHPs is represented at the bottom by red and blue dots, respectively. The DE of the other genes selected in a and b was not significant at 1 DPI and are therefore not represented. Transcriptomic changes measured 1 DPI could not be compared with other samples as the sequencing of these mRNA was not performed together with the others.

References

    1. Sogoba N, Feldmann H, Safronetz D. Lassa fever in West Africa: evidence for an expanded region of endemicity. Zoonoses Public Health. 2012;59:43–47. doi: 10.1111/j.1863-2378.2012.01469.x. - DOI - PubMed
    1. Yadouleton A, et al. Lassa fever in Benin: description of the 2014 and 2016 epidemics and genetic characterization of a new Lassa virus. Emerg. Microbes Infect. 2020;9:1761–1770. doi: 10.1080/22221751.2020.1796528. - DOI - PMC - PubMed
    1. Olayemi A, et al. New hosts of the Lassa virus. Sci. Rep. 2016;6:25280. doi: 10.1038/srep25280. - DOI - PMC - PubMed
    1. Kafetzopoulou LE, et al. Metagenomic sequencing at the epicenter of the Nigeria 2018 Lassa fever outbreak. Science. 2019;363:74–77. doi: 10.1126/science.aau9343. - DOI - PMC - PubMed
    1. Bowen MD, Peters CJ, Nichol ST. Phylogenetic analysis of the Arenaviridae: patterns of virus evolution and evidence for cospeciation between Arenaviruses and their rodent hosts. Mol. Phylogen. Evol. 1997;8:301–316. doi: 10.1006/mpev.1997.0436. - DOI - PubMed

Publication types

LinkOut - more resources