. 2021 Jan;27(1):58-65.
doi: 10.1038/s41591-020-1126-7. Epub 2021 Jan 4.

Brown adipose tissue is associated with cardiometabolic health

Affiliations

Brown adipose tissue is associated with cardiometabolic health

Tobias Becher et al. Nat Med. 2021 Jan.

Abstract

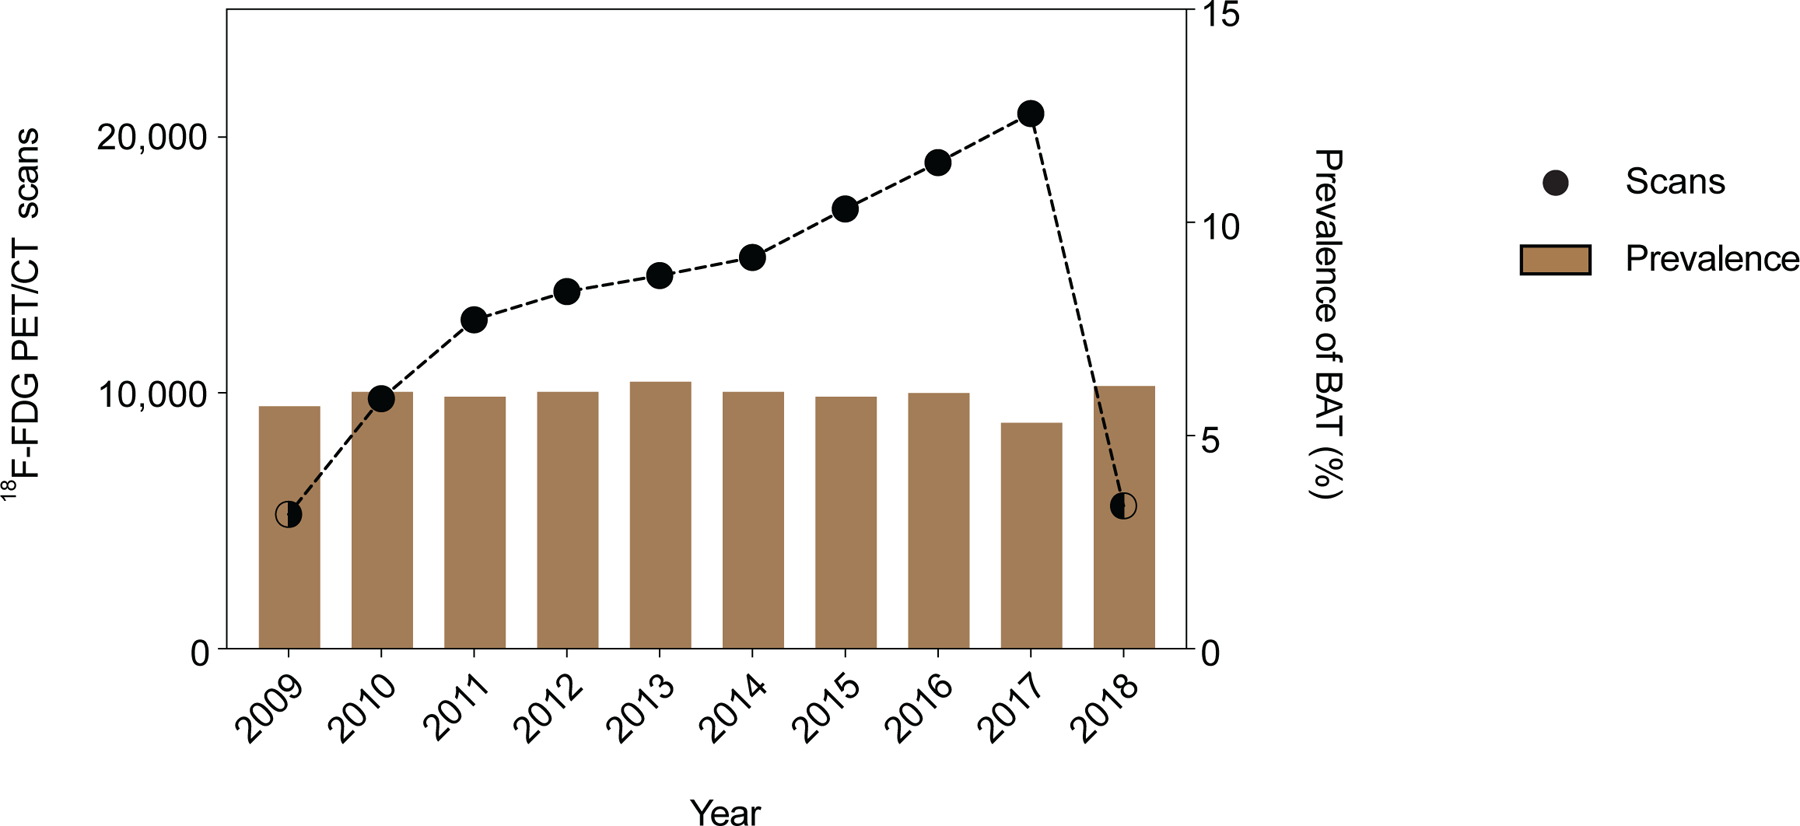
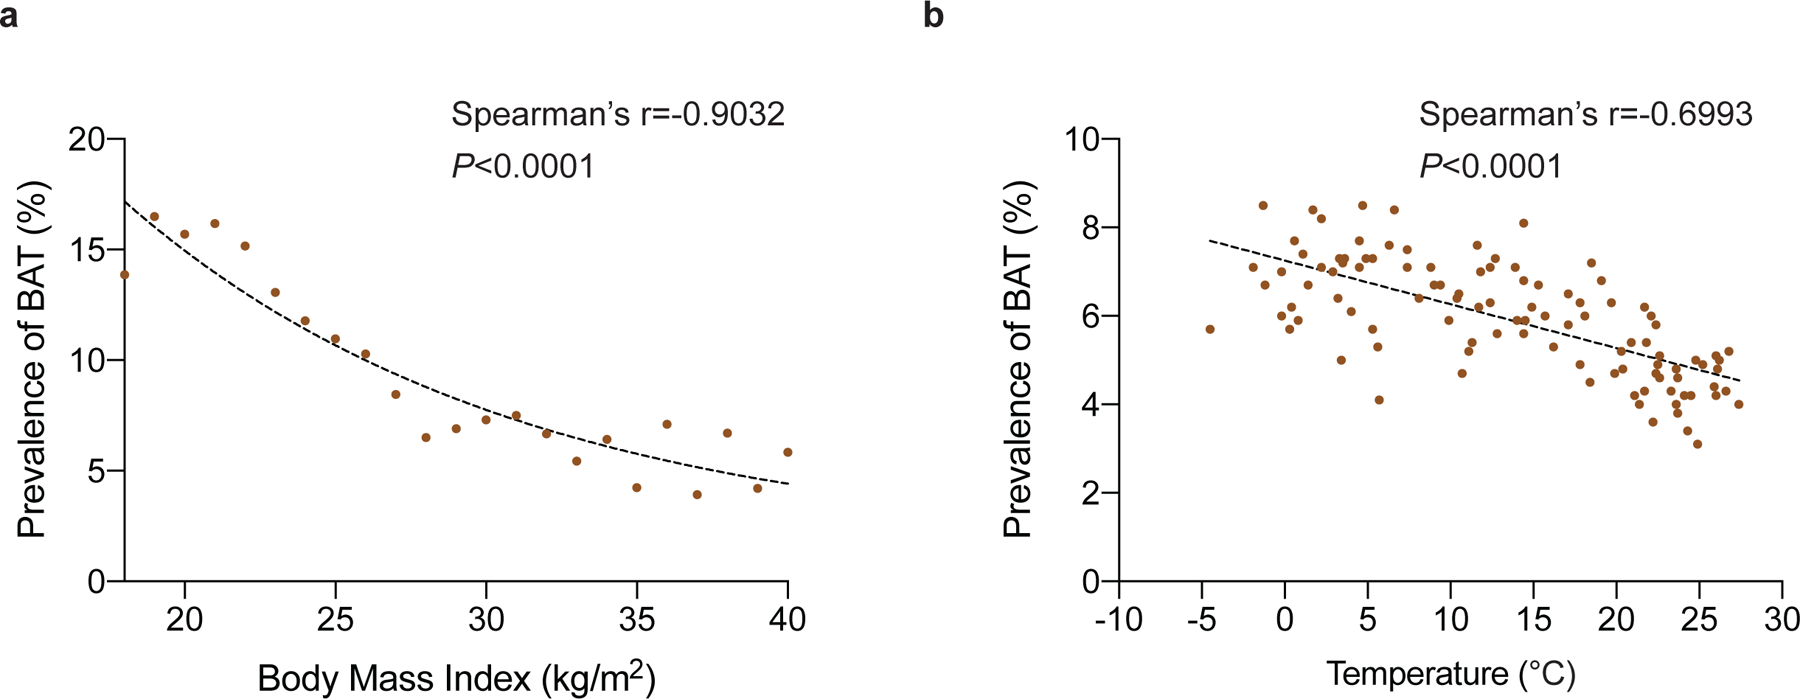
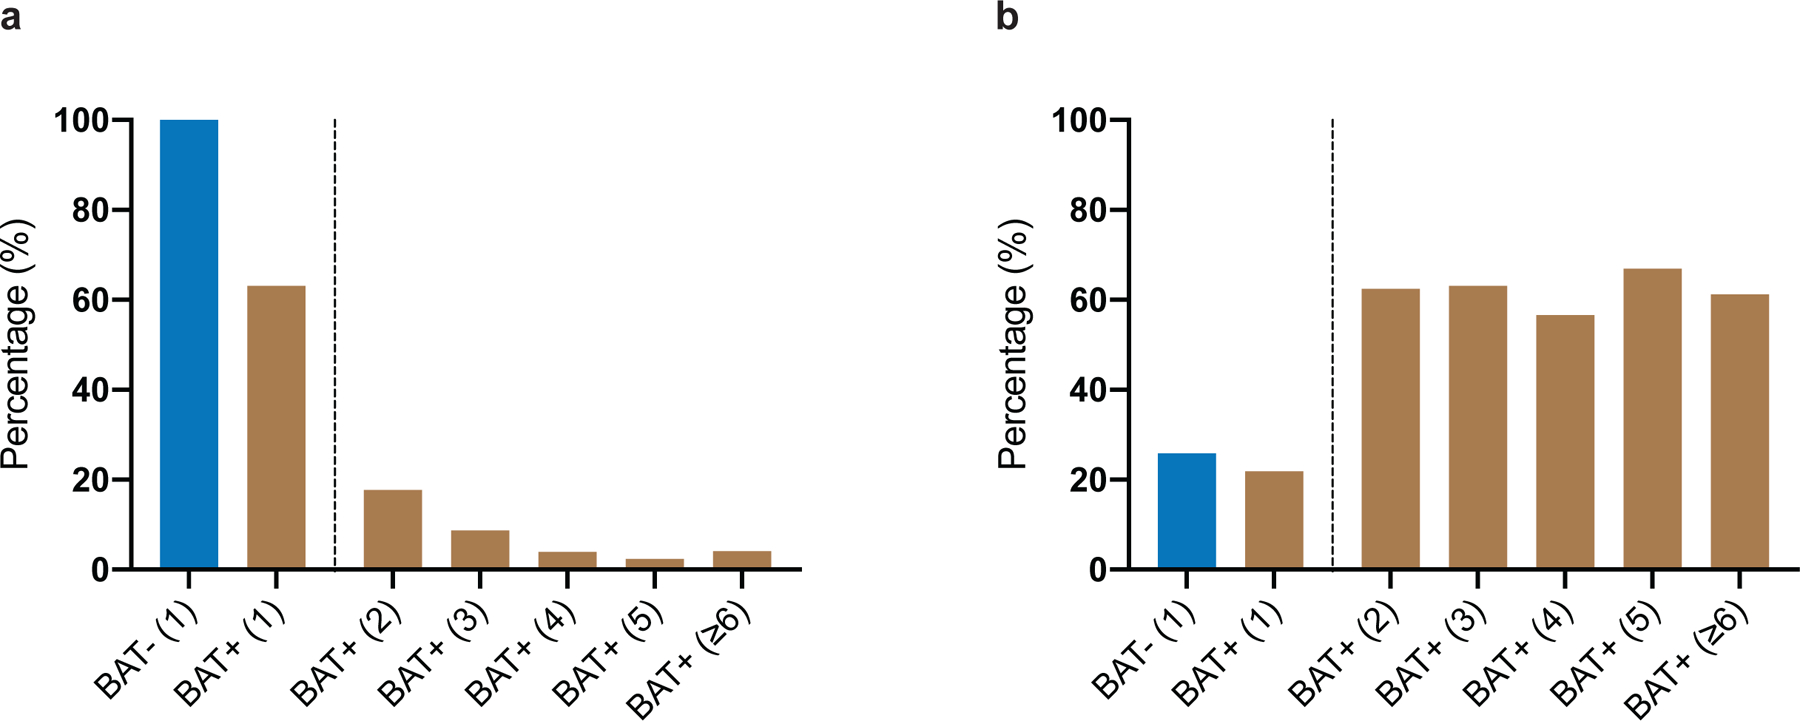
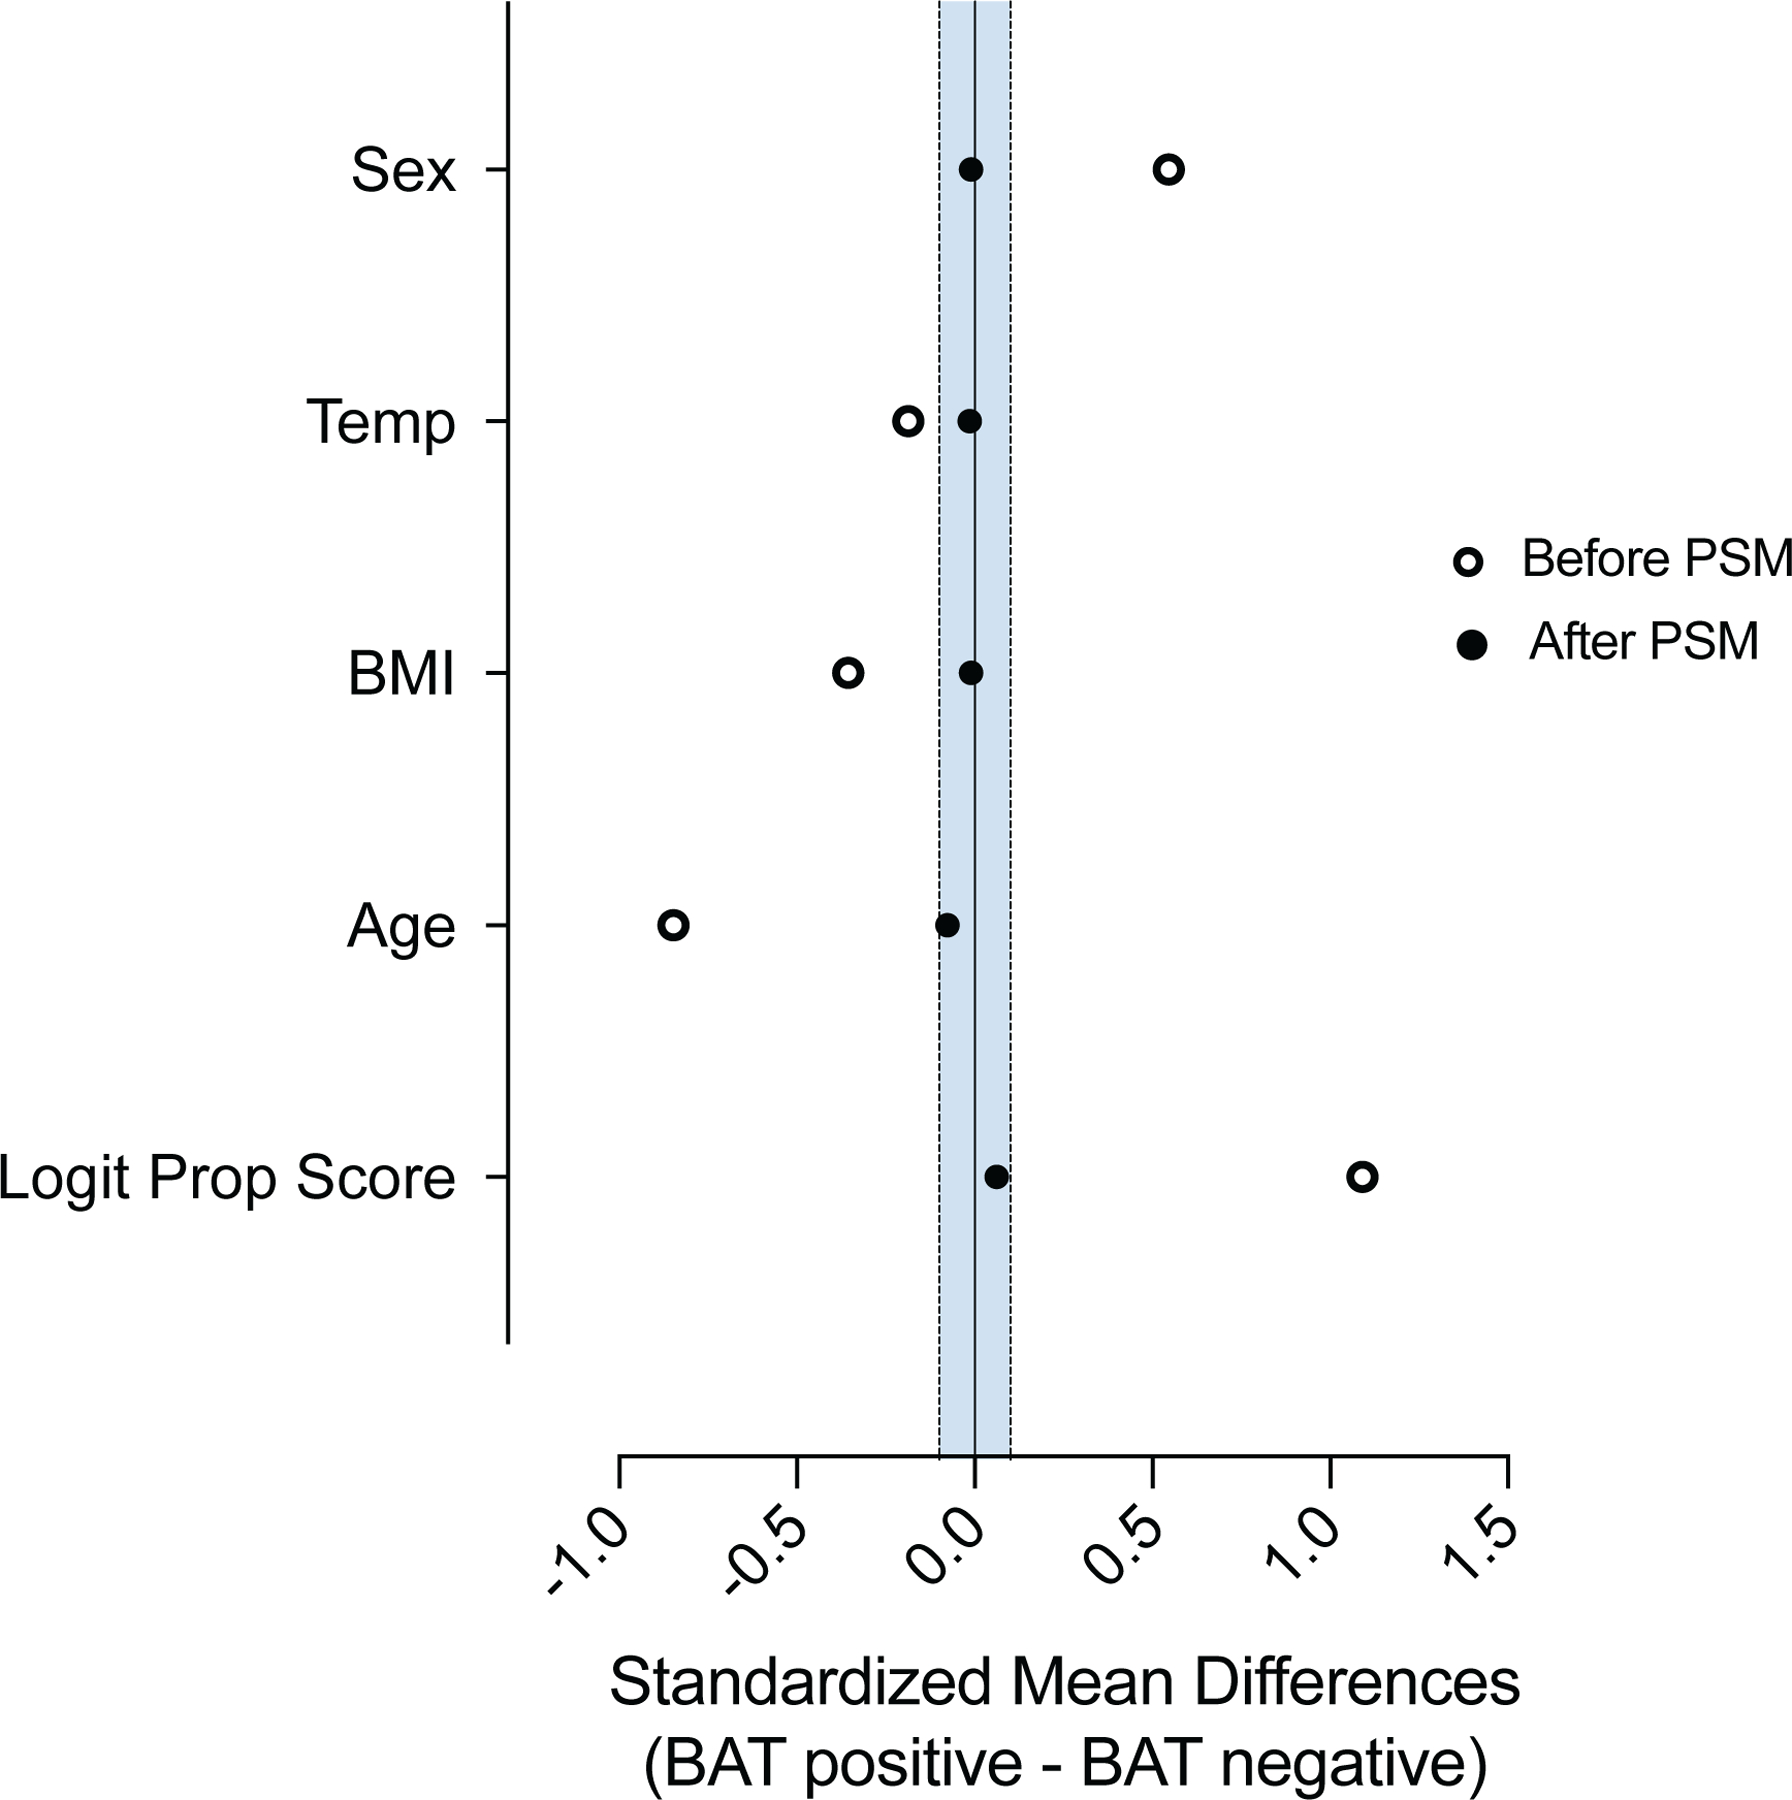
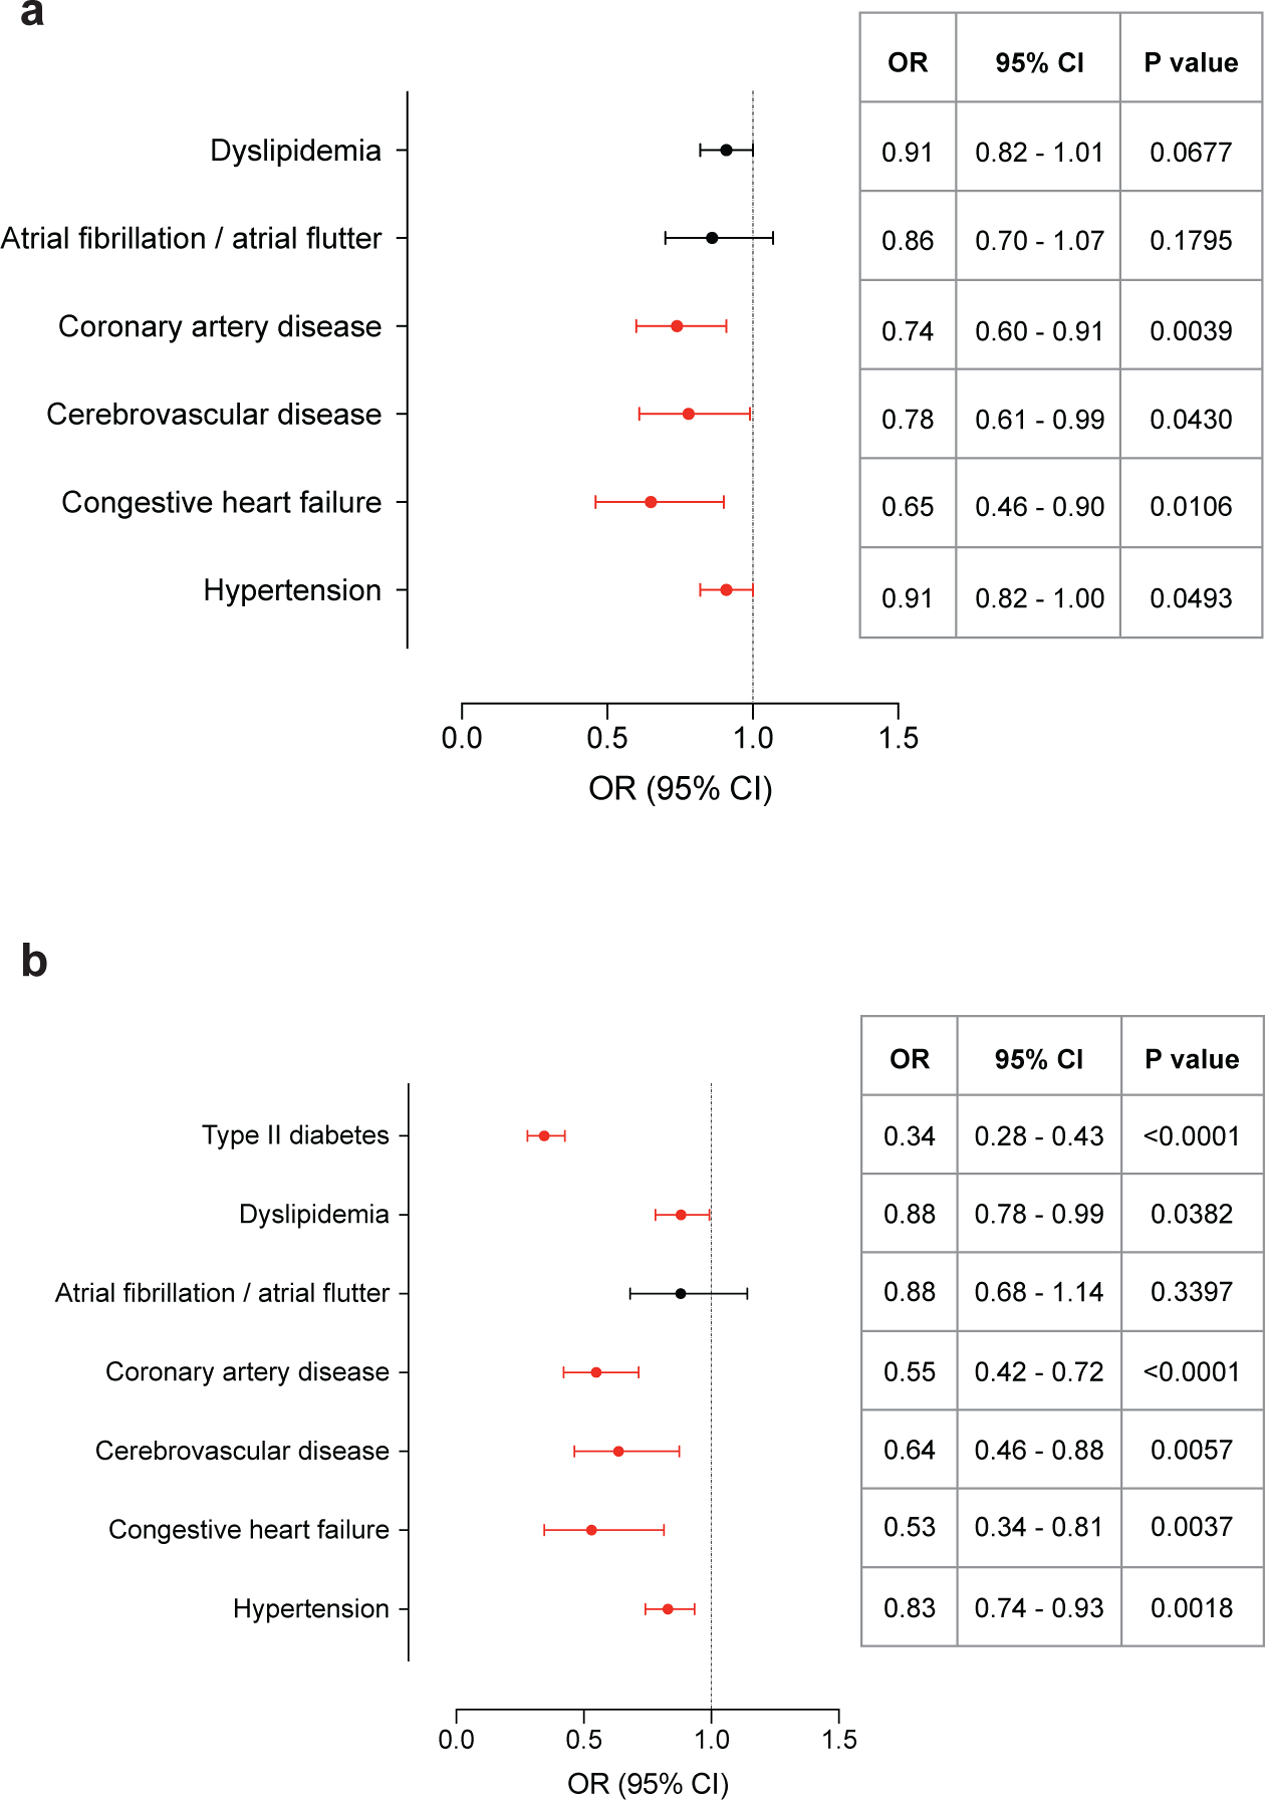
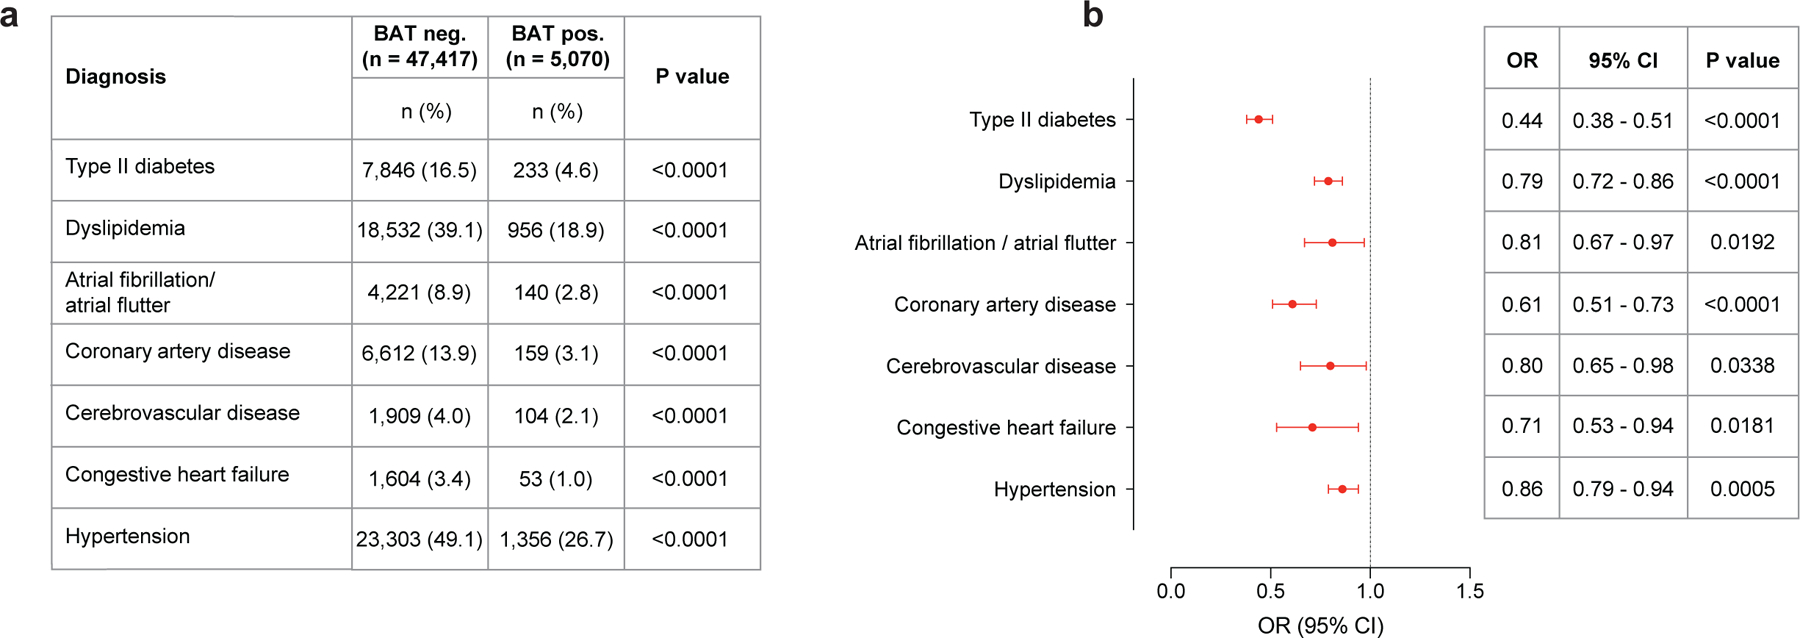
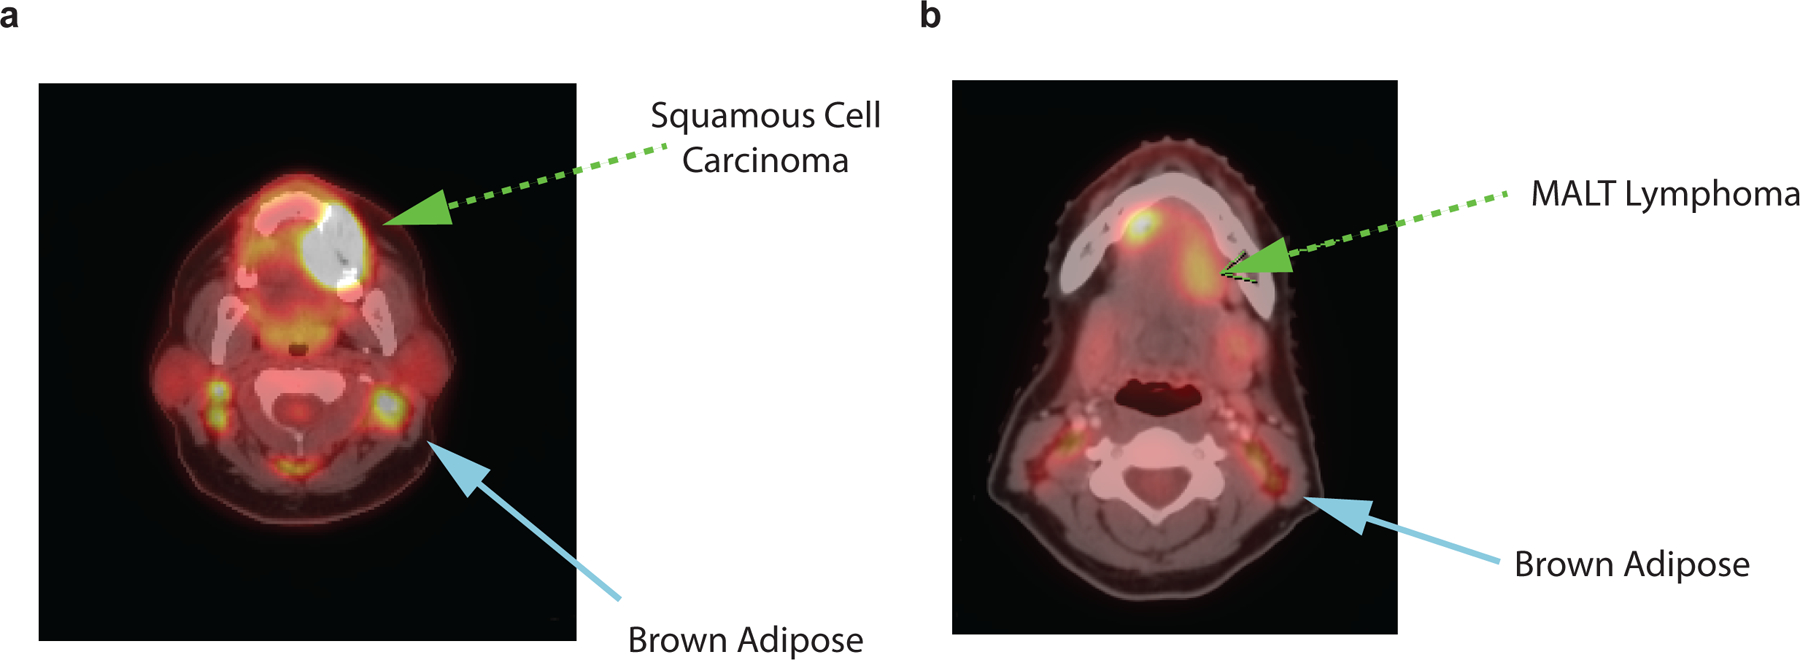
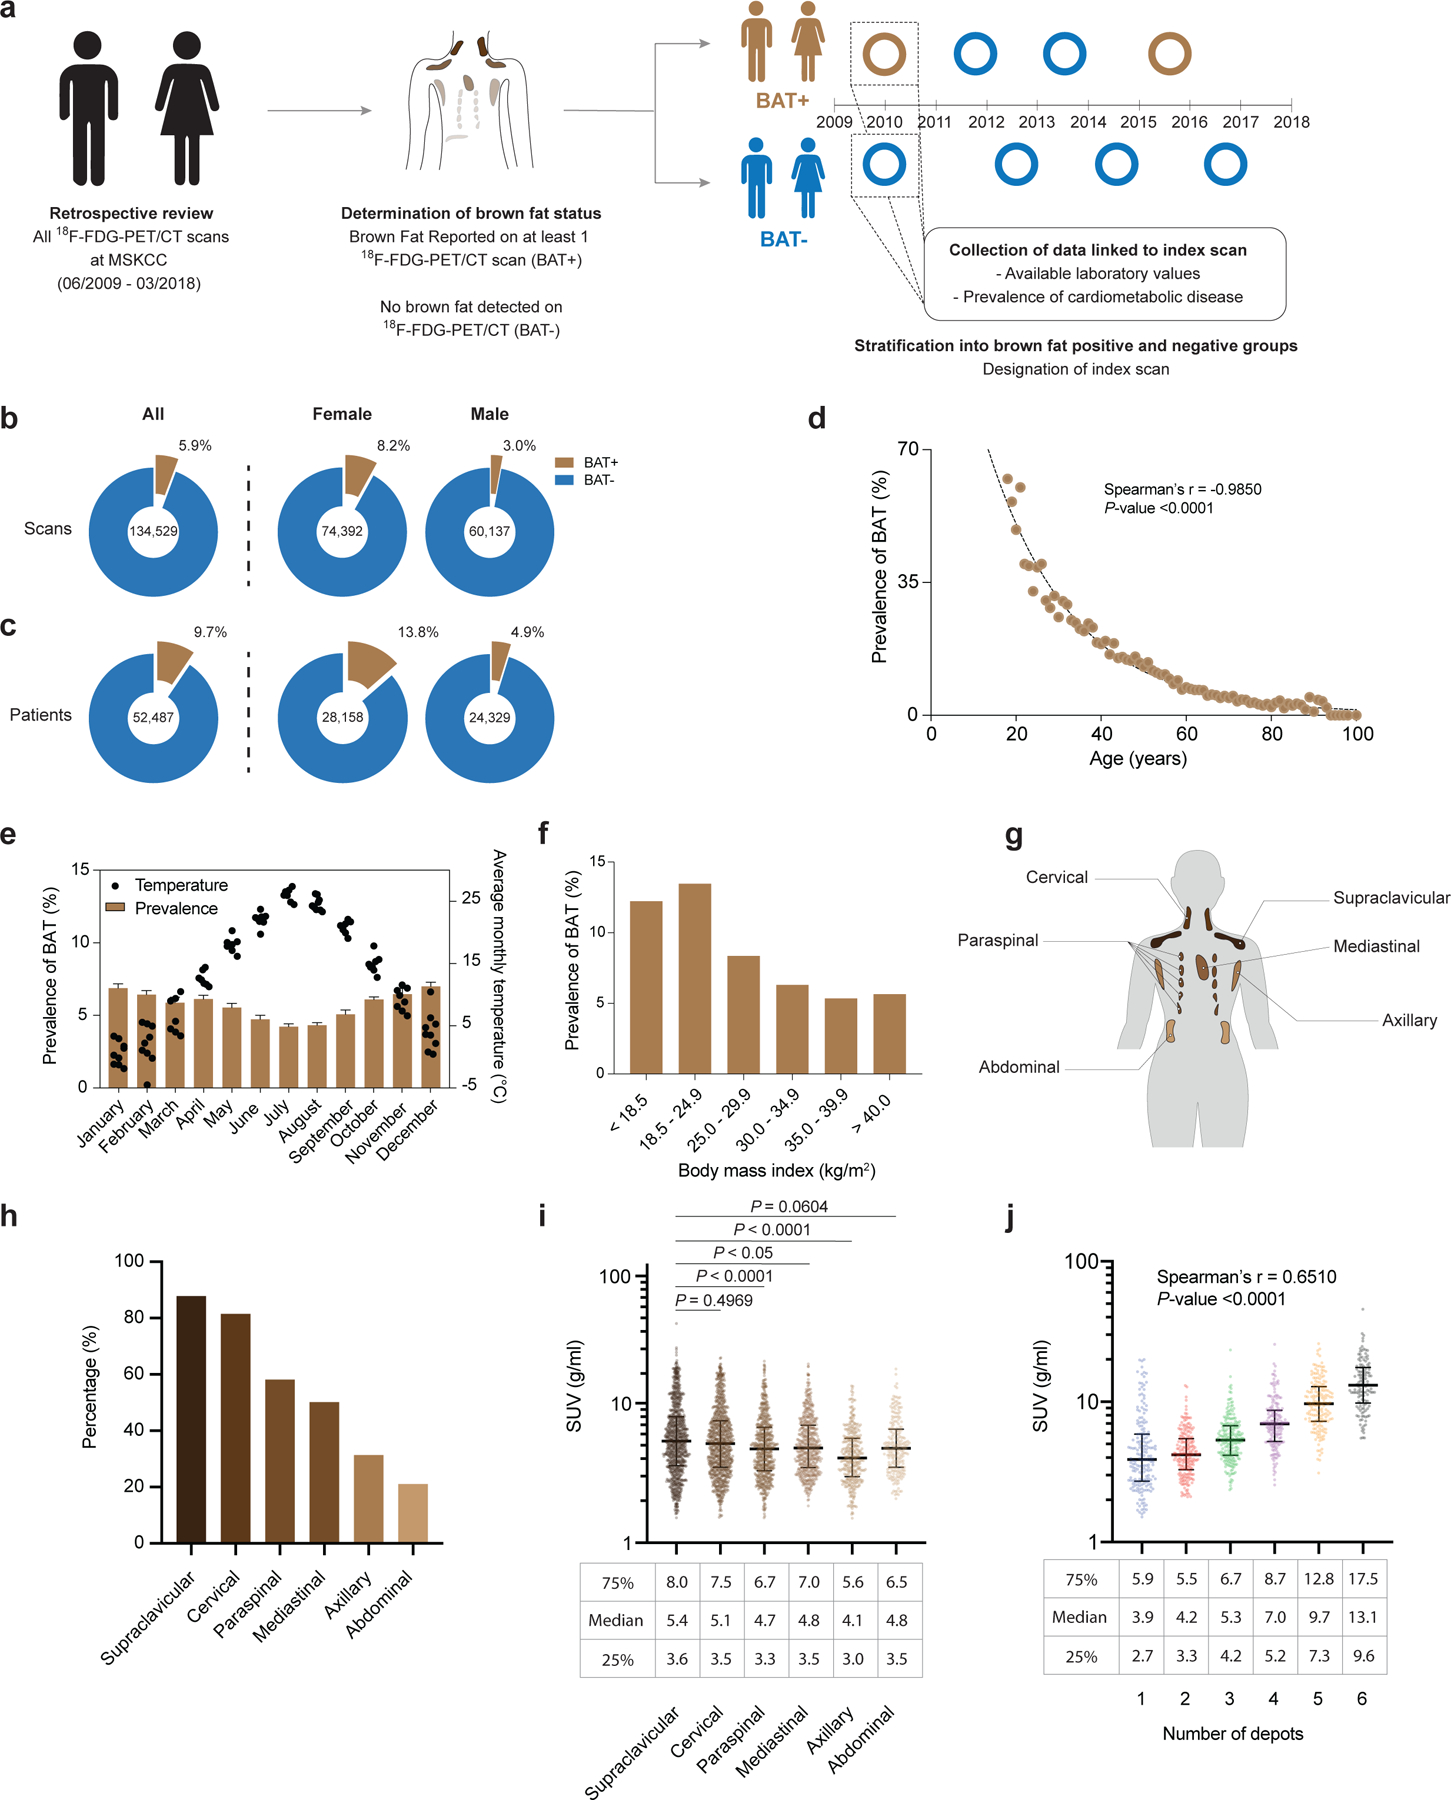
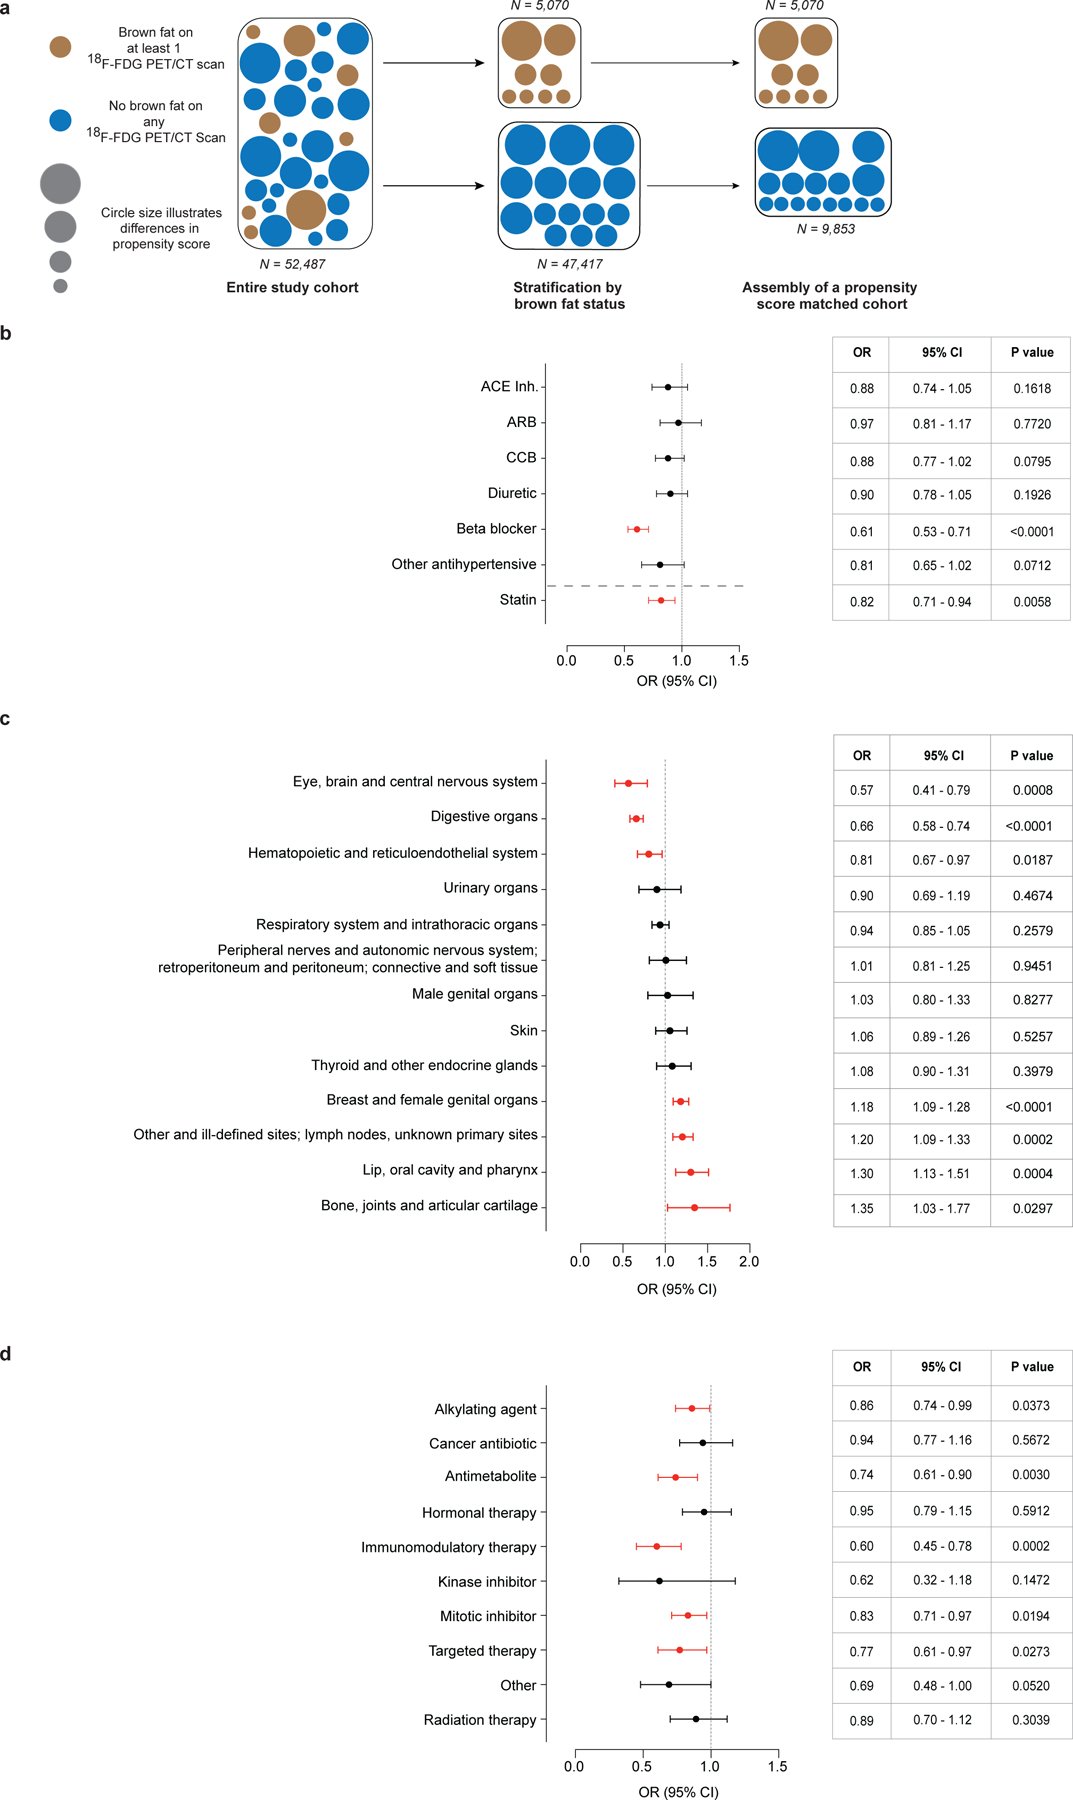
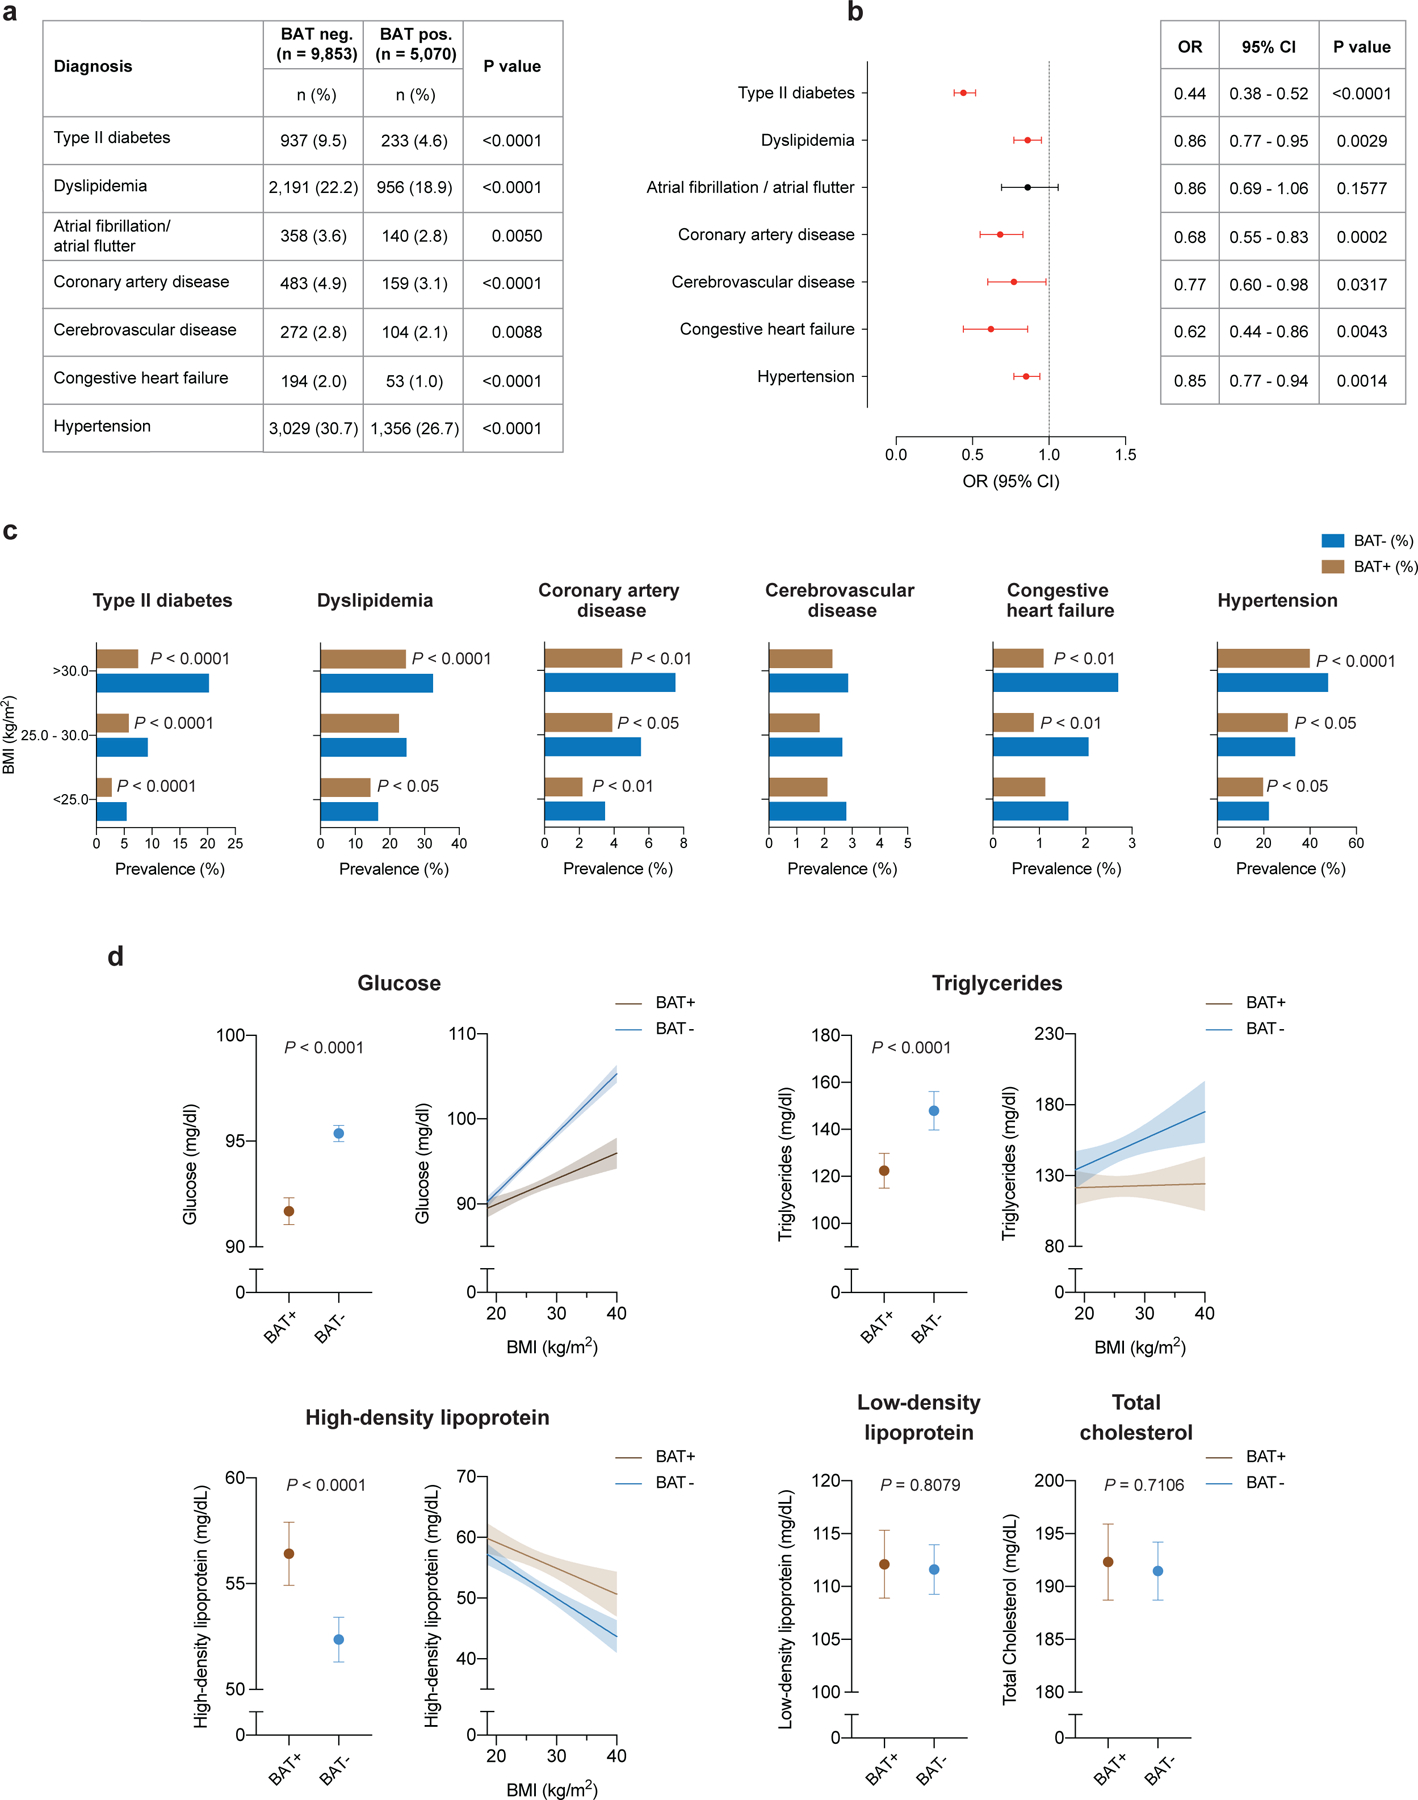
White fat stores excess energy, whereas brown and beige fat are thermogenic and dissipate energy as heat. Thermogenic adipose tissues markedly improve glucose and lipid homeostasis in mouse models, although the extent to which brown adipose tissue (BAT) influences metabolic and cardiovascular disease in humans is unclear1,2. Here we retrospectively categorized 134,529 18F-fluorodeoxyglucose positron emission tomography-computed tomography scans from 52,487 patients, by presence or absence of BAT, and used propensity score matching to assemble a study cohort. Scans in the study population were initially conducted for indications related to cancer diagnosis, treatment or surveillance, without previous stimulation. We report that individuals with BAT had lower prevalences of cardiometabolic diseases, and the presence of BAT was independently correlated with lower odds of type 2 diabetes, dyslipidemia, coronary artery disease, cerebrovascular disease, congestive heart failure and hypertension. These findings were supported by improved blood glucose, triglyceride and high-density lipoprotein values. The beneficial effects of BAT were more pronounced in individuals with overweight or obesity, indicating that BAT might play a role in mitigating the deleterious effects of obesity. Taken together, our findings highlight a potential role for BAT in promoting cardiometabolic health.


Conflict of interest statement

Competing Interest Statement

The authors declare no competing interests.

Figures

Extended Data Fig. 1:
Extended Data Fig. 1:. Number of 18F-FDG PET/CT scans and brown fat prevalence between 06/2009 – 03/2018.
a, The total number of 18F-FDG PET/CT scans performed at MSKCC between 2009 and 2018 and prevalence of reported brown fat. Dots depict total number of 18F-FDG PET/CT scan in each year, half filled dots illustrate years in which only part of the year was analyzed. Bars represent prevalence of 18F-FDG PET/CT scans with reported brown fat.
Extended Data Fig. 2:
Extended Data Fig. 2:. Correlation between brown fat prevalence and body mass index and outside temperature.
a, Correlation between body mass index and prevalence of brown fat reported on 18F-FDG PET/CT. b, Correlation between outside temperature in the month of the scan and prevalence of brown fat reported on 18F-FDG PET/CT.
Extended Data Fig. 3:
Extended Data Fig. 3:. Index scan position and cancer treatment.
a, Percentage of patients with BAT (BAT+) and without BAT (BAT−) receiving cancer therapy within 90 days of the index scan. Number in parenthesis indicates position of index scan. b, Percentage of patients with BAT (BAT+) and without 18F-FDG uptake on PET in regions corresponding to fat on CT (BAT−) and the position of the index scan depicted in parenthesis.
Extended Data Fig. 4
Extended Data Fig. 4. Standardized mean differences before and after propensity score matching.
Propensity score matching was assessed by comparing standardized mean differences before and after the matching process. The blue shaded area indicates standardized mean differences between 0.1 and −0.1.
Extended Data Fig. 5:
Extended Data Fig. 5:. Assocation of brown fat and cardiometabolic disease and additional adjustment for type II diabetes or index scan position.
a, Forest plots illustrate the association between brown fat status and cardiometabolic disease in the propensity score matched cohort, with additional adjustment for T2DM. Circles and bars represent odds ratios (ORs) and 95% confidence intervals (CIs) respectively. b, Forest plots illustrate the association between brown fat status and cardiometabolic disease in the propensity score matched cohort, with additional adjustment for index scan position. Circles and bars represent odds ratios (ORs) and 95% confidence intervals (CIs), respectively.
Extended Data Fig. 6:
Extended Data Fig. 6:. Association of brown fat and cardiometabolic disease in the entire cohort.
a, Association between brown fat and cardiometabolic disease in the entire study cohort. b, Forest plots illustrate the association between brown fat status and cardiometabolic disease in the entire study cohort. Circles and bars represent odds ratios (ORs) and 95% confidence intervals (CIs), respectively.
Extended Data Fig. 7:
Extended Data Fig. 7:. Examples of 18F-FDG uptake on PET in regions corresponding to adipose tissue on CT in patients with cancers of the head and neck.
a, 52-year old, female patient with keratinizing squamous cell carcinoma of the gums (green arrow). 18F-FDG PET/CT indicated for cancer staging. Symmetrical, bilateral 18F-FDG uptake on PET in cervical regions corresponding to adipose tissue on CT (blue arrow). b, 34-year old, female patient with marginal zone B-cell lymphoma of the mouth floor, initial staging scan (green arrow). 18F-FDG PET/CT indicated for cancer staging. Symmetrical, bilateral 18F-FDG uptake on PET in cervical regions corresponding to adipose tissue on CT (blue arrow).
Fig. 1:
Fig. 1:. Study design, association of brown fat with patient demographics and characterization of brown fat activity across adipose depots.
a,18F-FDG PET/CT reports were stratified by presence or absence of brown fat. b, Prevalence of brown fat per 18F-FDG PET/CT scan (n=134,529), further stratified according to 18F-FDG PET/CT scans in female (n=74,392) and male (n=60,137) individuals. c, Prevalence of brown fat in all patients (n=52,487), stratified by female (n=28,158) and male (n=24,329) sex. d, Correlation between brown fat prevalence and age. e, Brown fat prevalence, based on 18F-FDG PET/CT scans, and correlation with outdoor temperature in the month of the scan between 1 June 2009 and 31 March 2018. Bars depict means; error bars are standard deviations. f, Brown fat prevalence and BMI. g, Schematic of brown fat depot location in humans. h, Prevalence of brown fat in defined anatomic locations, derived from all 18F-FDG PET/CT scans with brown fat in 2016 (n=1,091 scans). i, Comparison of BAT activity measured in SUV across the different depots (n=1,091). Compared with supraclavicular depots, BAT activity was significantly lower in paraspinal (P<0.0001), mediastinal (P=0.0185) and axillary (P<0.0001) depots. Activities were compared by Kruskal-Wallis test with Dunn’s post hoc test; all tests were two-sided. Line depicts median; error bars are 25th and 75th percentile. j, Correlation between highest measured brown fat activity per patient and cumulative number of adipose depots with detectable brown fat activity (n=1,091 scans). Line depicts median; error bars are 25th and 75th percentile.
Fig. 2:
Fig. 2:. Propensity score matching and association of brown fat with medication, cancer site and cancer treatment.
a, PSM was used to identify a matched cohort based on age, sex, BMI and outdoor temperature in the month of the index scan. b, Forest plots illustrate the association between brown fat status and use of antihypertensive drugs and statins in the propensity score-matched cohort. Circles and bars represent ORs and 95% CIs, respectively. c, Forest plots illustrate the association between brown fat status and site of neoplasm (based on ICD-O codes) in the propensity score-matched cohort. Circles and bars represent ORs and 95% CIs, respectively. d, Forest plots illustrate the association between brown fat status and cancer treatment in the propensity score-matched cohort. Circles and bars represent ORs and 95% CIs, respectively. ACE, angiotensin-converting enzyme; ARB, angiotensin II receptor blocker; CCB, calcium channel blocker.
Fig. 3:
Fig. 3:. Association of brown fat with cardiometabolic disease and laboratory values.
a, Comparison of cardiometabolic disease prevalence between individuals with and without BAT. b, Forest plots illustrate the association between brown fat status and cardiometabolic disease in the propensity score-matched cohort. Circles and bars represent ORs and 95% CIs, respectively. c, Prevalence of cardiometabolic disease stratified by brown status and BMI using the World Health Organization categories for normal and underweight (BMI < 25.0 kg m−2), overweight (BMI between 25.0 and 30.0 kg m−2) and obesity (BMI > 30.0 kg m−2). Patients per category: BMI < 25.0 kg m−2, with brown fat n = 2,564, without brown fat n = 4,912; BMI between 25.0 and 30.0 kg m−2, with brown fat n = 1,589, without brown fat n = 3,016; BMI > 30.0 kg m−2, with brown fat n = 917, without brown fat n = 1,925. d, Comparison of available laboratory values between matched individuals with and brown fat (glucose; with brown fat n = 5,033 (99.3%), without brown fat n = 9,707 (98.5%); triglycerides, with brown fat n = 732 (14.4%), without brown fat n = 1,444 (14.7%); HDL, with brown fat n = 596 (11.8%), without brown fat n = 1,185 (12.0%); LDL, with brown fat n = 543 (10.7%), without brown fat n = 1,070 (10.9%); total cholesterol, with brown fat n = 637 (12.6%), without brown fat n = 1,267 (12.9%). Dots are means; error bars depict 95% CIs. Shaded bands indicate 95% CIs fitted by linear regression.

Comment in

References

    1. Bartelt A, et al.Brown adipose tissue activity controls triglyceride clearance. Nat. Med 17, 200–205 (2011). - PubMed
    1. Seale P, et al.Prdm16 determines the thermogenic program of subcutaneous white adipose tissue in mice. J. Clin. Investig 121, 96–105 (2011). - PMC - PubMed
    1. Cohade C, Osman M, Pannu HK & Wahl RL Uptake in supraclavicular area fat (“USA-Fat”): Description on 18F-FDG PET/CT. J. Nucl. Med 44, 170–176 (2003). - PubMed
    1. van Marken Lichtenbelt WD, et al.Cold-activated brown adipose tissue in healthy men. N. Engl. J. Med 360, 1500–1508 (2009). - PubMed
    1. Virtanen KA, et al.Functional brown adipose tissue in healthy adults. N. Engl. J. Med 360, 1518–1525 (2009). - PubMed

References (method section)

    1. von Elm E, et al.The Strengthening the Reporting of Observational Studies in Epidemiology (STROBE) Statement: Guidelines for reporting observational studies. Lancet 370, 1453–1457 (2007). - PubMed
    1. Leitner BP, et al.Mapping of human brown adipose tissue in lean and obese young men. Proc. Natl. Acad. Sci. U. S. A 114, 8649–8654 (2017). - PMC - PubMed

Publication types

MeSH terms