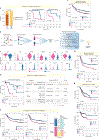
. 2021 Jan;27(1):141-151.
doi: 10.1038/s41591-020-1125-8. Epub 2021 Jan 4.

Single-cell dissection of intratumoral heterogeneity and lineage diversity in metastatic gastric adenocarcinoma

Affiliations

Single-cell dissection of intratumoral heterogeneity and lineage diversity in metastatic gastric adenocarcinoma

Ruiping Wang et al. Nat Med. 2021 Jan.

Abstract

Intratumoral heterogeneity (ITH) is a fundamental property of cancer; however, the origins of ITH remain poorly understood. We performed single-cell transcriptome profiling of peritoneal carcinomatosis (PC) from 15 patients with gastric adenocarcinoma (GAC), constructed a map of 45,048 PC cells, profiled the transcriptome states of tumor cell populations, incisively explored ITH of malignant PC cells and identified significant correlates with patient survival. The links between tumor cell lineage/state compositions and ITH were illustrated at transcriptomic, genotypic, molecular and phenotypic levels. We uncovered the diversity in tumor cell lineage/state compositions in PC specimens and defined it as a key contributor to ITH. Single-cell analysis of ITH classified PC specimens into two subtypes that were prognostically independent of clinical variables, and a 12-gene prognostic signature was derived and validated in multiple large-scale GAC cohorts. The prognostic signature appears fundamental to GAC carcinogenesis and progression and could be practical for patient stratification.


Conflict of interest statement

Competing interests

The authors declare no competing interests.

Figures
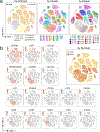
Extended Data Fig. 1 |
Extended Data Fig. 1 |. A single cell transcriptome map of PC.
a, t-SNE (t-distributed stochastic neighbor embedding) plots showing unbiased clustering analysis of 45,048 single cells that passed quality control in this study. Each dot represents a single cell. Cells are color coded for (left to right): the associated cell types, cell clusters, the corresponding patient origins, and survival status. b, t-SNE as in a, showing expression of canonical marker genes used for cell types assignment.
Extended Data Fig. 2 |
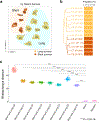
Extended Data Fig. 2 |. Relationships between tumor cell clusters and correlation with patient survival.
a, the UMAP (uniform manifold approximation and projection) plot of PC tumor cells, showing the global data structure. Tumor cell clusters from short-term survivors appeared closer to each other on the UMAP plot than to cell clusters from long-term survivors. b, the dendrogram showing relationships between tumor cell clusters. c, the Bhattacharyya pairwise distance between tumor cell clusters from samples of long and short-term survivors. Overall, the pairwise distance between clusters of long and short survivors was significantly larger than that within the clusters of Short or Random, indicating distinct transcriptomic profiles associated with survival. Each dot represents one sampling, in totally 100 times. Box, median ± interquartile range. Whiskers, the minimum and maximum values. P values were calculated by a two-sided Wilcoxon rank sum test with Benjamini-Hochberg correction. P < 2.2e-16 represents a P value approaching 0.
Extended Data Fig. 3 |
Extended Data Fig. 3 |. Cell lineage assignment was not confounded by differences in cell cycle states.
The histograms showing tumor cell lineage compositions before (top) and after (bottom) regressing out cell cycle-related genes, respectively.
Extended Data Fig. 4 |
Extended Data Fig. 4 |. Unsupervised clustering analysis revealed inter-patient and intra-tumoral transcriptome heterogeneity in PC tumor cells.
The UMAP plots showing unsupervised clustering analysis of tumor cells (using Seurat) from 14 samples underwent HCL mapping and cell lineage inference as in Fig. 1g. Cells are colored by their corresponding cluster IDs (left) and sample origins (right). Dashed circles highlight samples that formed two or more tumor cell clusters (related to Fig. 1g).
Extended Data Fig. 5 |
Extended Data Fig. 5 |. SC3 unsupervised clustering analysis of PC tumor cells by patient.
SC3 results of 3 representative patients are shown. Each column represents a cell. The lineage annotation is shown in the top annotation track. The fractions of intestinal cells (IP-067, IP-073) or stomach pit cells (IP-009) in each SC3 defined cell clusters are labelled at the top. Some of the representative marker genes of intestine and stomach origins are labelled on the right. Two-sided proportion tests were performed between C1 and C4 (IP-067), C1 and C3 (IP-073), and C1 and C2 (IP-009), and all are significant (P < 2.2e–16).
Extended Data Fig. 6 |
Extended Data Fig. 6 |. The Bhattacharyya distance between and within inferred cell lineages.
The Bhattacharyya pairwise distance between different tumor cell lineages was computed as previously described (see Methods). Only the major lineages that had 500 or more cells were included in the analysis. The Bhattacharyya distance between cells of the same lineage and the Bhattacharyya distance between cells randomly sampled independent of lineage annotation (Random) was also computed to provide background distributions for statistical comparison. Each dot represents one sampling, in total 100 times. Box, median ± interquartile range. Whiskers, the minimum and maximum values. P values were calculated by a two-sided Wilcoxon rank-sum test with Benjamini-Hochberg correction. P < 2.2e–16 represents a P value approaching 0.
Extended Data Fig. 7 |
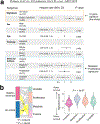
Extended Data Fig. 7 |. Representative examples of somatic variants identified on 3’UTR using scRNA-seq data.
Integrative Genomics Viewer (IGV) was used for visualization of the QC-passed somatic variants. The Bam files of Monocle defined cell clusters C1, C2, C3 of sample IP-067 were loaded to IGV and snapshots of 3’UTR mutations are shown for representative events: somatic mutations shared by PC tumor cells from all three clusters (top); mutations shared by only two of the three clusters (bottom left and middle), and mutations that were unique to one of the three clusters (bottom right) are shown. For each representative mutation across Monocle cell clusters, the gene name, chromosome, start position, base change, total read coverage, and tumor variant allele fraction (TAF) are shown. Total_dp: total read depth.
Extended Data Fig. 8 |
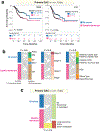
Extended Data Fig. 8 |. Prognostic significance of 12-gene signature in TCGA primary gastric cancer cohort and correlation with molecular subtypes and clinical variables.
a, Disease-specific survival (DSS, left) and progression-free interval (PFI, right) of patients whose PCs were in the GI-mixed and gastric-dominant groups defined by expression of the 12-gene signature. The analyses were performed with the Kaplan–Meier estimates and two-sided log-rank tests. Twenty-five out of 411 patients whose DSS information were not available were excluded from survival analysis. b, the alluvial plots display relationships between the PC subtypes defined by the 12-gene signature (left strip) and the molecular subtypes defined by TCGA multi-omic analysis (left), tumor stages (middle), histology types (right), and presence of local recurrence and/or distant metastasis (c). N.S., not statistically significant. P value for alluvial plots were calculated by a two-sided Fisher’s Exact test.
Extended Data Fig. 9 |
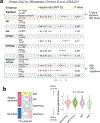
Extended Data Fig. 9 |. Validation of the 12-gene signature in a large-scale localized GAC cohort from Cristescu R, et al.
a, The multivariate Cox proportional hazard model analysis. The 12-gene signature, clinical and histopathological variables as well as the molecular signatures defined by the original study were included. For each variable, the reference level is the first one. Block in center of error bars represent the weighted mean. Whiskers of error bars represent the 95% confidence interval. b, (left) Alluvial plot shows the relationships between the PC subtypes (left strip) and the molecular signatures (right strip). The two-sided Fisher’s Exact test was used to calculate the P values and asterisks indicate significant enrichment events. (right) The 12-gene signature scores were calculated and compared across the four molecular groups defined by the original the study. Box, median ± interquartile range. Whiskers, 1.5X interquartile range. P value was calculated by one-way Kruskal-Wallis rank-sum test.
Extended Data Fig. 10 |
Extended Data Fig. 10 |. Validation of the 12-gene signature in a large-scale localized GAC cohort from Ooi CH, et al.
a, The multivariate Cox proportional hazard model analysis. The 12-gene signature, clinical and histopathological variables as well as the molecular signatures defined by the original study were included. For each variable, the reference level is the first one. Block in center of error bars represent the weighted mean. Whiskers of error bars represent the 95% confidence interval. b, (left) Alluvial plot shows the relationships between the PC subtypes (left strip) and the molecular signatures (right strip). The two-sided Fisher’s Exact test was used to calculate the P values and asterisks indicate significant enrichment events. (right) The 12-gene signature scores were calculated and compared across the four molecular groups defined by the original the study. Box, median ± interquartile range. Whiskers, 1.5X interquartile range. P value was calculated by one-way Kruskal-Wallis rank-sum test.
Fig. 1 |
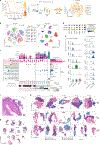
Fig. 1 |. A single-cell transcriptome map of PC and the inferred tumor cell lineages.
This study included ten short-term survivors and ten long-term survivors. a, Left, the Kaplan–Meier curve demonstrates a dramatic difference (P = 3 × 10−06 by log-rank test) in the survival time since PC diagnosis between the two groups of patients with GAC; middle, a schema of sample collection for scRNA-seq; right, t-SNE plot showing unbiased clustering analysis of 45,048 single cells that passed quality control in this study. Each dot of the t-SNE plot represents a single cell. Cells are color coded for their associated cell types. b, The t-SNE and UMAP plots of the 31,131 PC tumor cells (14 cell clusters) that were selected for subsequent analyses. Cells are color coded by their corresponding patient origins. c, The tumor cell lineage compositions inferred by mapping scRNA-seq data to the HCL database. The middle panel shows the HCL-defined cell lineages/types (rows) by patient (columns). The size of the circle represents, for each specific cell lineage/type, the fraction of tumor cells (among the total quality-control-passed tumor cells) in each individual PC. The circles are color coded by defined cell lineages/types, the same as in the annotation track on the left. The histogram on the top shows, for each individual sample, the number of tumor cells accumulated on listed cell lineages/types (plus other unclassified or rare cell types). The histogram on the right shows, for each specific tumor cell lineage/type, the fraction of tumor cells (among the total quality-control-passed tumor cells) in this cohort. The bottom annotation tracks show (from top to bottom): the corresponding patient IDs, the survival groups to which the patients belong, the presence of intestinal metaplasia in their corresponding primary tumors, fractions of intestinal cells among the total quality-control-passed tumor cells in each individual PC and the PC subtypes. Classification of the PC subtypes was based on tumor cell lineage compositions (gastric-dominant if fraction of intestinal cells <20% and GI-mixed if fraction of intestinal cells ≥20%). d, Bubble plot showing expression of lineage-specific marker genes across different cell lineages/types. e, Violin plots of representative lineage-specific marker genes. f, A representative histology image for IP-010 demonstrating well-formed goblet cells in gastric mucosa (indicated by blue arrow heads). g, UMAP plot showing unsupervised clustering of 26,401 PC tumor cells from 14 samples that underwent HCL mapping and cell lineage inference as in c. Cells are colored by their inferred cell lineages/types. Dashed circles highlight samples that formed two or more tumor cell clusters (as labeled in the left panel of Extended Data Fig. 4). h, t-SNE and UMAP plots of PC tumor cells generated from patient-level subclustering analysis, showing that gastric cells (pink, purple) were clustered distinctly from the colorectal-like cells (dark blue).
Fig. 2 |
Fig. 2 |. The diversity in tumor cell lineage compositions links to ITH at transcriptomic, genotypic and molecular levels.
a, A representative sample, IP–067. Left, phylogenetic reconstruction analysis of inferred CNVs. B1–5 labels of five tumor cell subpopulations with distinct CNV profiles. Middle, heatmap showing the inferred larger-scale CNVs by chromosome; the annotation track on the left of the heatmap indicates the inferred cell lineages, and the annotation track on the right indicates Monocle-defined cell clusters. Right, top, Monocle-defined cell clusters. For each Monocle-defined cell cluster, its tumor-cell-lineage composition is shown in the small pie chart next to it; right, bottom, the Venn diagram showing shared and unique somatic variants across Monocle-defined cell clusters. Somatic variants were called from scRNA-seq data, and only variants located at the 3ʹ UTR were counted. b, Another representative sample, IP–009. B1–3 labels of three tumor cell subpopulations with distinct CNV profiles. The annotations for the remainder of b are in the same format as those of a. c, Comparison of tumor cell proliferative property across the inferred tumor cell lineages. Box, median ± interquartile range. Whiskers, the minimum and maximum values. P values were calculated by a two-sided Wilcoxon rank-sum test with Benjamini–Hochberg correction. d, Proportion of cycling (cells in G2M or S phase) and non-cycling cells across the inferred cell lineages. e, The violin plots for representative cell-cycle-related genes that are differentially expressed across tumor cell lineages/types (P < 2.2 × 10⁻¹⁶). P values were calculated by one-way Kruskal–Wallis rank-sum test. P < 2.2 × 10⁻¹⁶ represents a P value approaching 0. Number of cells for c and e: colon goblet cells, n = 2,658; colon enterocyte cells, n = 1,042; rectum epithelial cells, n = 1,578; duodenum epithelial cells, n = 366; stomach pit cells, n = 12,341; stomach mucosal cells, n = 5,937. FC, fold change.
Fig. 3 |
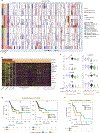
Fig. 3 |. 17q copy number gain is prevalent in cells of stomach origin and significantly associated with inferior survival.
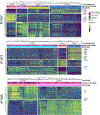
a, The landscape of inferred large-scale CNVs for all of the tumor cells. The annotation tracks on the left indicate (from left to right) the corresponding sample IDs (the same colors as in Fig. 1b), survival groups, PC subtypes and the inferred cell lineages/types. Chromosome numbers are labeled on the top. The yellow rectangle highlights the 17q copy number gain that was nearly exclusively found in cells from the short-term survivors. b, The heatmap displays scaled expression values of genes upregulated in three short-term survivors (sample IDs labeled at the bottom) with evident 17q gain (annotated on the top track) and one short-term survivor and seven long-term survivors without detectable 17q changes. Biologically important genes are listed on the right, color coded by their related signaling pathways. c, The representative violin plots of eight genes selected from b. d,e, 17q copy number gain was associated with worse patient survival in the TCGA primary GAC cohort (d) (n = 411; only cases with survival data available were included) and an independent GAC-PC cohort (e) (n = 45). P values were calculated by a two-sided log-rank test. Median survival times (in months) are labeled on the plots. MDACC, MD Anderson Cancer Center; OS, overall survival; PFI, progression-free interval.
Fig. 4 |
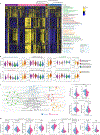
Fig. 4 |. Molecular pathway-based dissection of the transcriptomic iTH and correlation with tumor cell lineage and patient survival.
a, The transcriptomic ITH of curated gene sets, including cancer hallmark gene sets (n = 50) and gene sets from KEGG (n = 186) and reactome (n = 674) pathway databases. Each column represents a single cell. Only the pathways (rows) that were differentially expressed across different tumor cell lineages are shown. The pathway names are labeled on the right and color coded by their biological functions. b, representative violin plots of six pathways selected from a and Supplementary Fig. 20 that showed significant correlation with patient survival. Number of cells: stomach mucosal cells, n = 5,937; stomach pit cells, n = 12,341; pancreas ductal cells, n = 1,037; gallbladder mucosal cells, n = 285; duodenal epithelial cells, n = 366; colorectal epithelial cells, n = 5,278; long-term survivors, n = 18,428; short-term survivors, n = 6,816. Box, median ± interquartile range. Whiskers, 1.5 × interquartile range. P values across different tumor cell lineages were calculated by one-way Kruskal–Wallis rank-sum test. P values between two patient groups were calculated by a two-sided Wilcoxon rank-sum test. P < 2.2 × 10⁻¹⁶ represents a P value approaching 0. GSVA, gene set variation analysis. c, The interaction networks of differentially expressed pathways displayed in a. The curated gene sets were colored by their biological functions. The weight of a line corresponds to its Jaccard index (a similarity metric) between each pathway pair connected by the line. d, Violin plots showing the differences in immune cell composition between the gastric-dominant and GI-mixed groups across multiple validation cohorts. The MCP-counter scores for a specific tumor cell lineage or the CIBErSOrT cell fractions, or normalized gene expression levels, are shown on the y axis. The black, bold, horizontal line with a dot indicates the median value of each group. P values were calculated by a two-sided Wilcoxon rank-sum test. mDC, myeloid dendritic cells.
Fig. 5 |
Fig. 5 |. Identification and validation of the 12-gene prognostic signature.
a, Survival analysis of the discovery GAC-PC cohort. Left, histogram showing relative proportions of long- and short-term survivors between the gastric-dominant and GI-mixed groups. P value was calculated by the two-tailed Fisher’s exact test. Right, Kaplan–Meier plots showing the survival time (in months) since PC diagnosis and survival time since ascites collection, respectively, between patients in gastric-dominant and GI-mixed groups. P values were calculated by two-sided log-rank tests. b, A schema that illustrates the bioinformatics flow for generation of the 12-gene signature (see details in the Methods). c, Differential expression of the 12 signature genes between the gastric-dominant and GI-mixed groups. d, Survival analysis of a second independent cohort of GAC-PC patients (n = 45). Left, the Kaplan–Meier curves showing significant differences in patient survival from PC diagnosis between the two PC subtypes (the colors are the same as in panels ac). Right, multivariate Cox proportional regression outcomes, with the 12-gene signature included. For each variable, the reference level is the first one. The block in the center of the error bars represents the weighted mean. Whiskers of error bars represent the 95% confidence intervals. Patients whose PC belongs to the gastric-dominant subtype as defined by the 12-gene signature are significantly associated (P = 3.31 × 10⁻⁴) with worse survival in this multivariate model. CI, confidence interval. eh, Survival analysis of the 12-gene signature across three additional large-scale validation cohorts of localized GACs. For each cohort, the source of the dataset, the sample size, the log-rank P value and the median survival time (in months) are labeled on the Kaplan–Meier plot. e, The localized GAC cohort from Cristescu and colleagues. The alluvial plots (right) show the relationships between PC subtypes (left strip) and the presence of local recurrence and/or distant metastases (right strip). The yellow band highlights the significant enrichment of local recurrence and/or distant metastases events in patients whose PCs belong to the gastric-dominant subtype. The P values for the alluvial plots were calculated by a two-sided Fisher’s exact test. f, The GAC cohort from Cheong and colleagues. g, The GAC cohort from Ooi and colleagues. h, The GAC cohort from TCGA.

References

    1. Bray F et al. Global cancer statistics 2018: GLOBOCAN estimates of incidence and mortality worldwide for 36 cancers in 185 countries. CA Cancer J. Clin 68, 394–424 (2018). - PubMed
    1. Ikoma N et al. Preoperative chemoradiation therapy induces primary-tumor complete response more frequently than chemotherapy alone in gastric cancer: analyses of the National Cancer Database 2006–2014 using propensity score matching. Gastric Cancer 21, 1004–1013 (2018). - PMC - PubMed
    1. Mizrak Kaya D et al. Risk of peritoneal metastases in patients who had negative peritoneal staging and received therapy for localized gastric adenocarcinoma. J. Surg. Oncol 117, 678–684 (2018). - PMC - PubMed
    1. Shiozaki H et al. Prognosis of gastric adenocarcinoma patients with various burdens of peritoneal metastases. J. Surg. Oncol 113, 29–35 (2016). - PubMed
    1. Chen C et al. Efficacy and safety of immune checkpoint inhibitors in advanced gastric or gastroesophageal junction cancer: a systematic review and meta-analysis. Oncoimmunology 8, e1581547 (2019). - PMC - PubMed

Publication types

MeSH terms