. 2021 Jan;27(1):152-164.
doi: 10.1038/s41591-020-1131-x. Epub 2021 Jan 4.

Liver metastasis restrains immunotherapy efficacy via macrophage-mediated T cell elimination

Affiliations

Liver metastasis restrains immunotherapy efficacy via macrophage-mediated T cell elimination

Jiali Yu et al. Nat Med. 2021 Jan.

Abstract

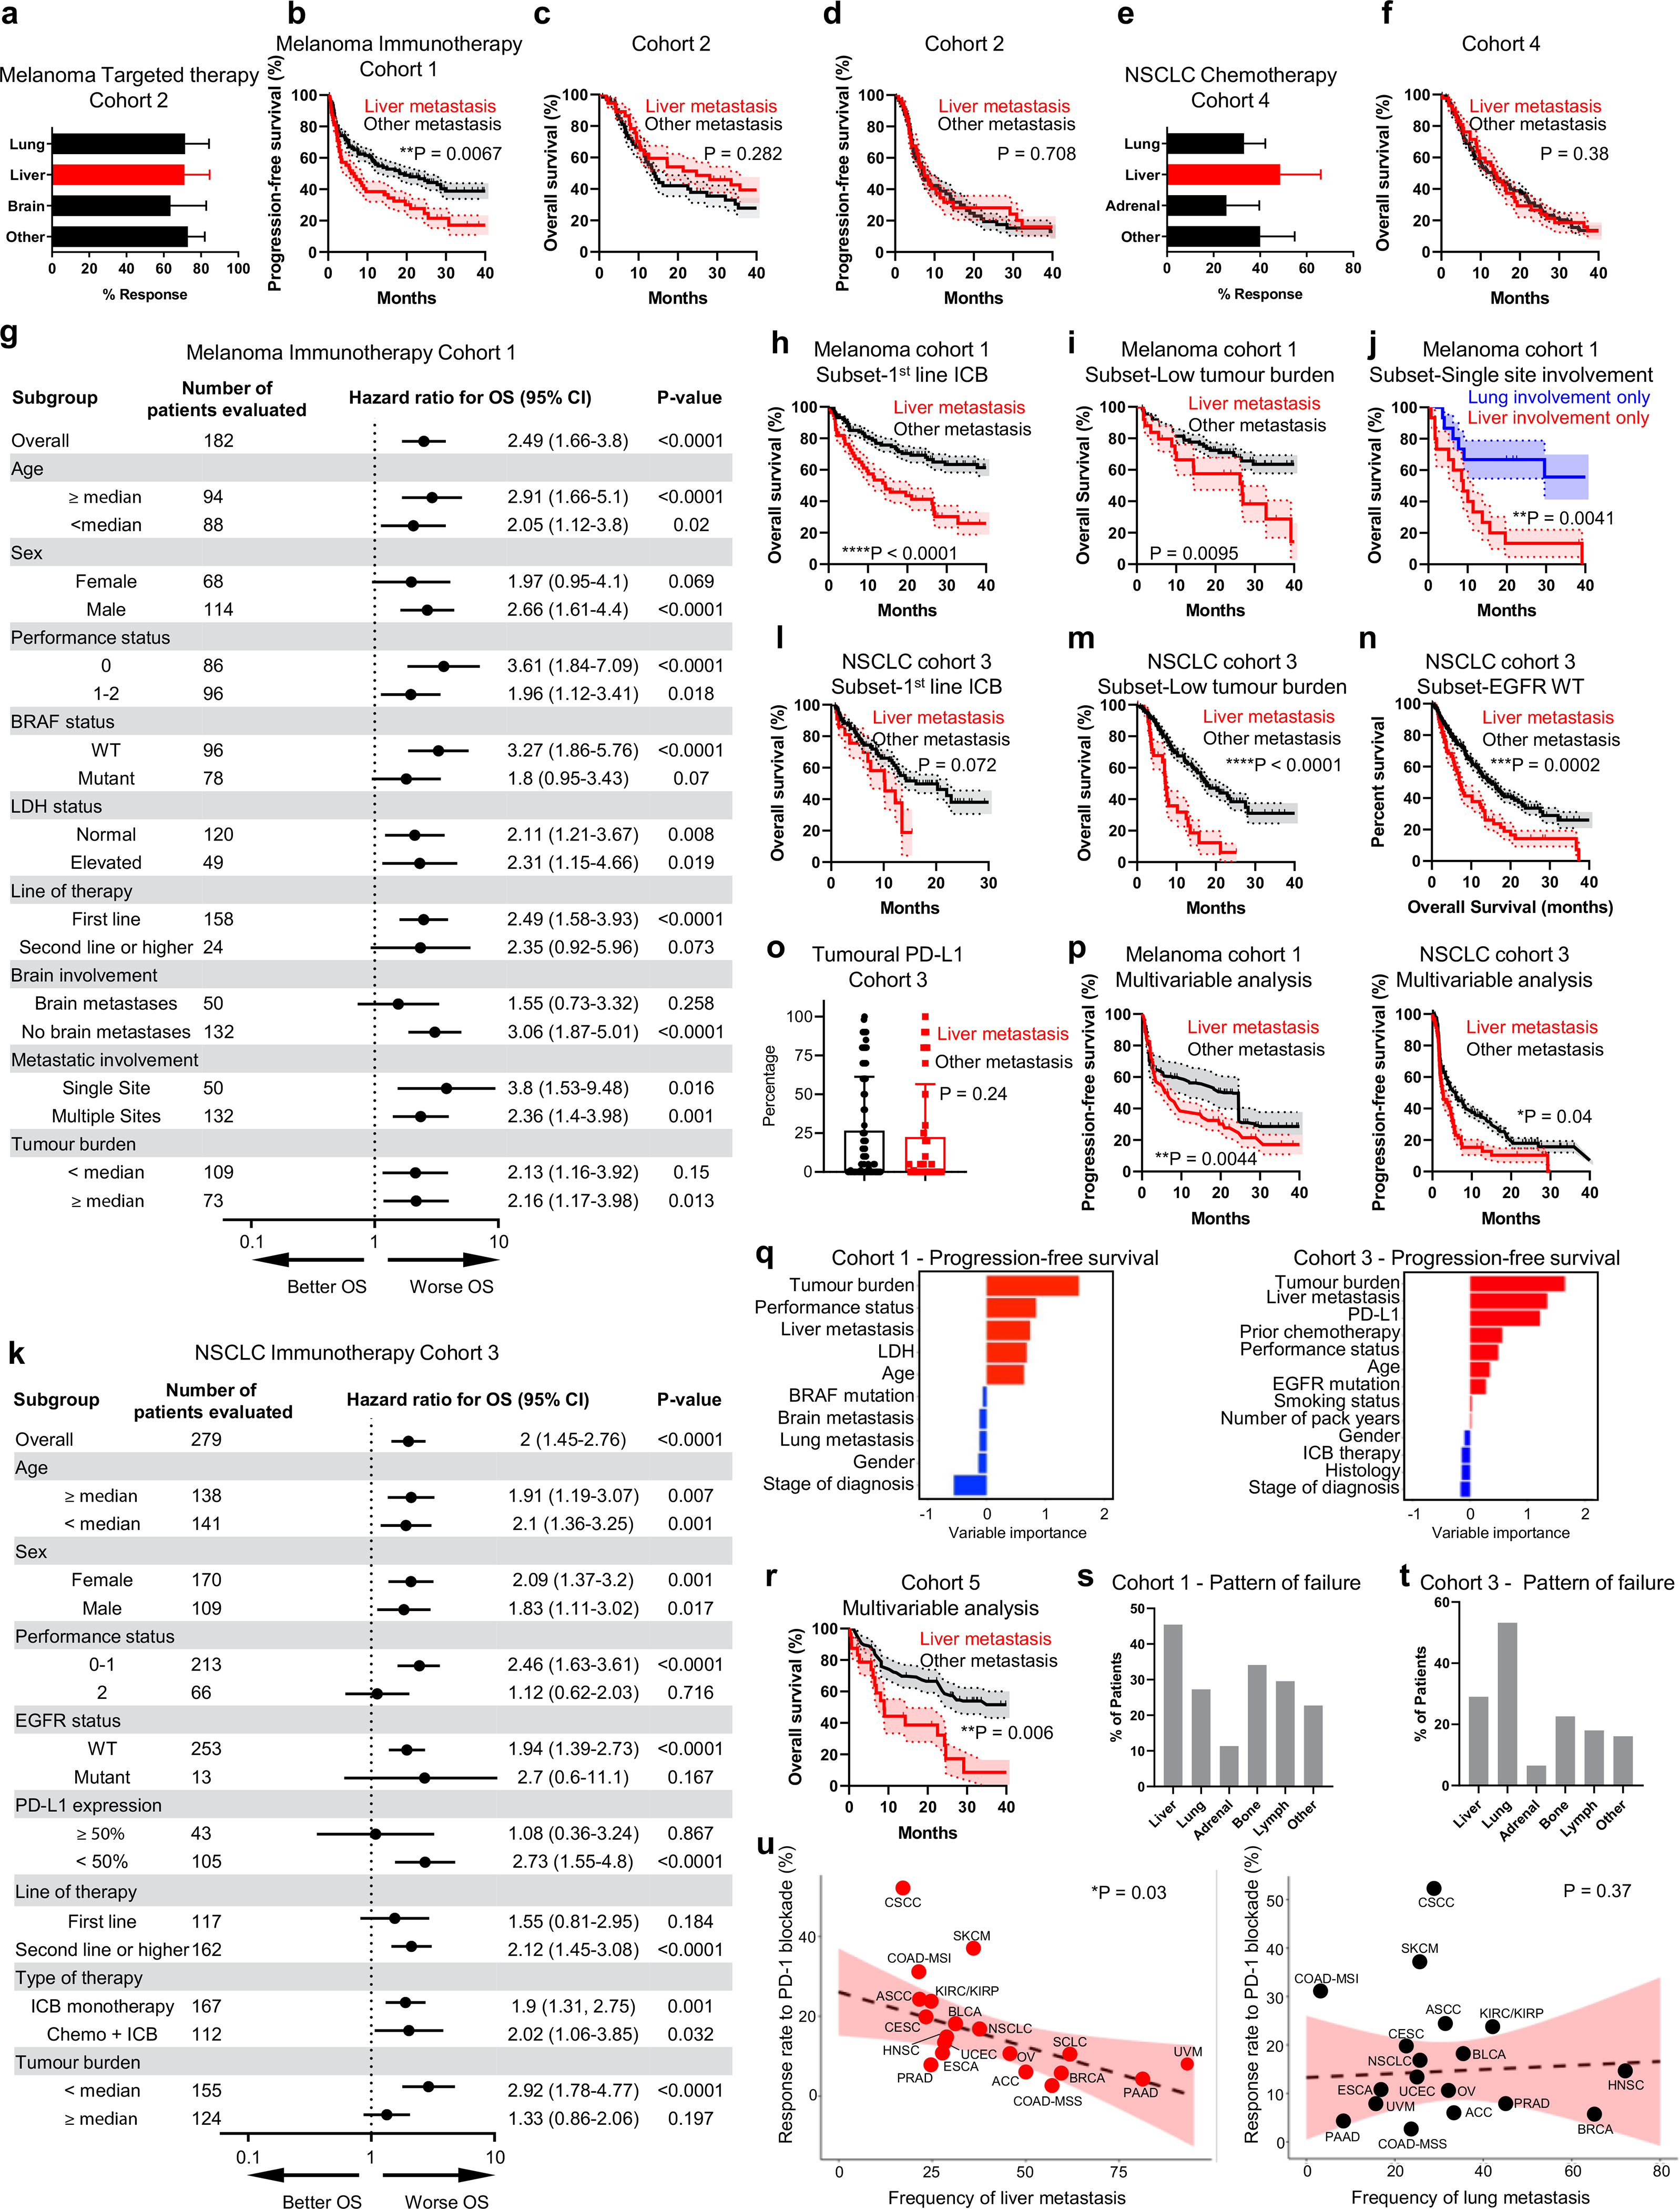
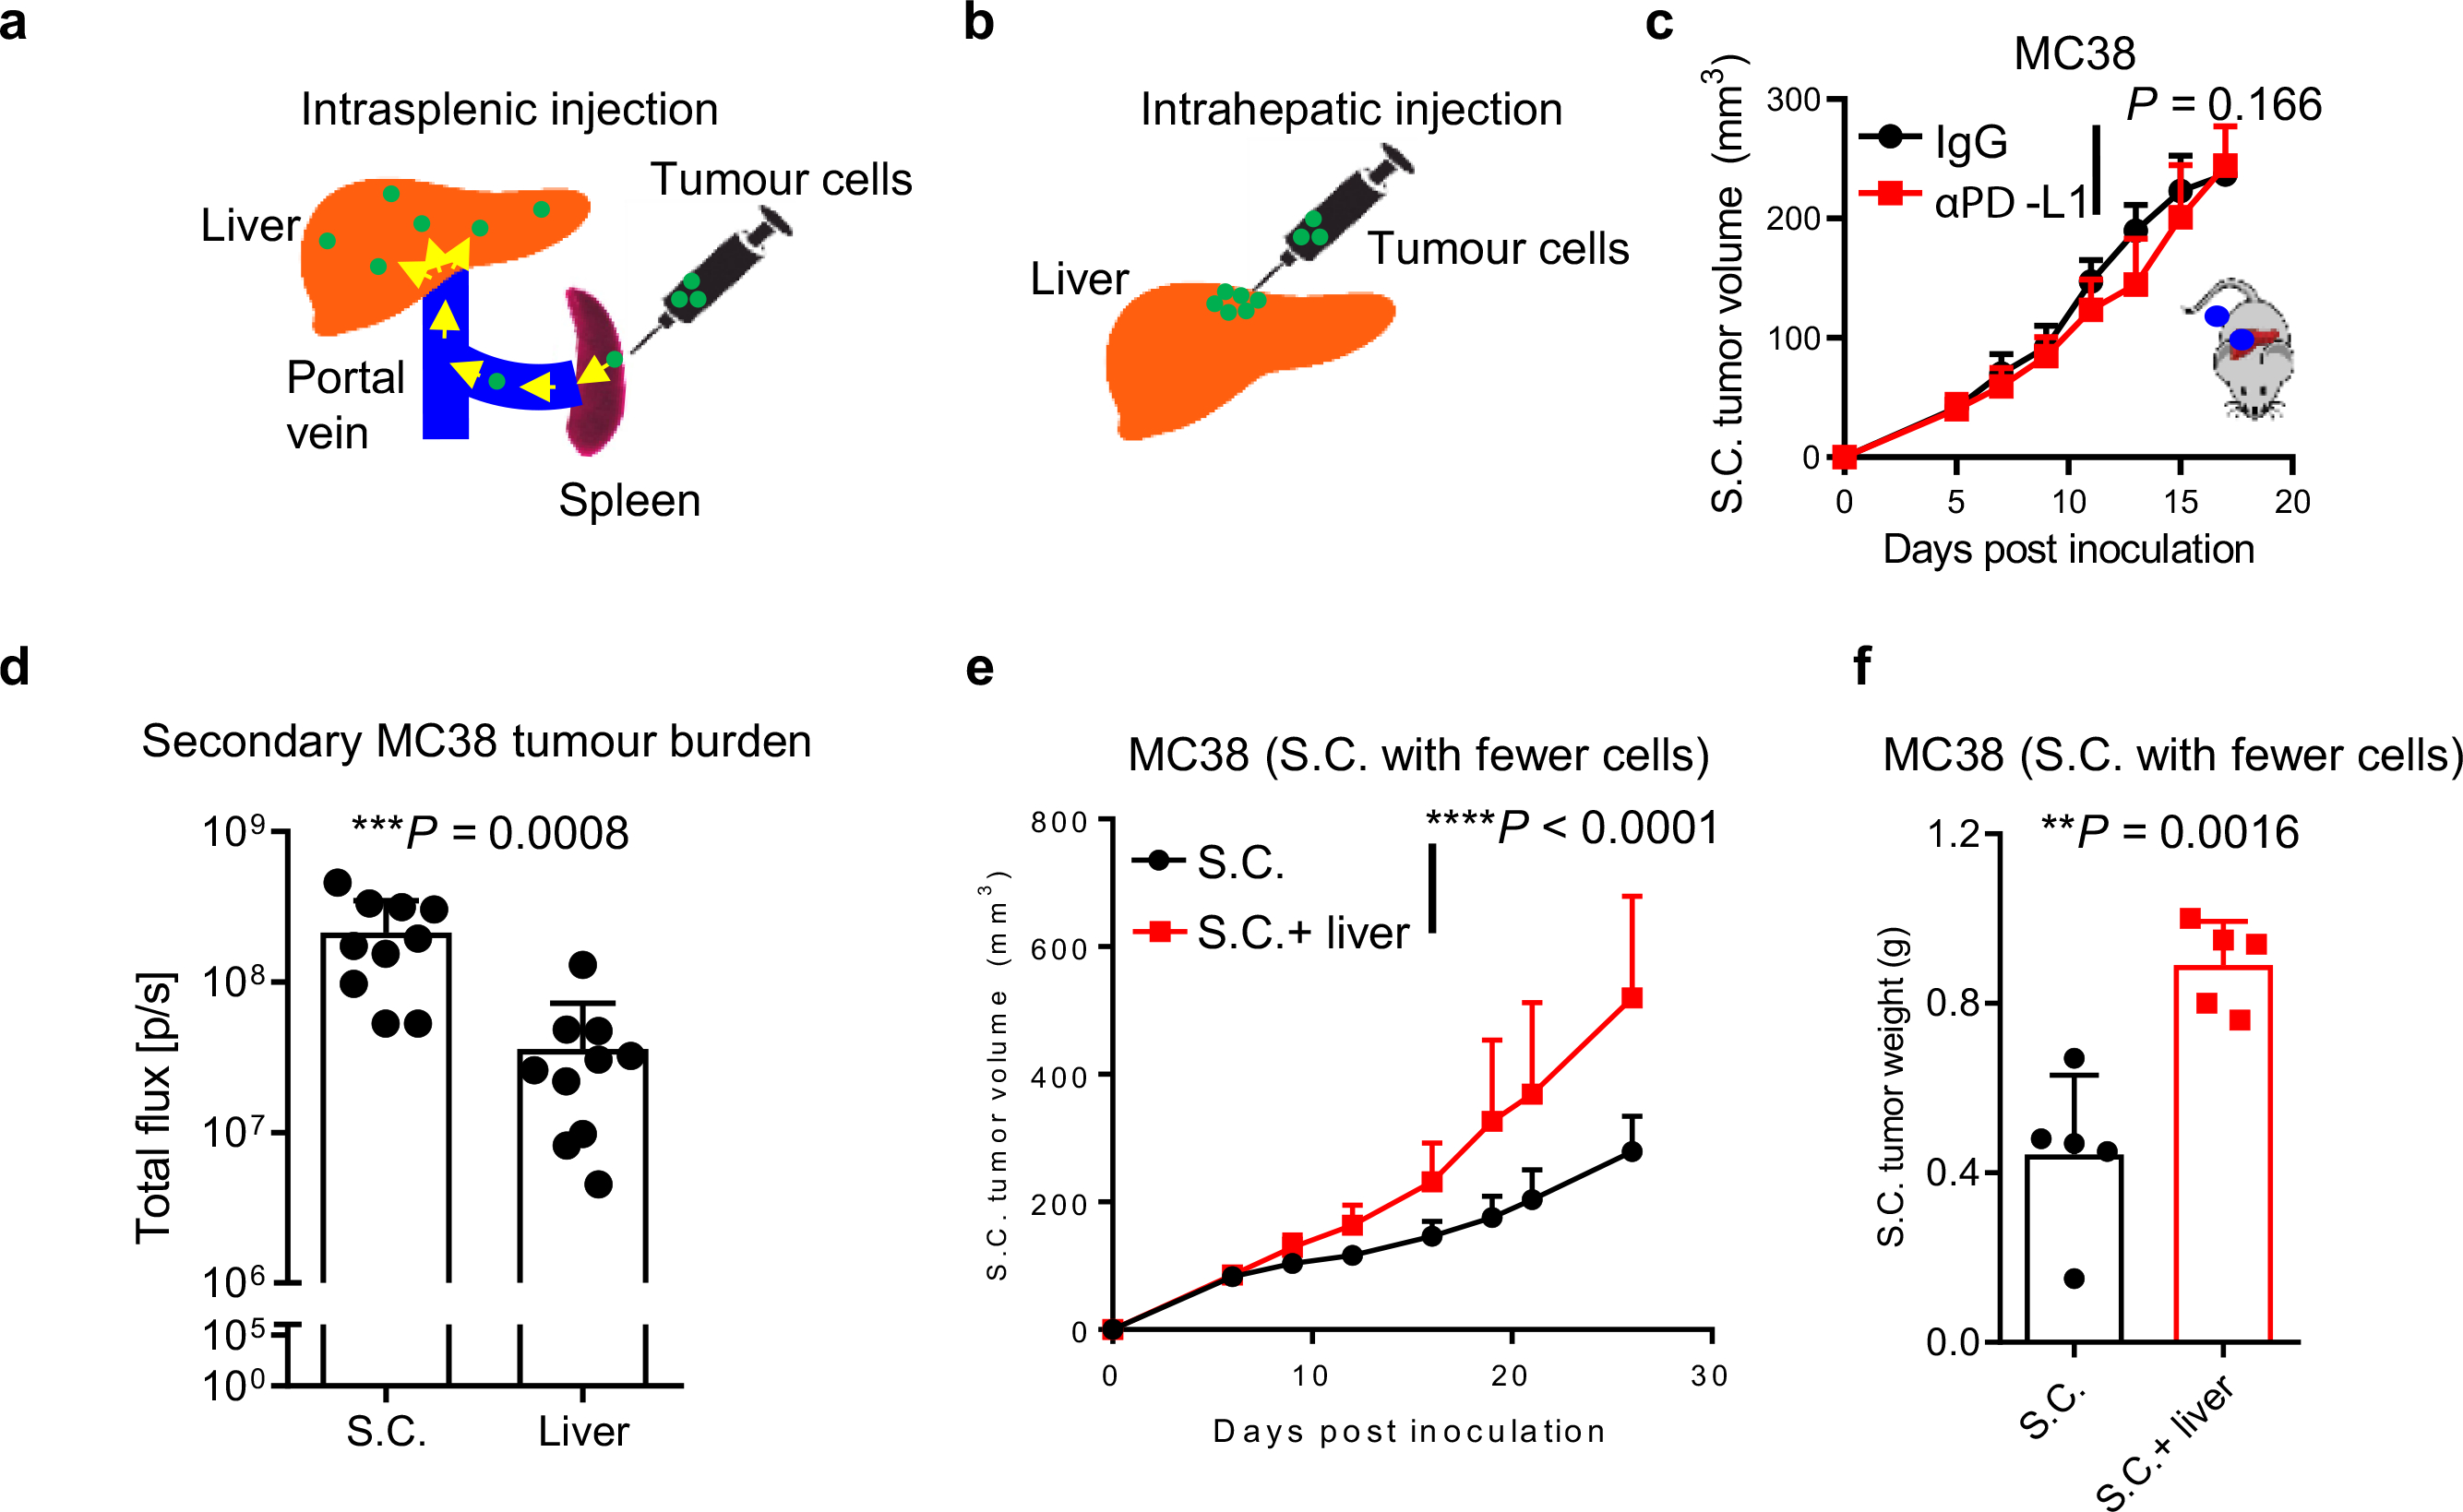
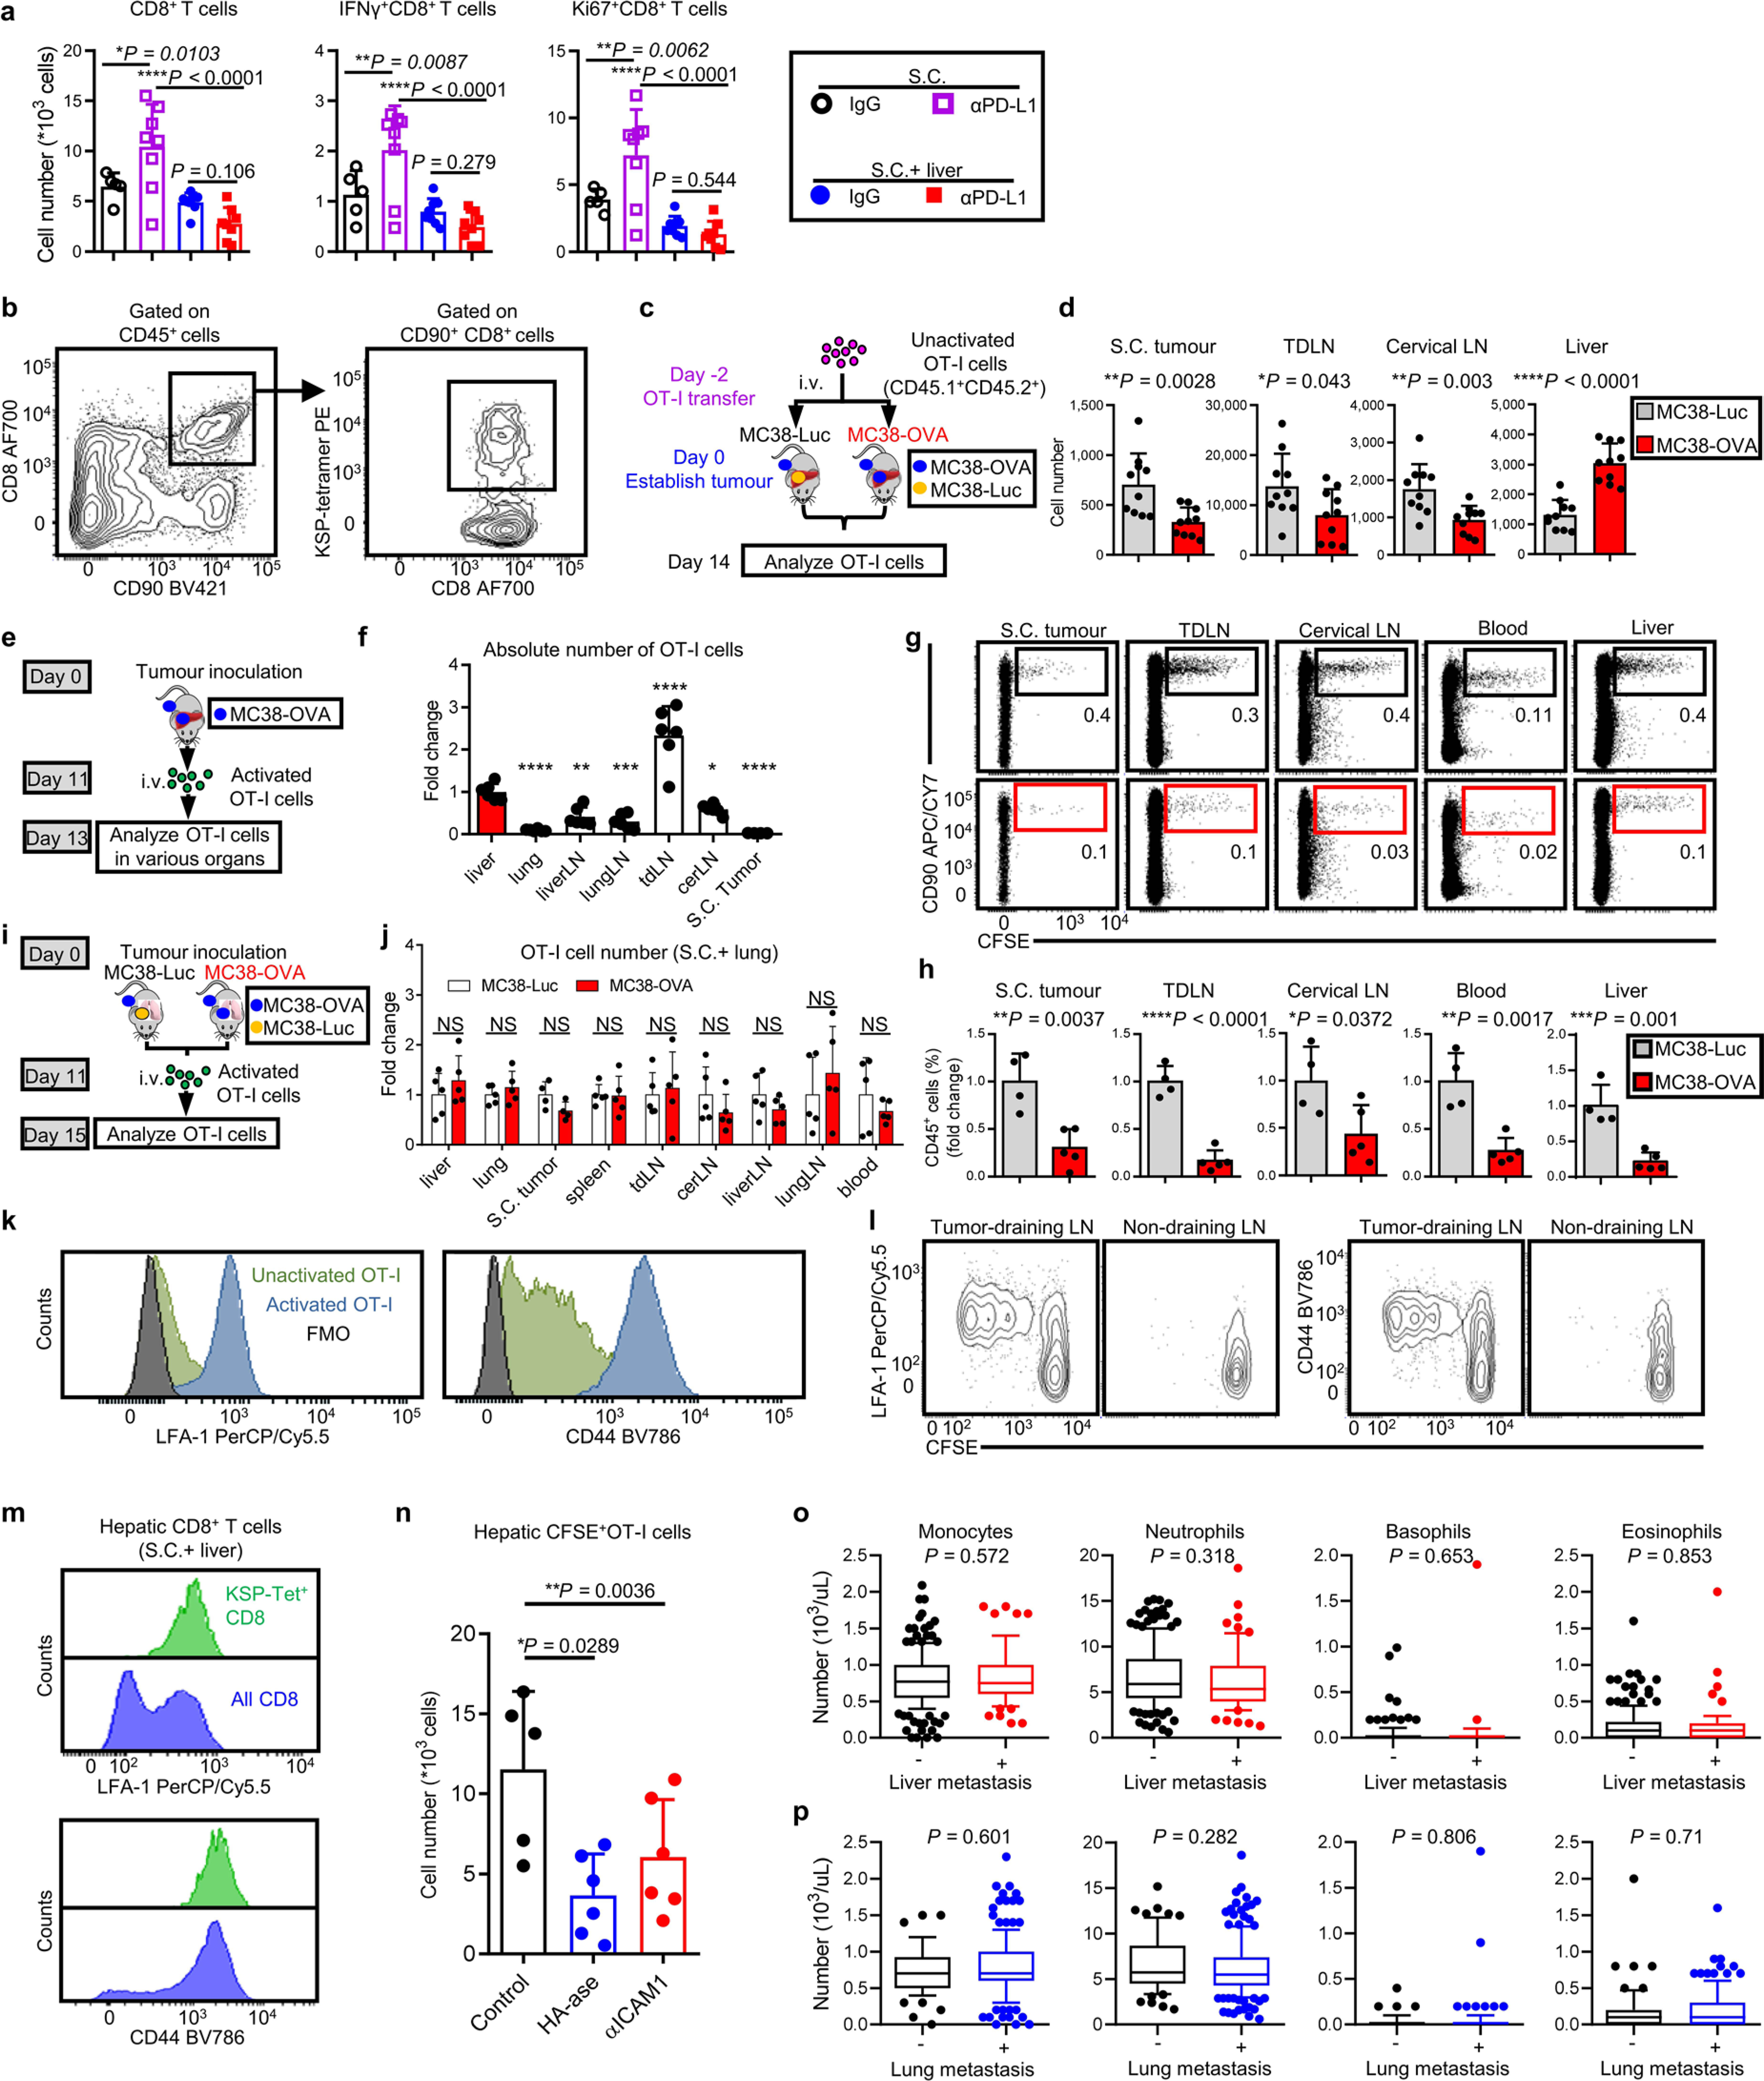
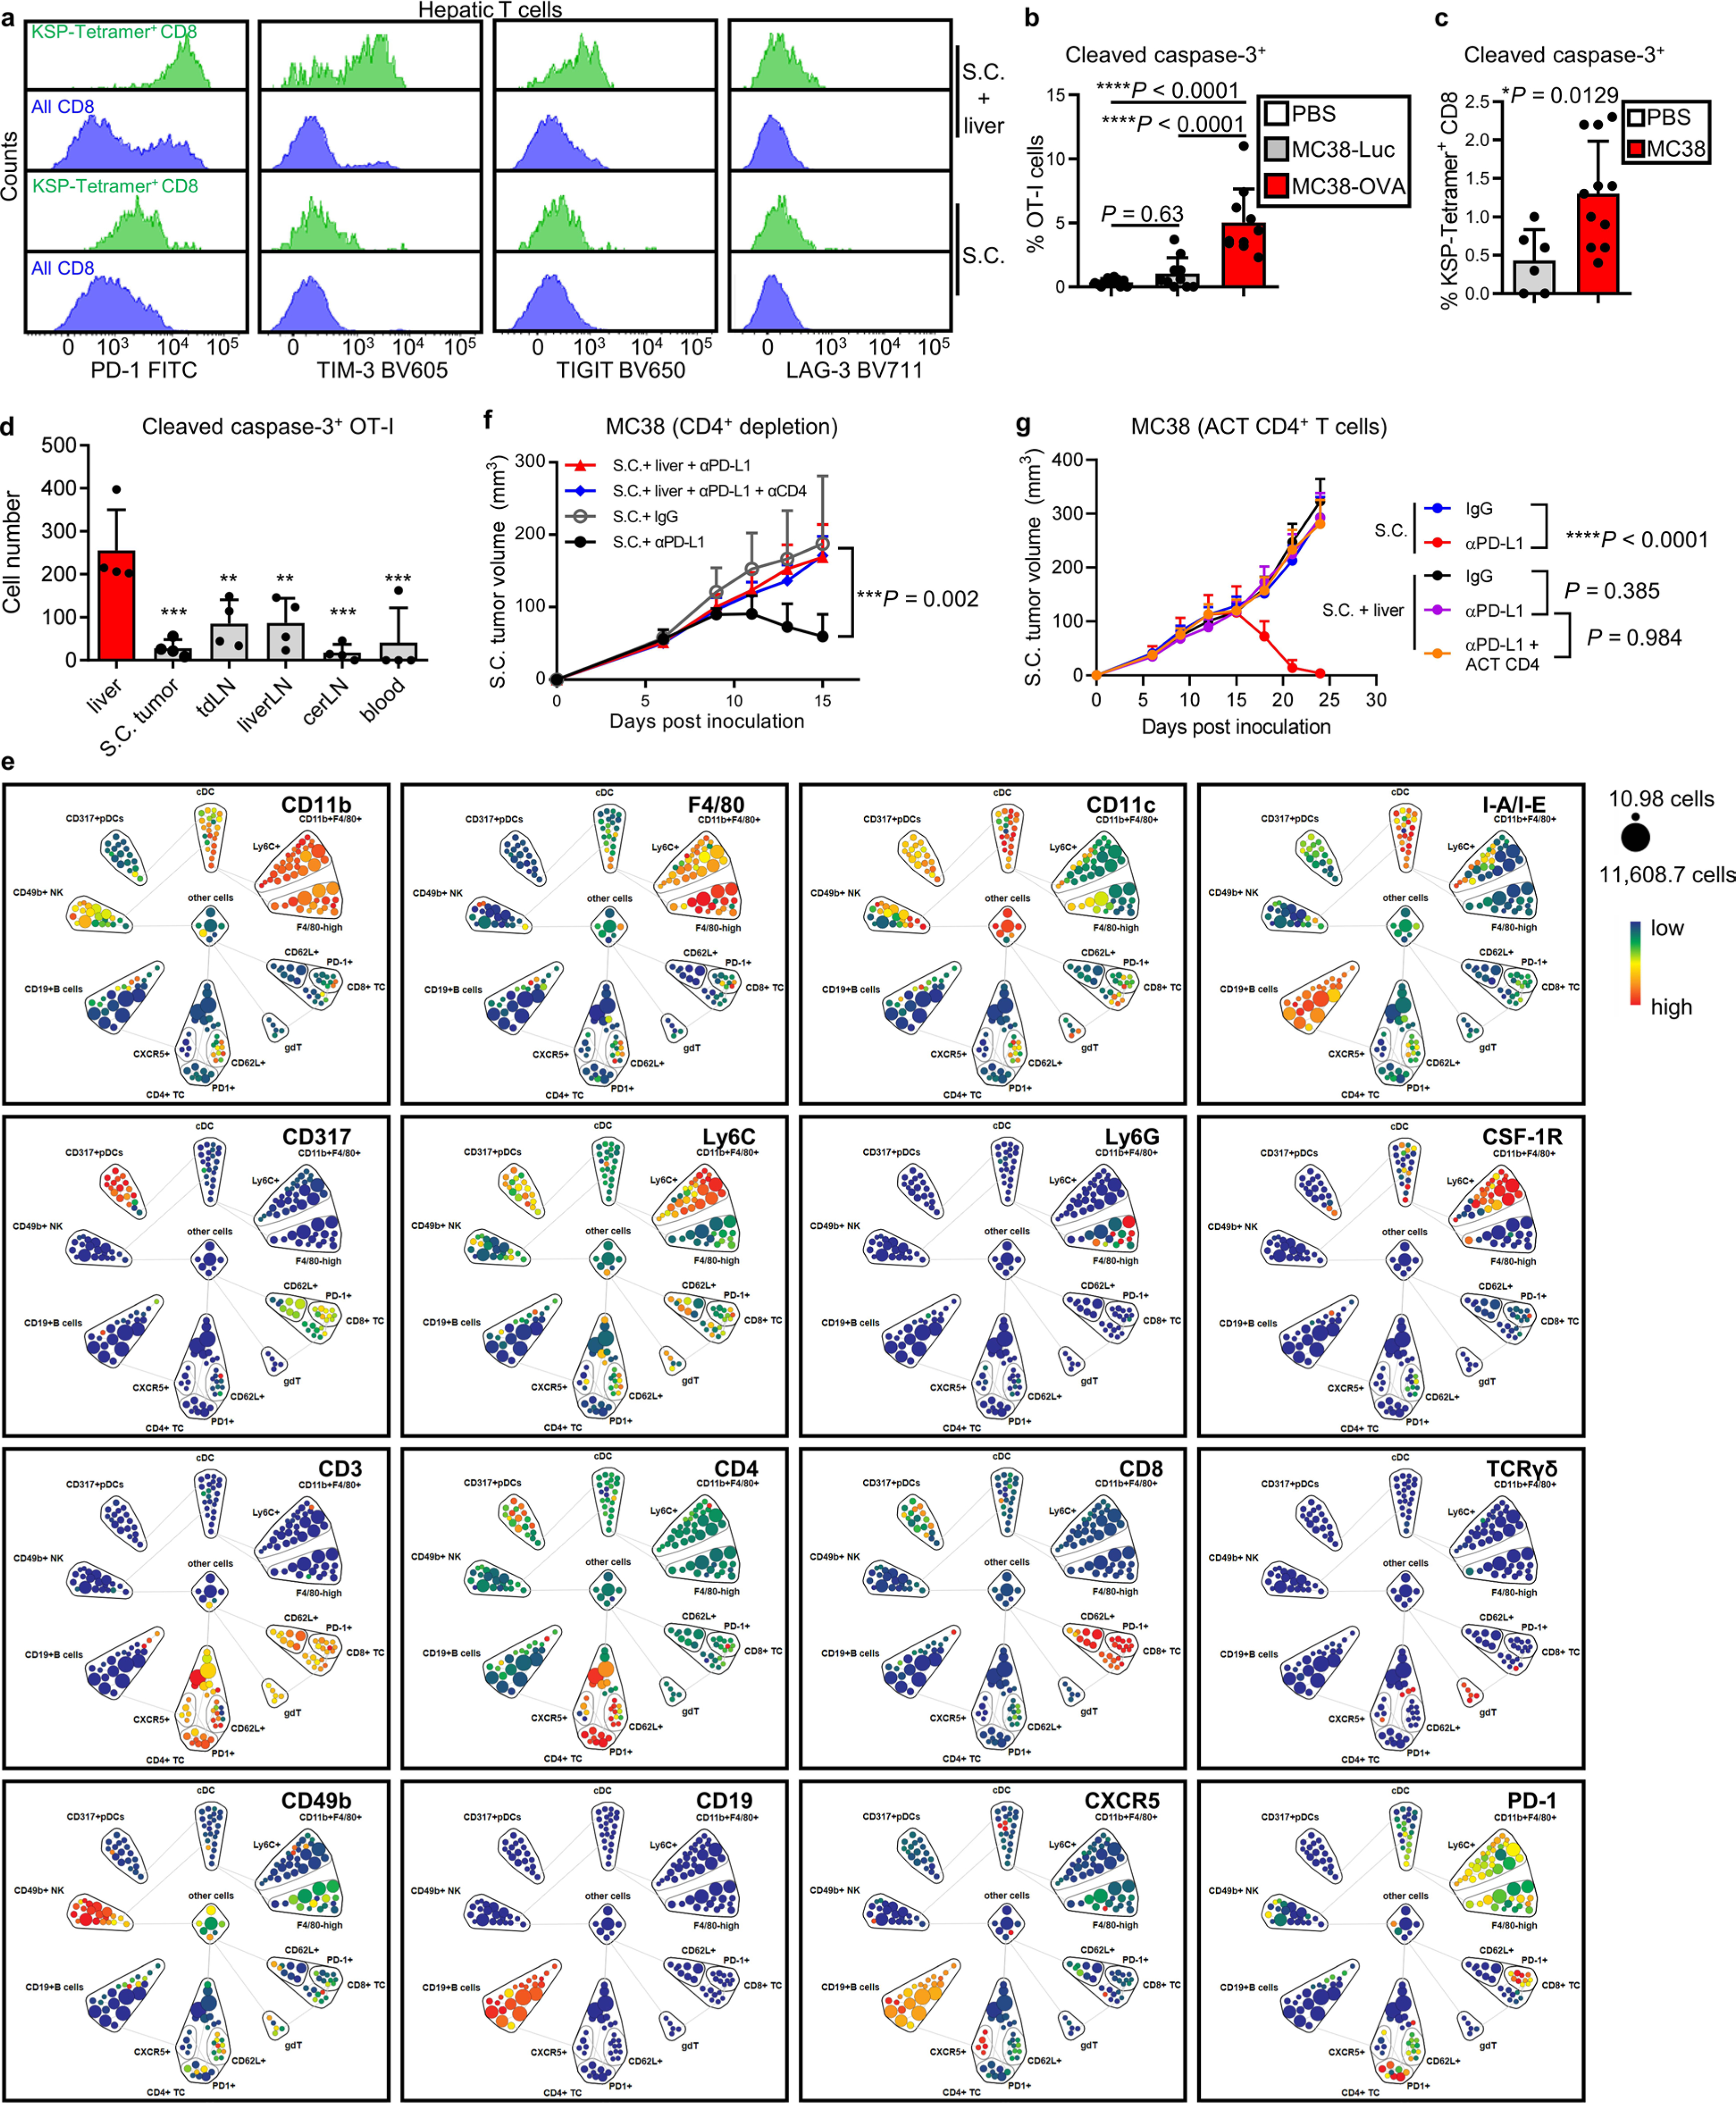
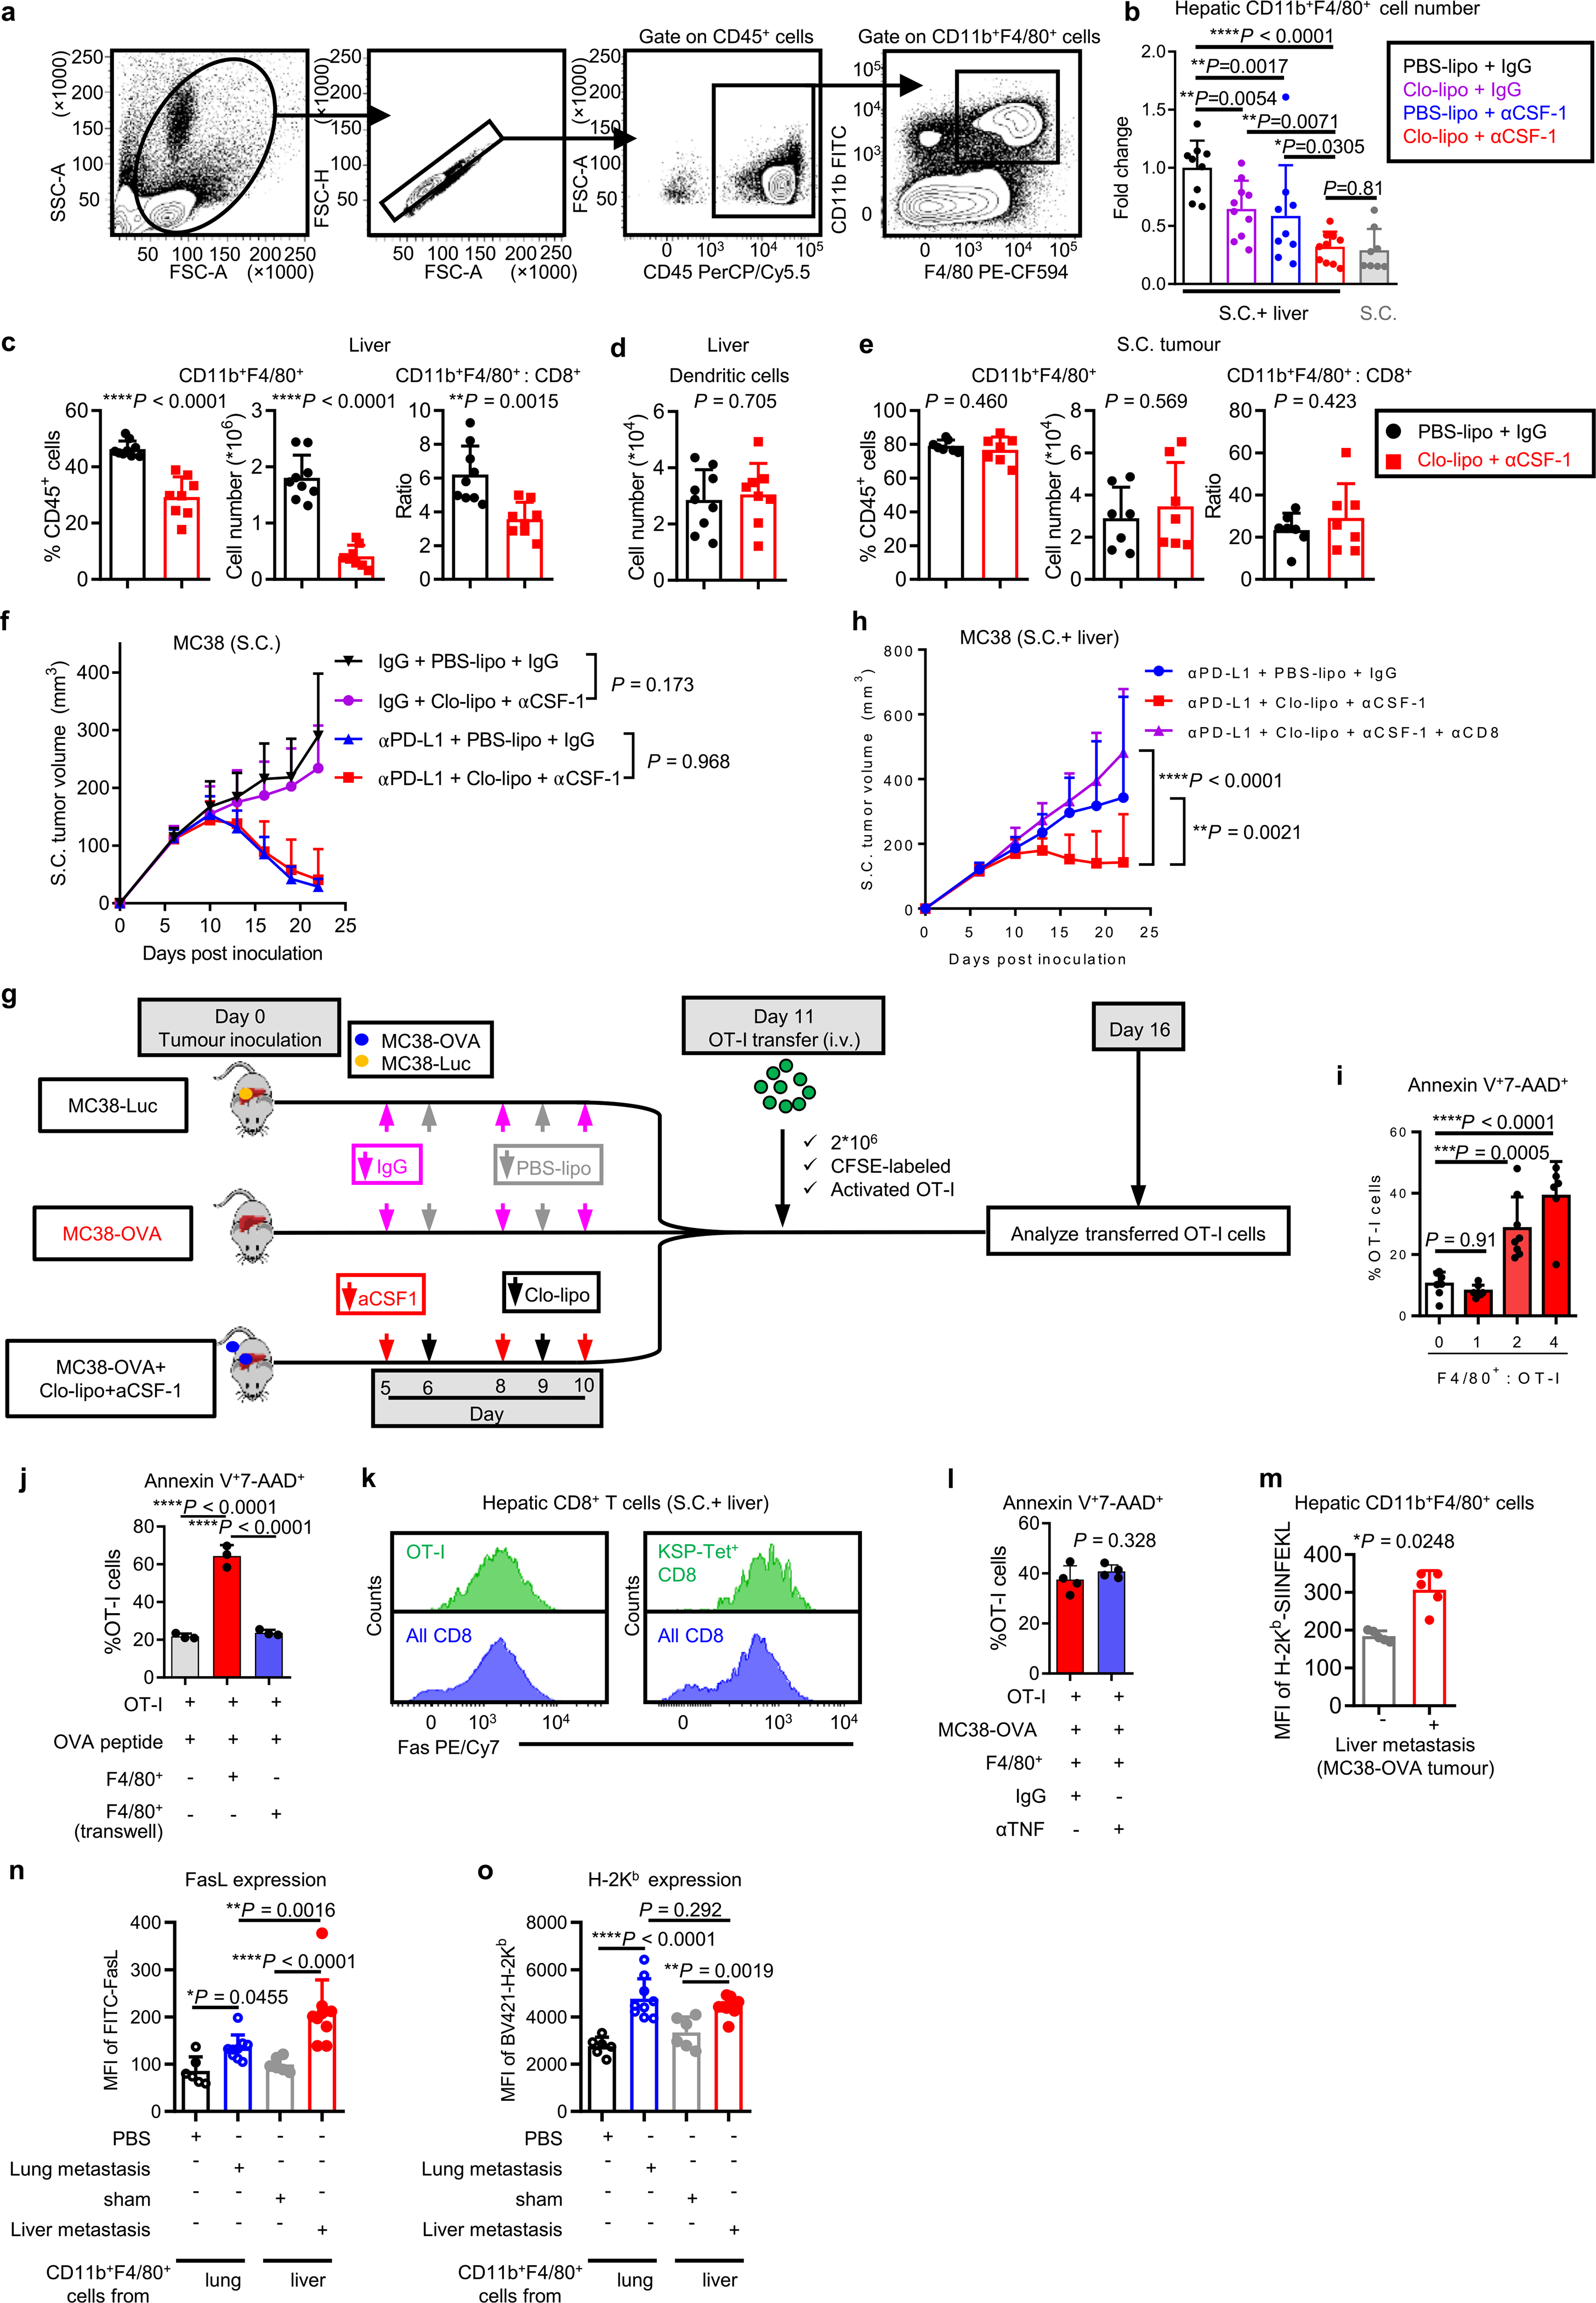
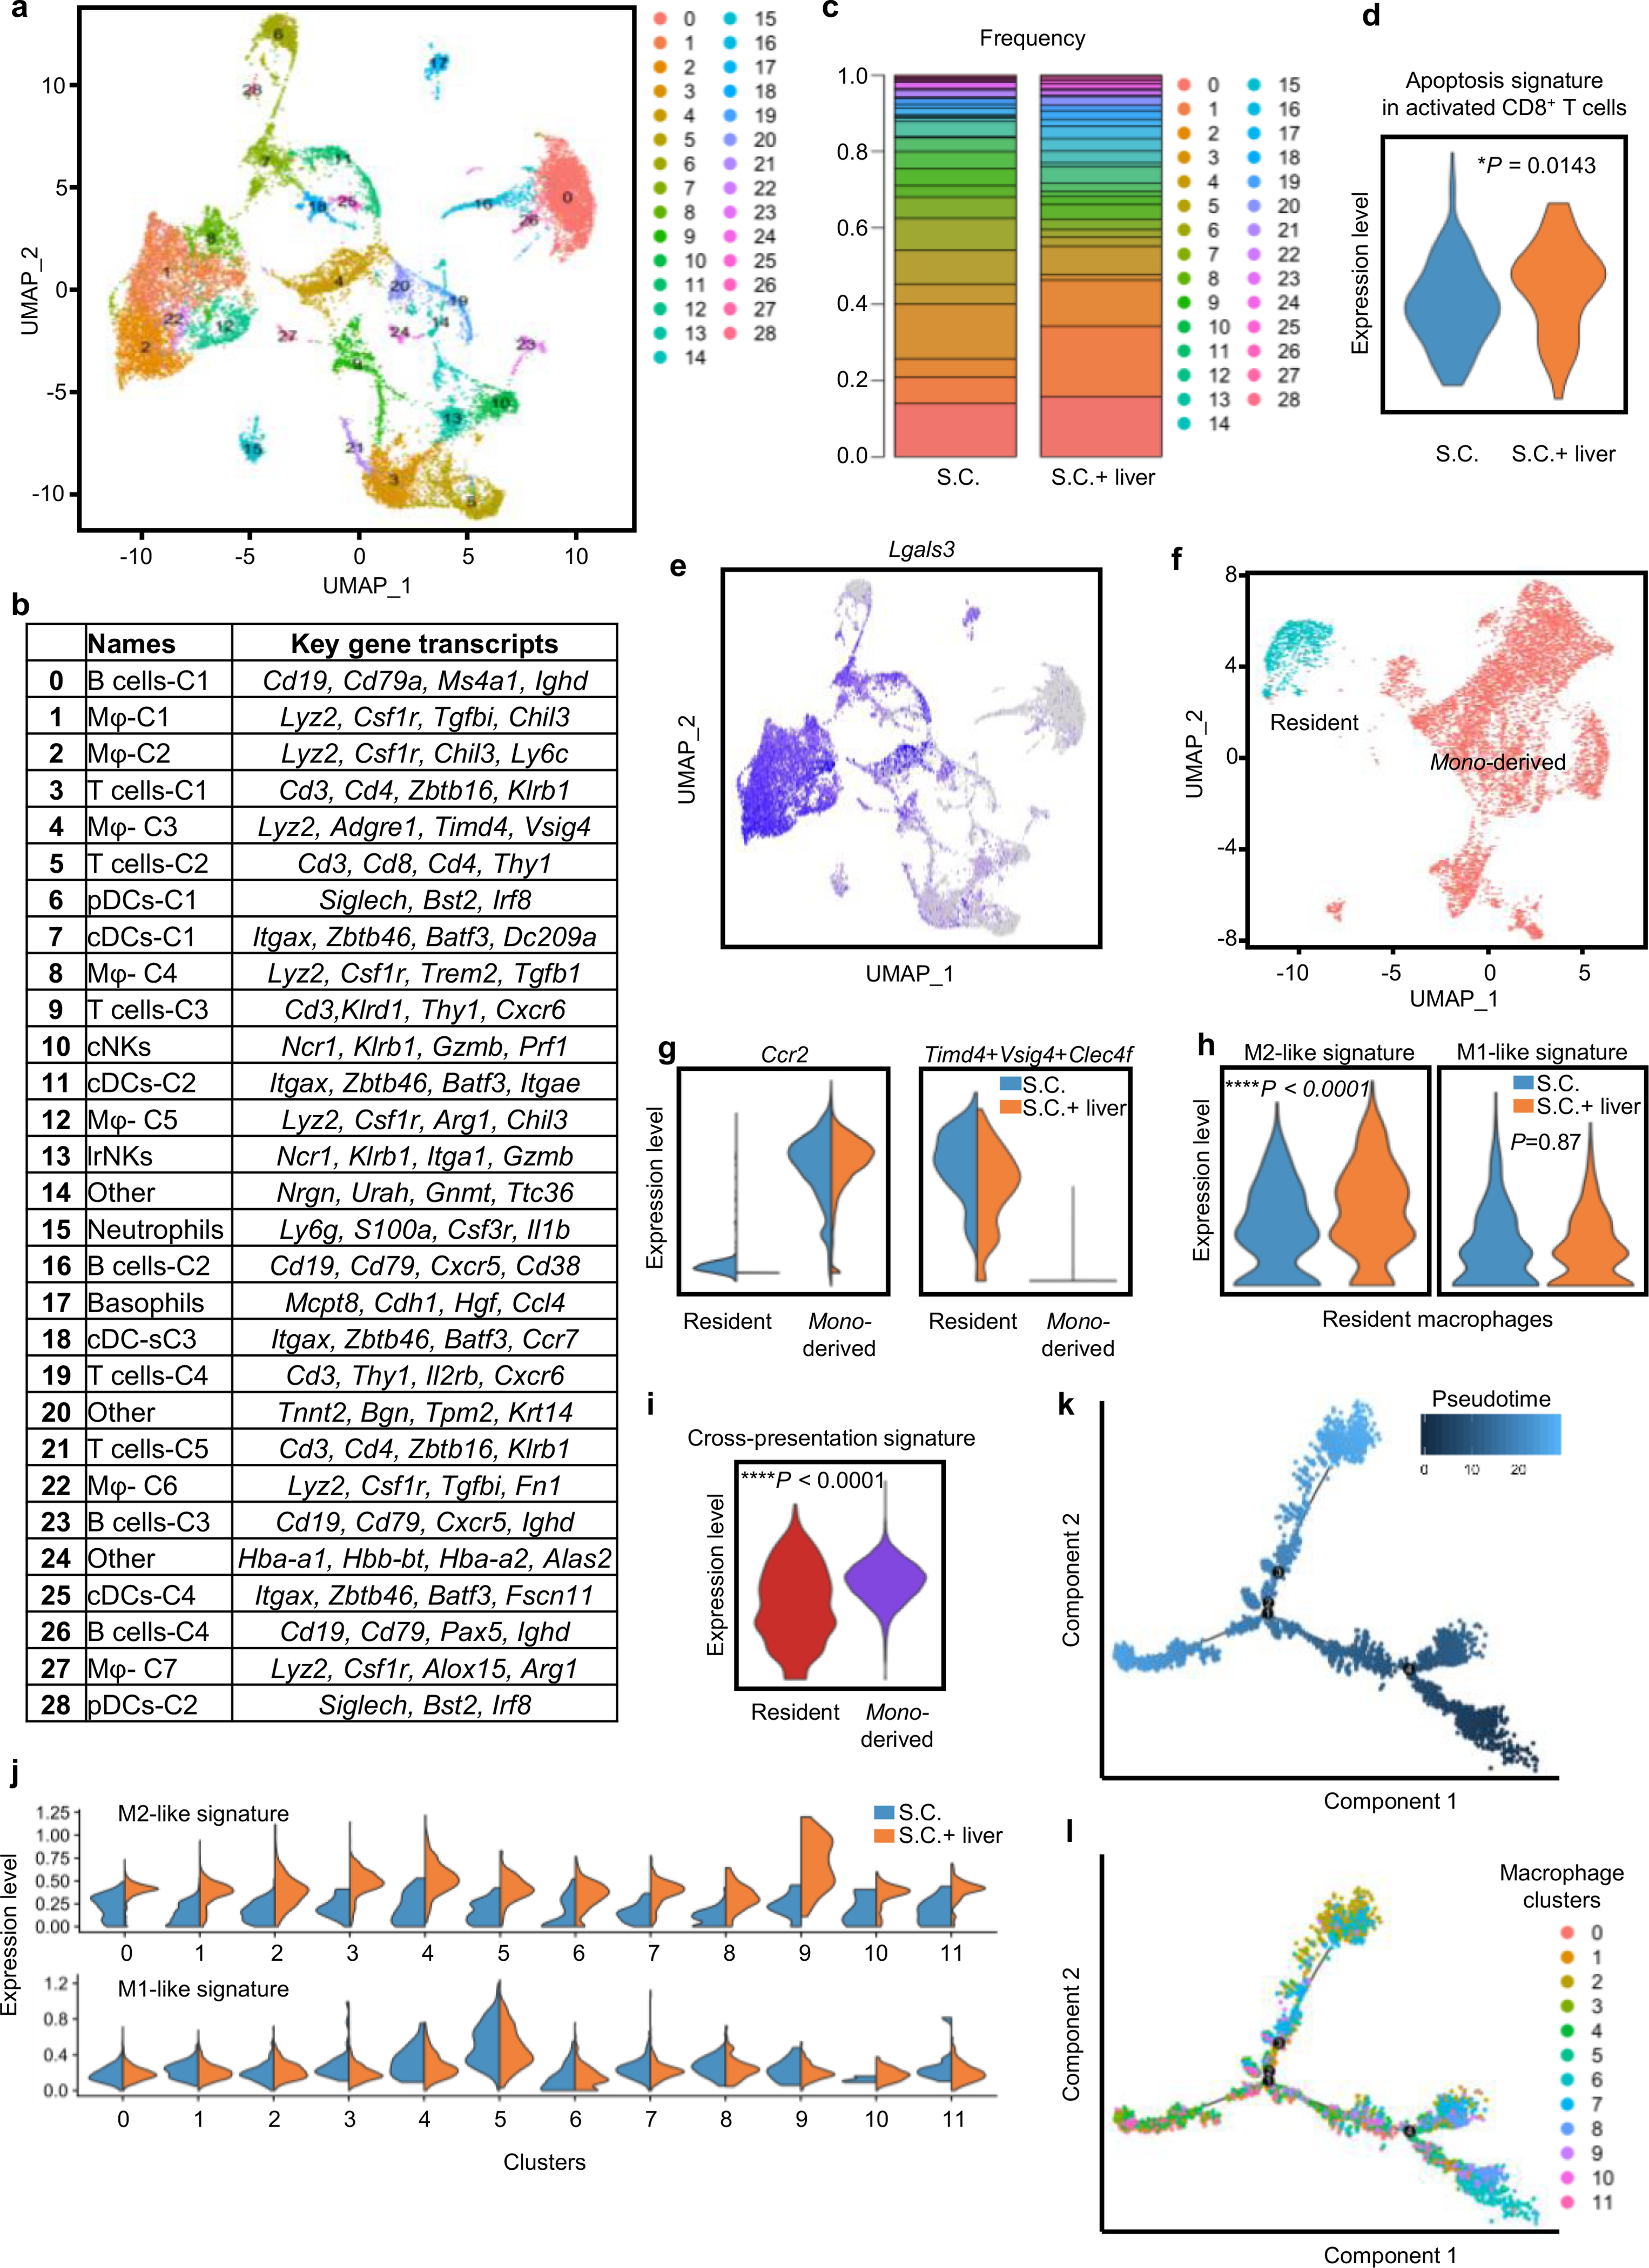
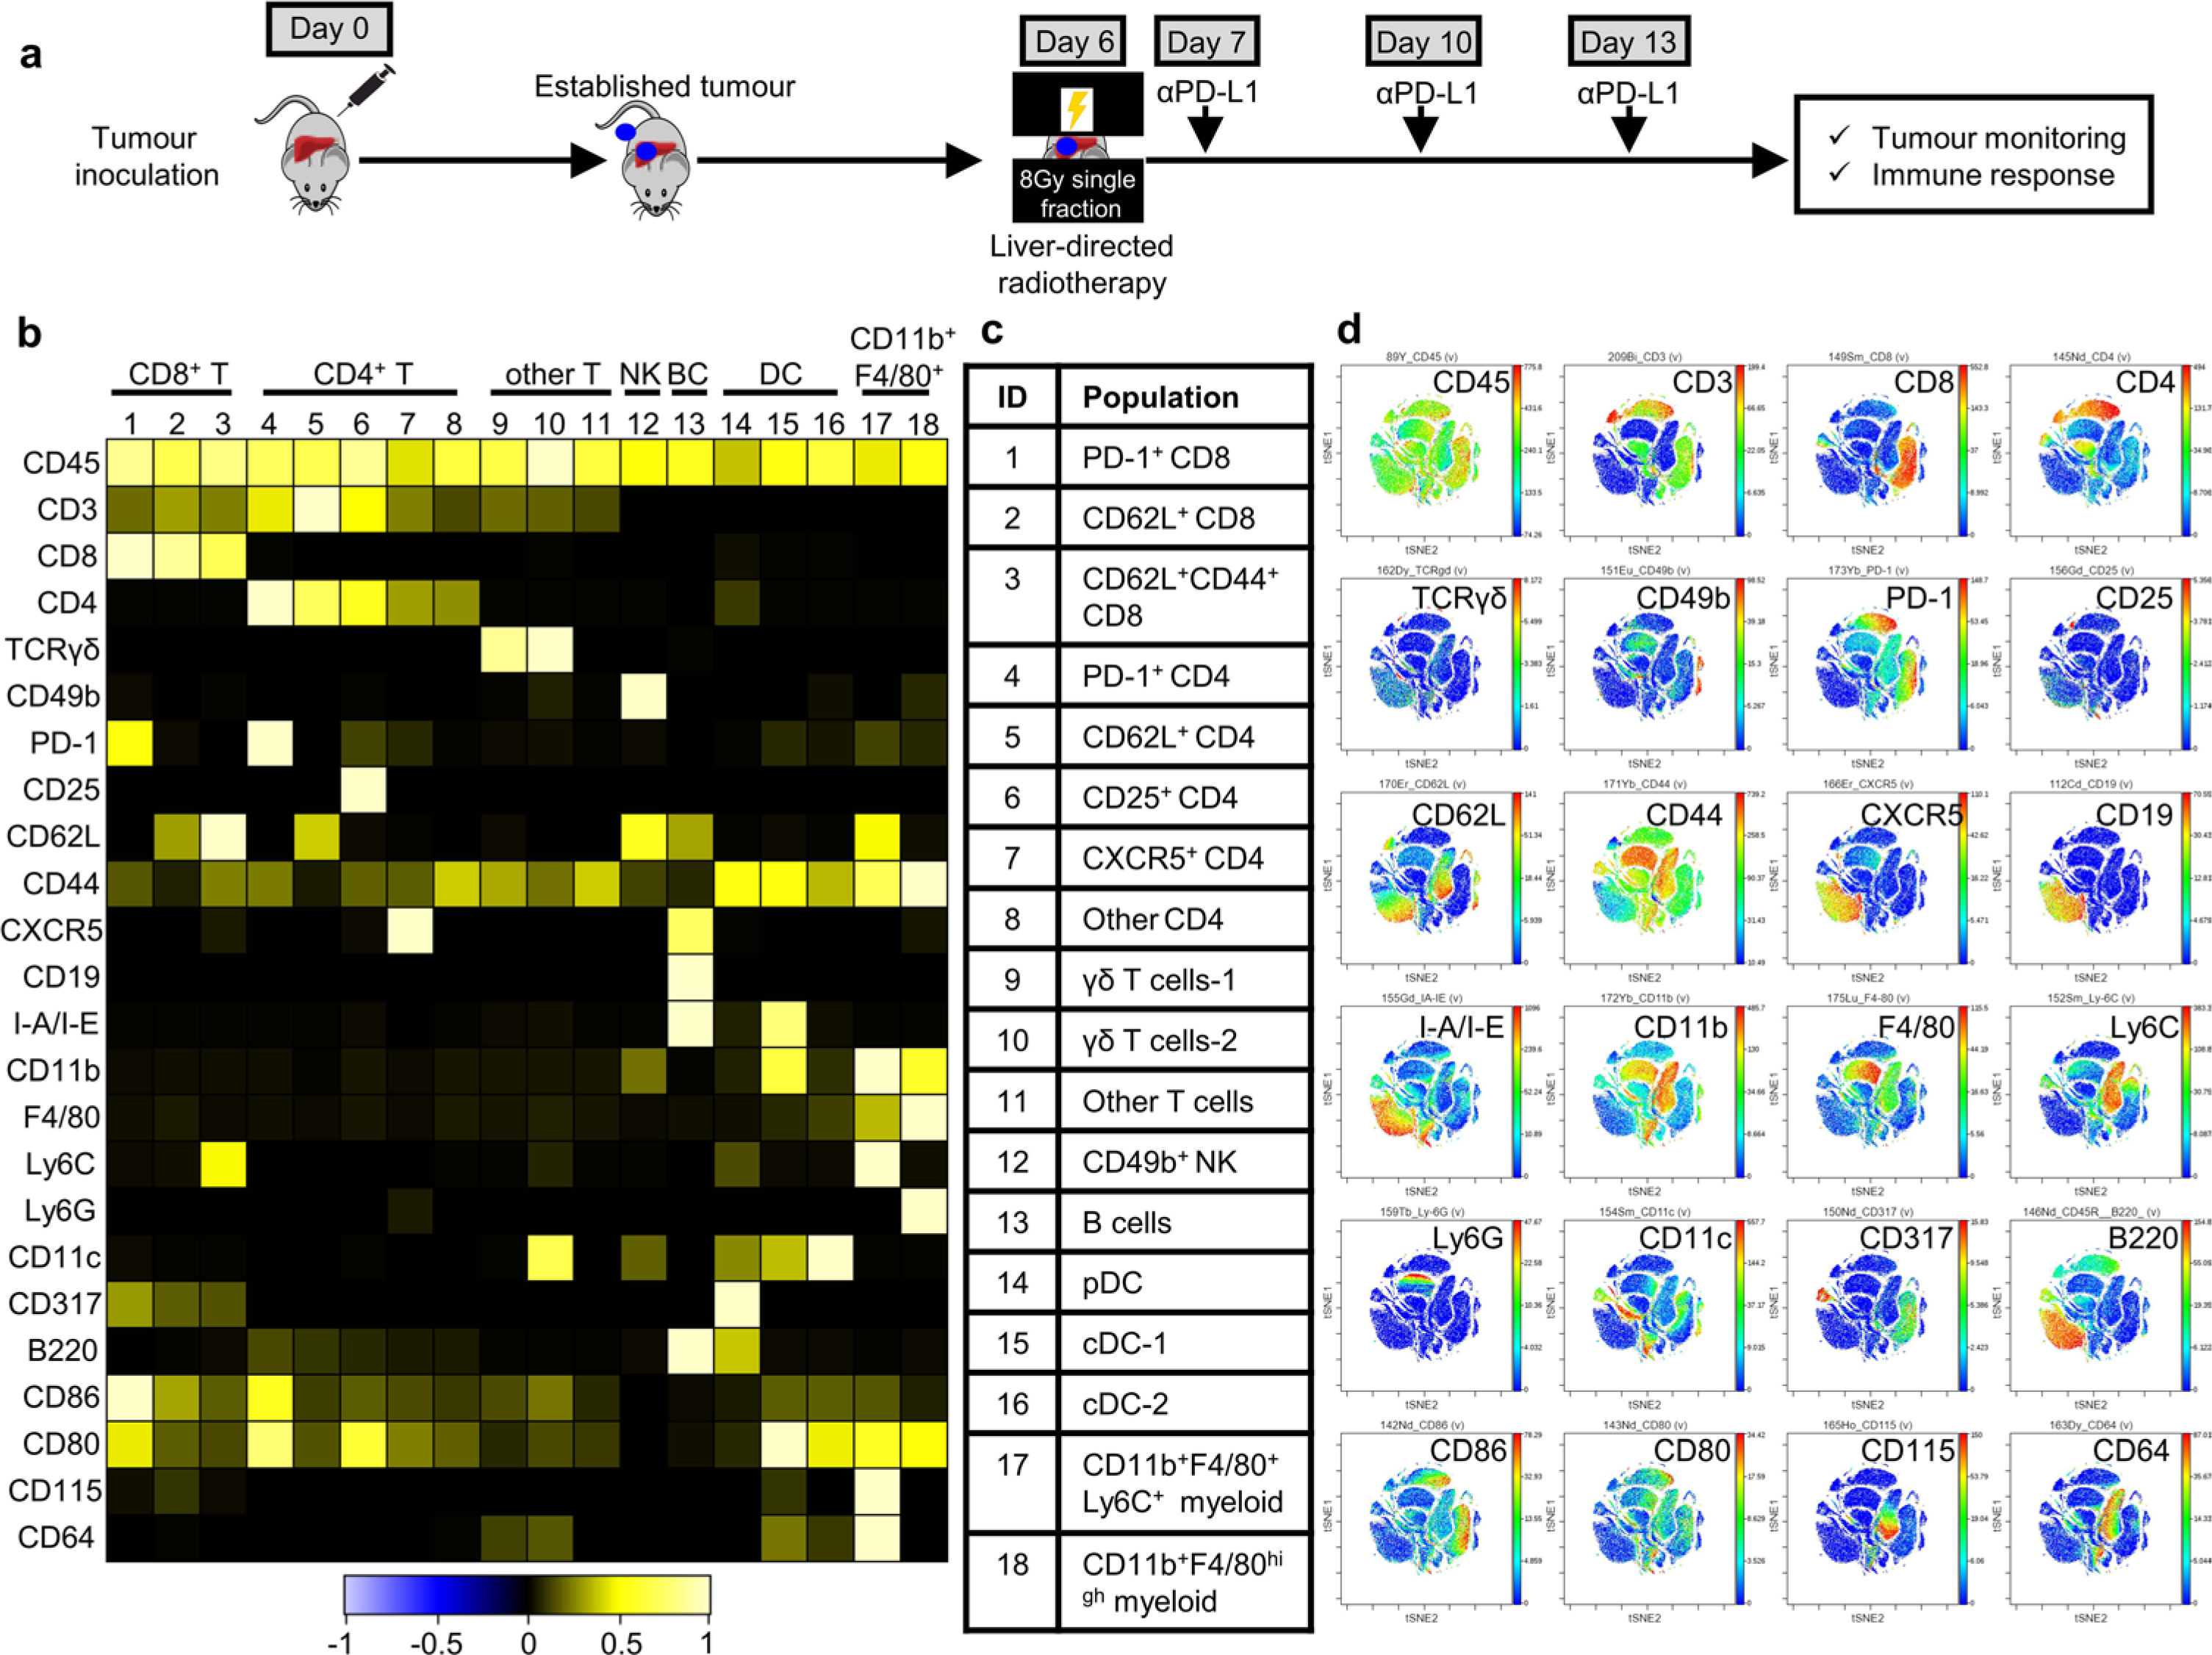
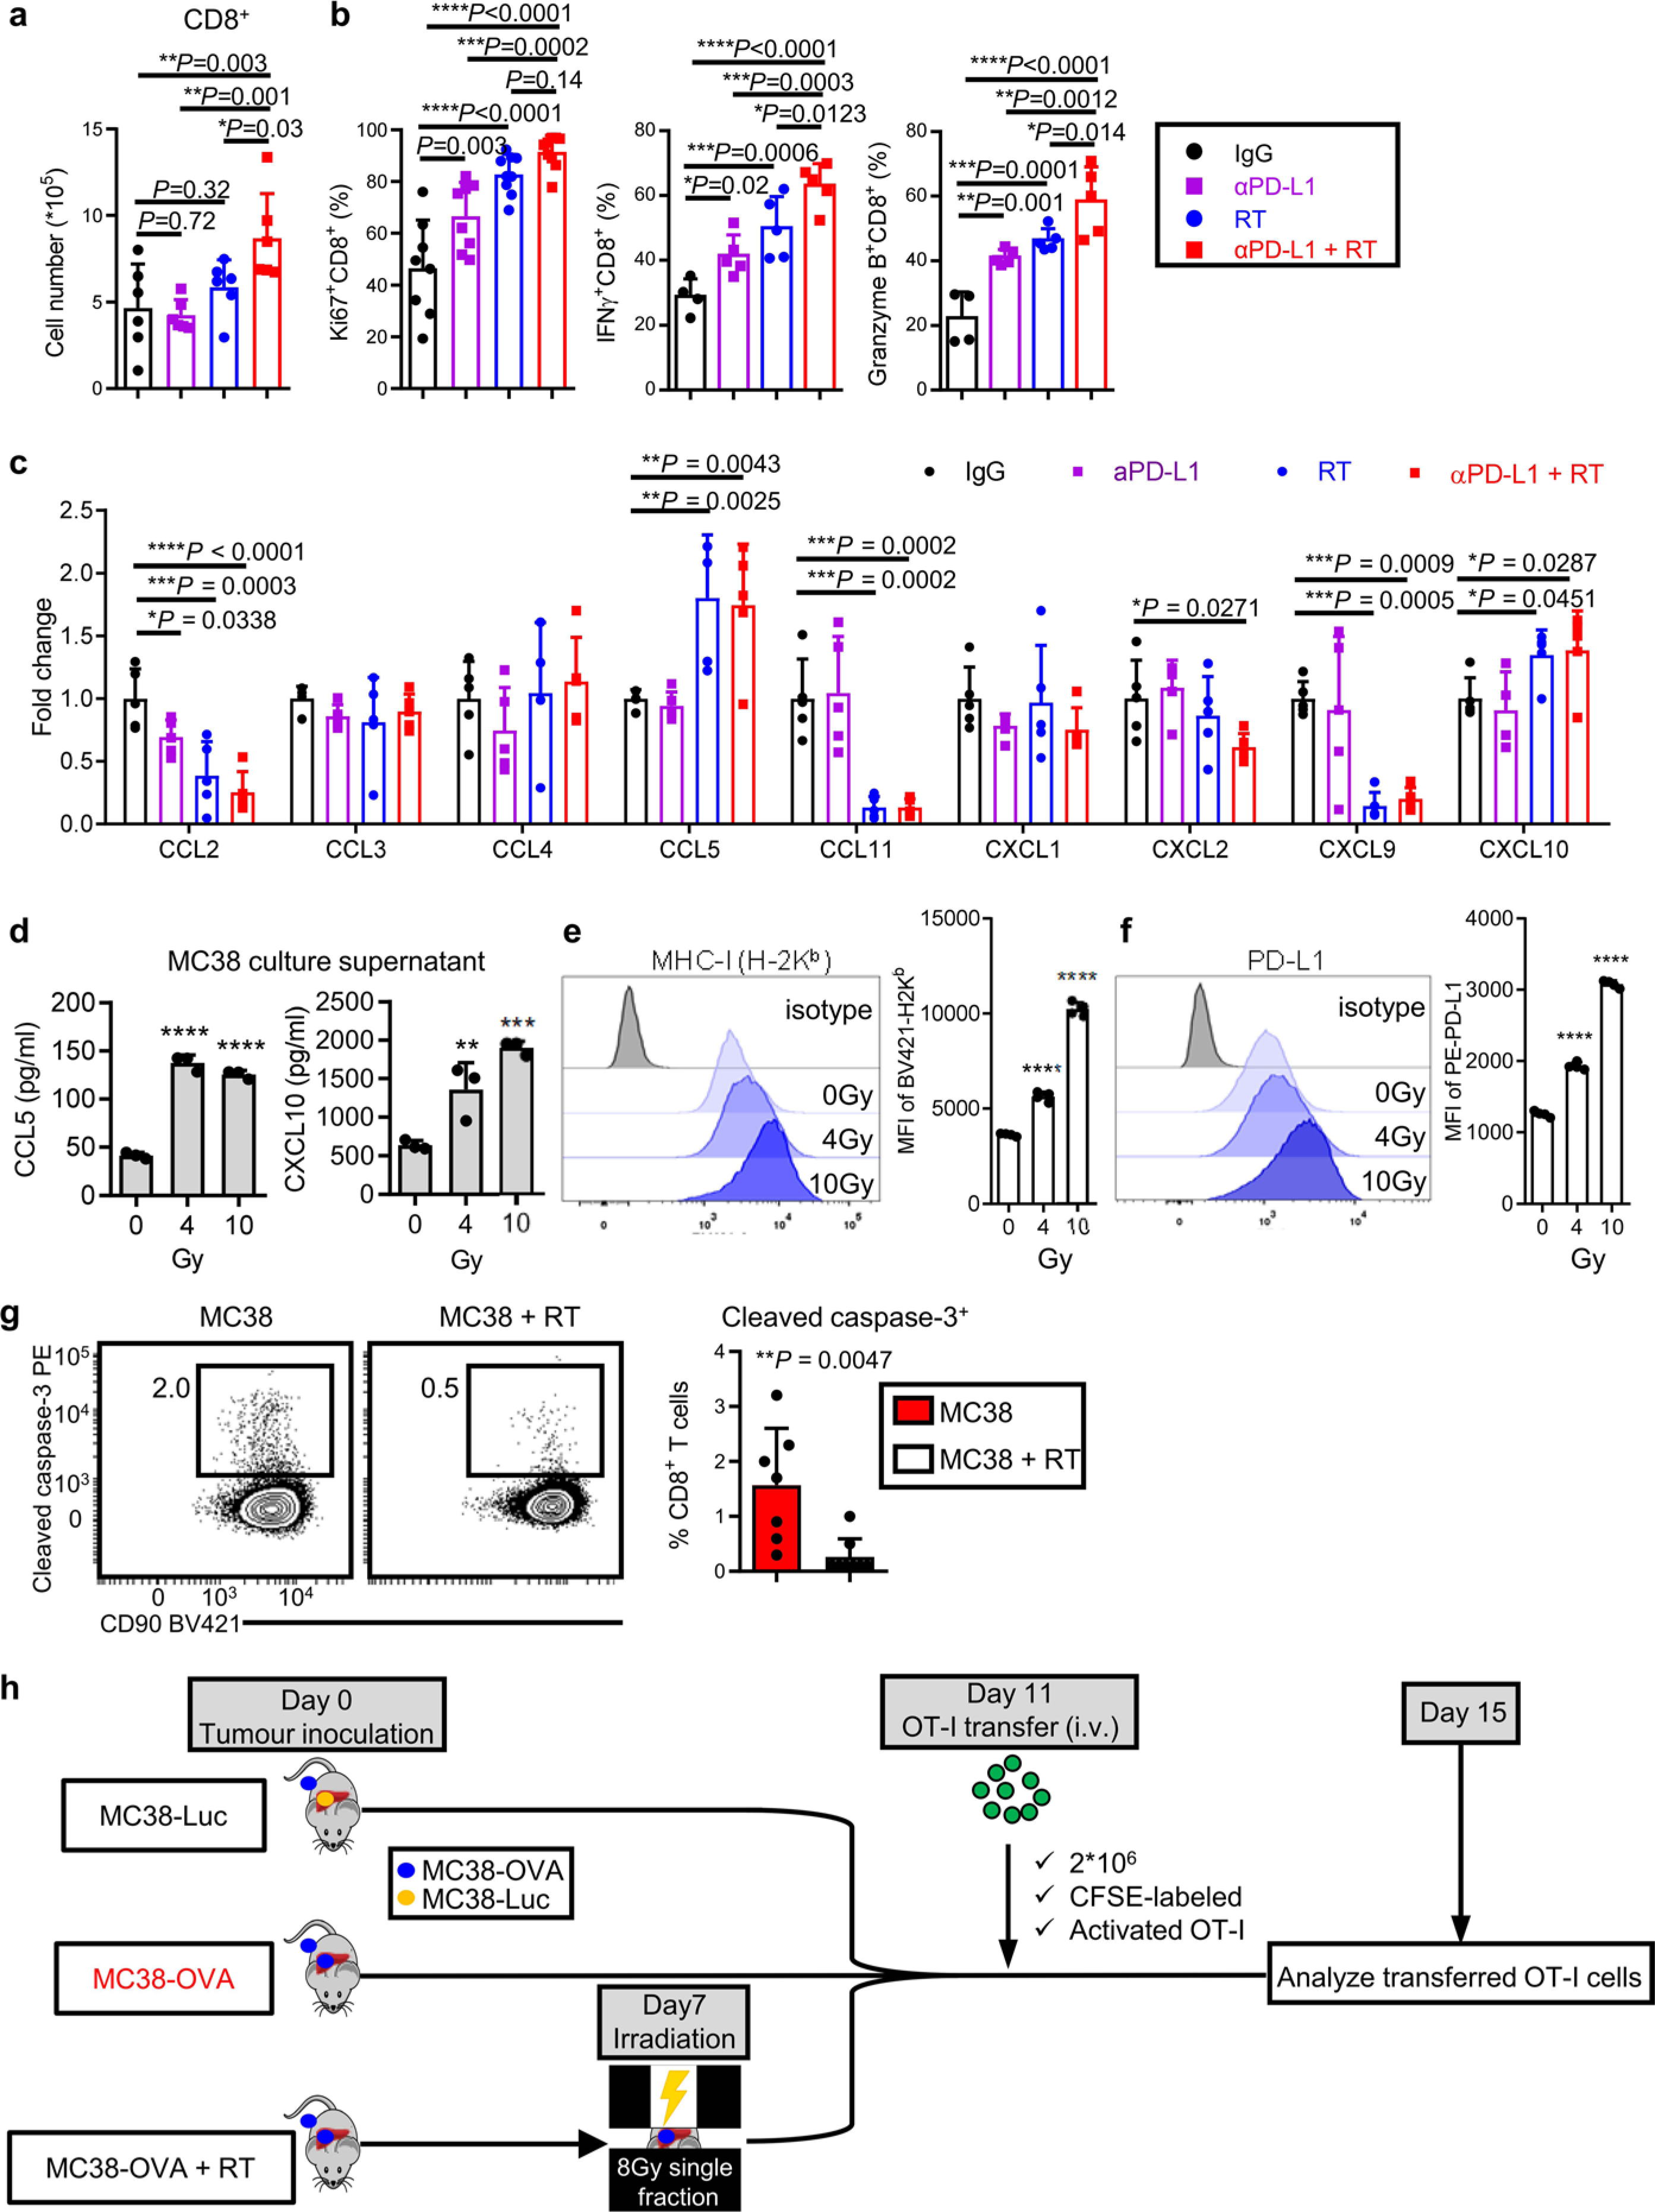
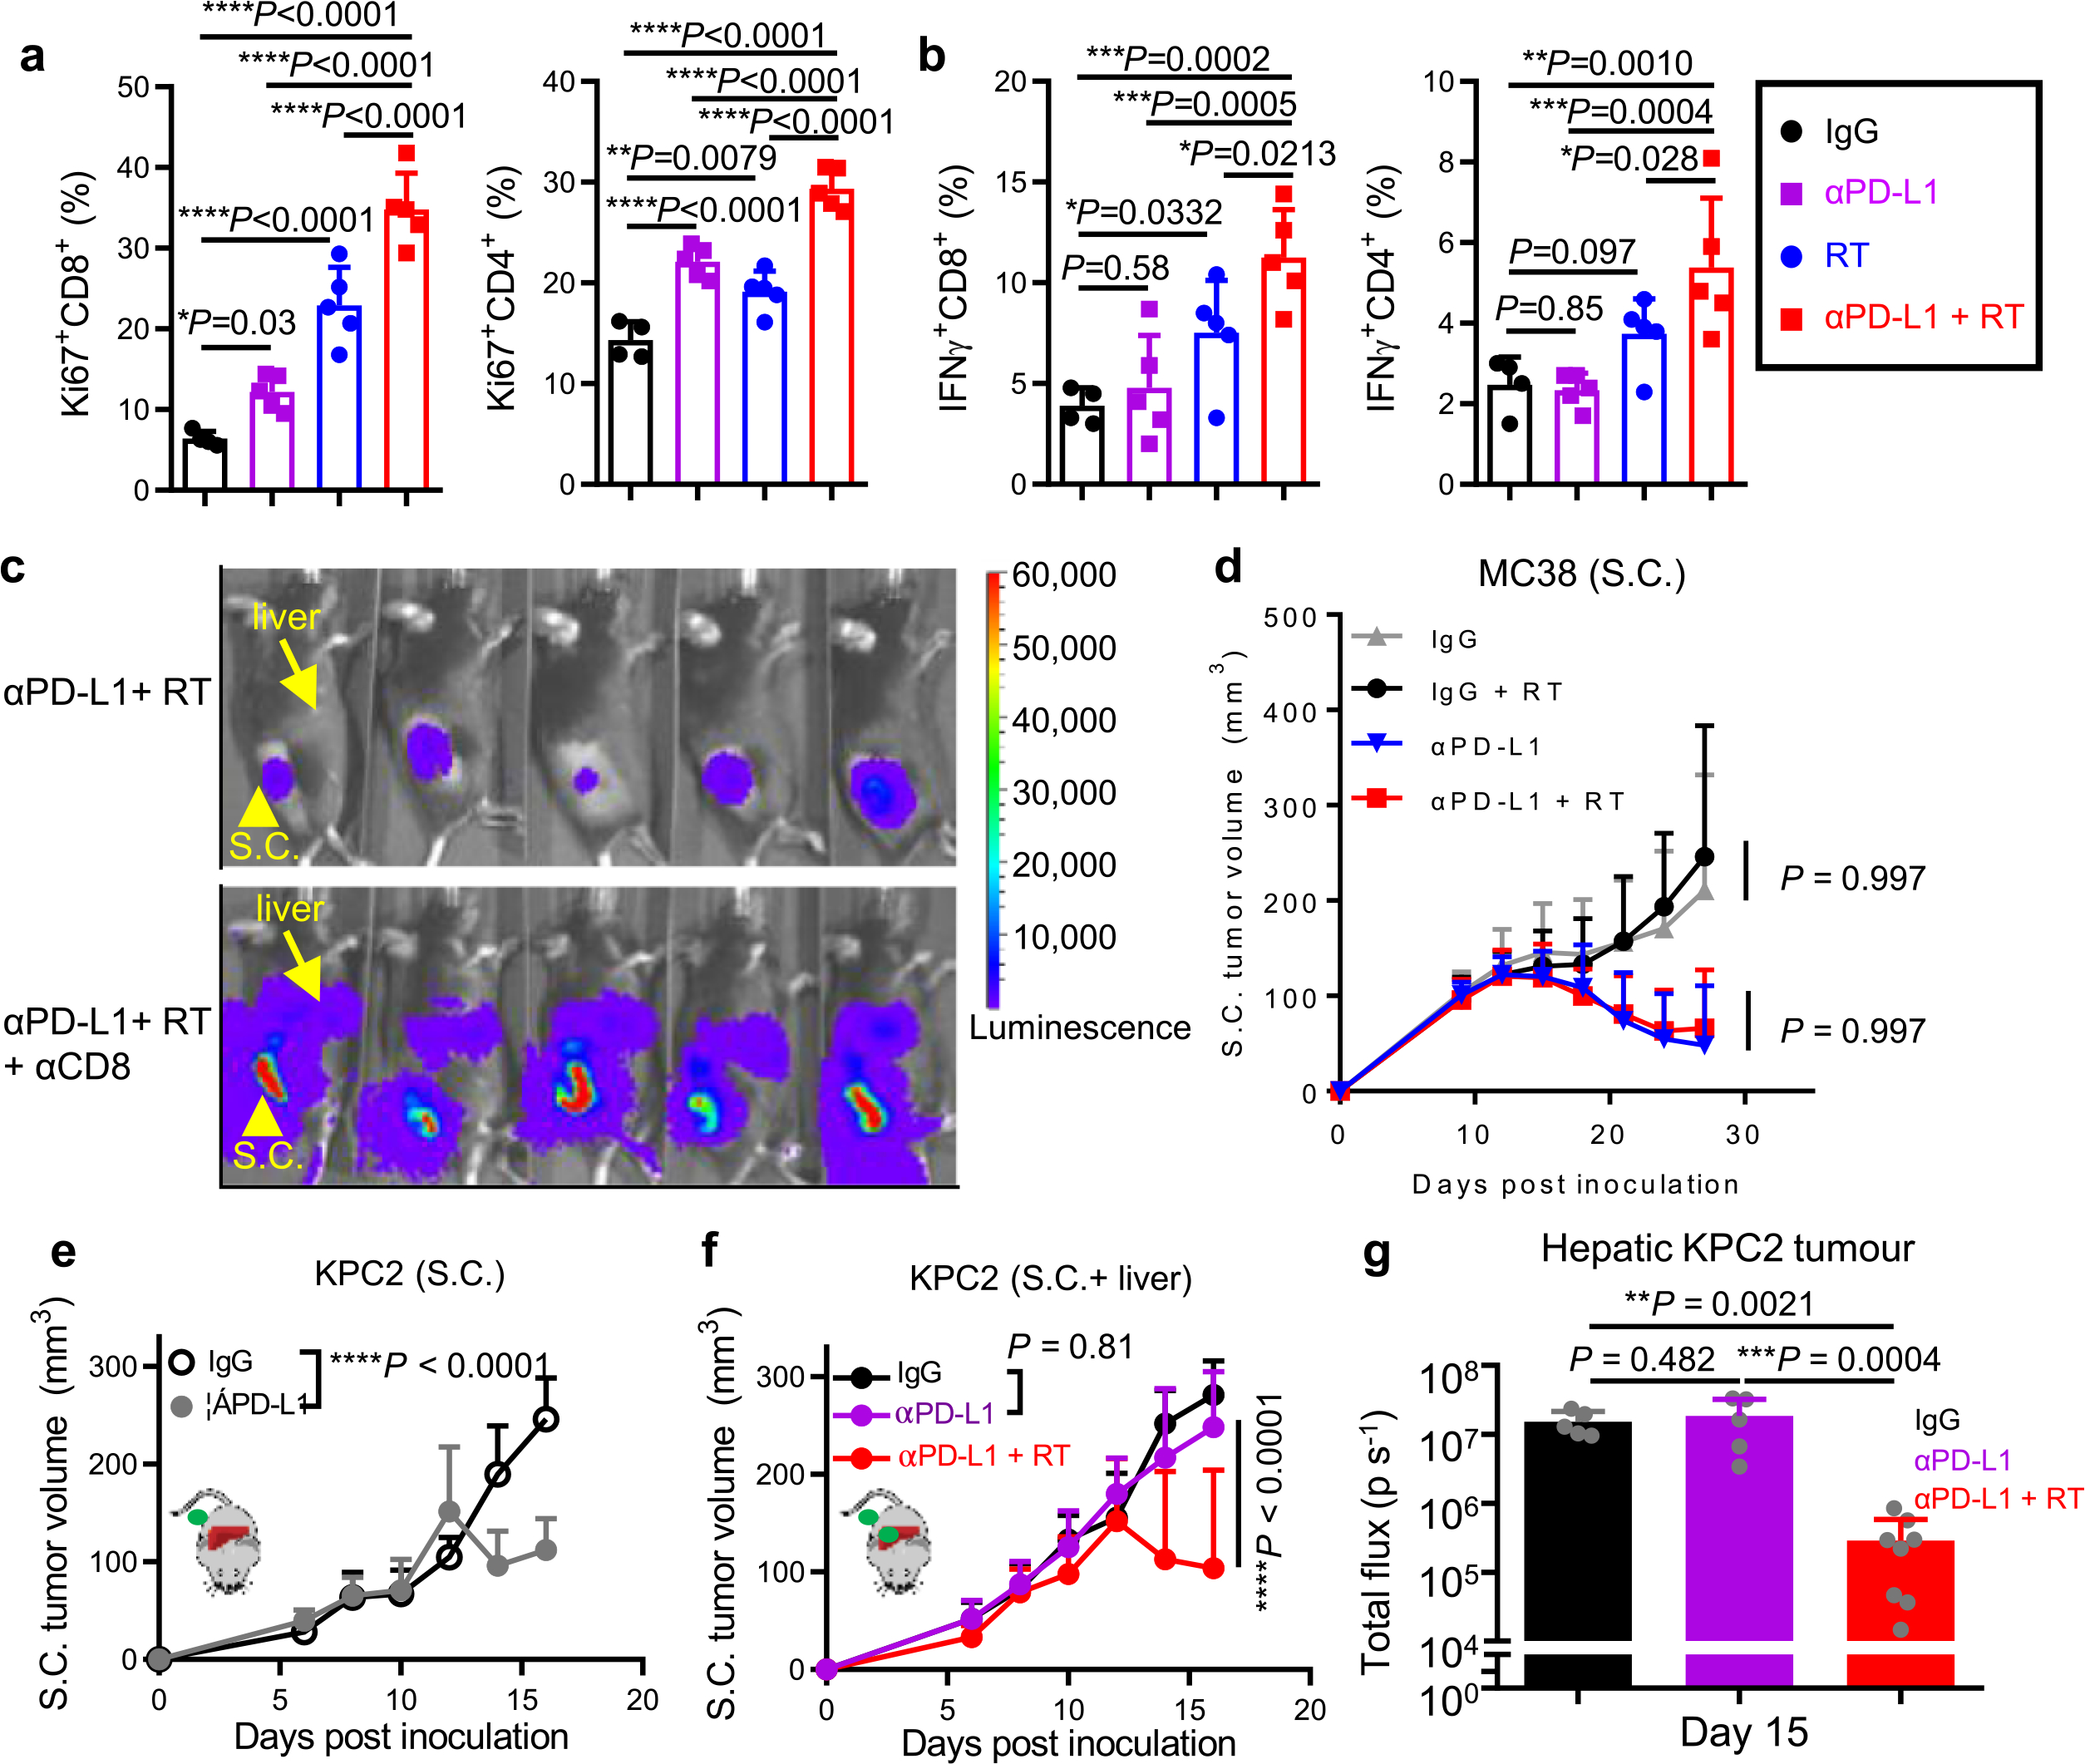
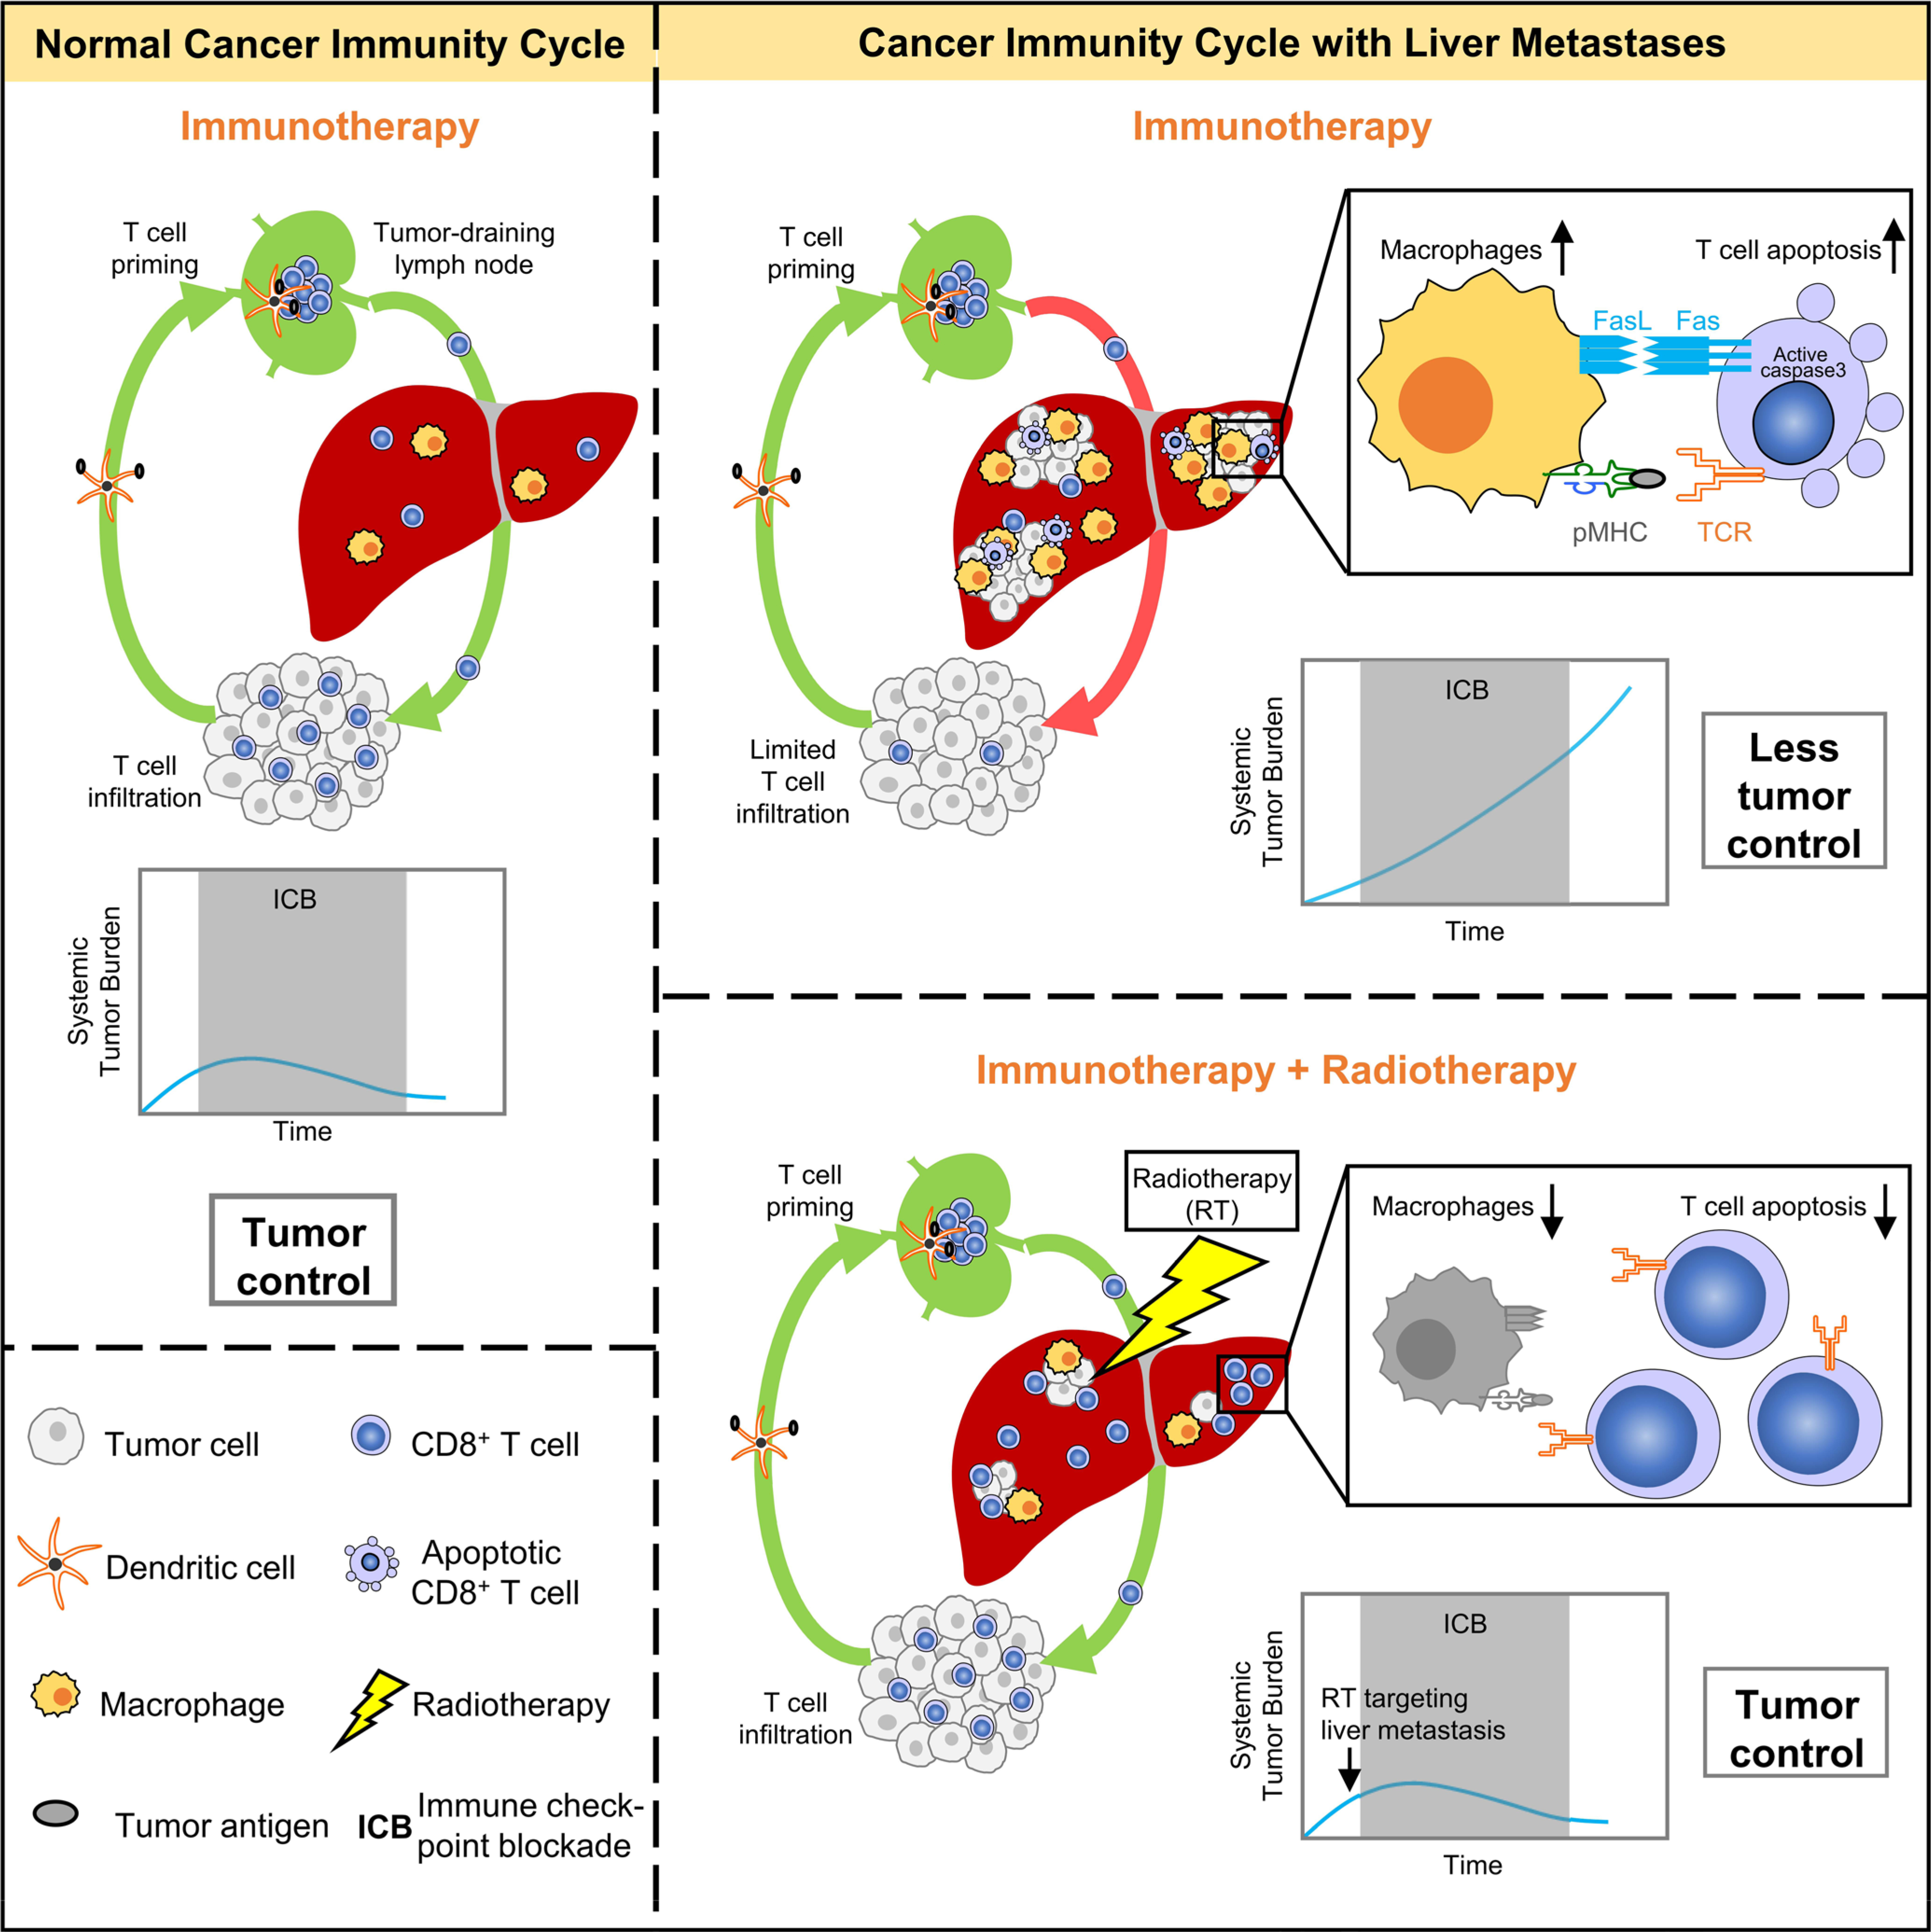
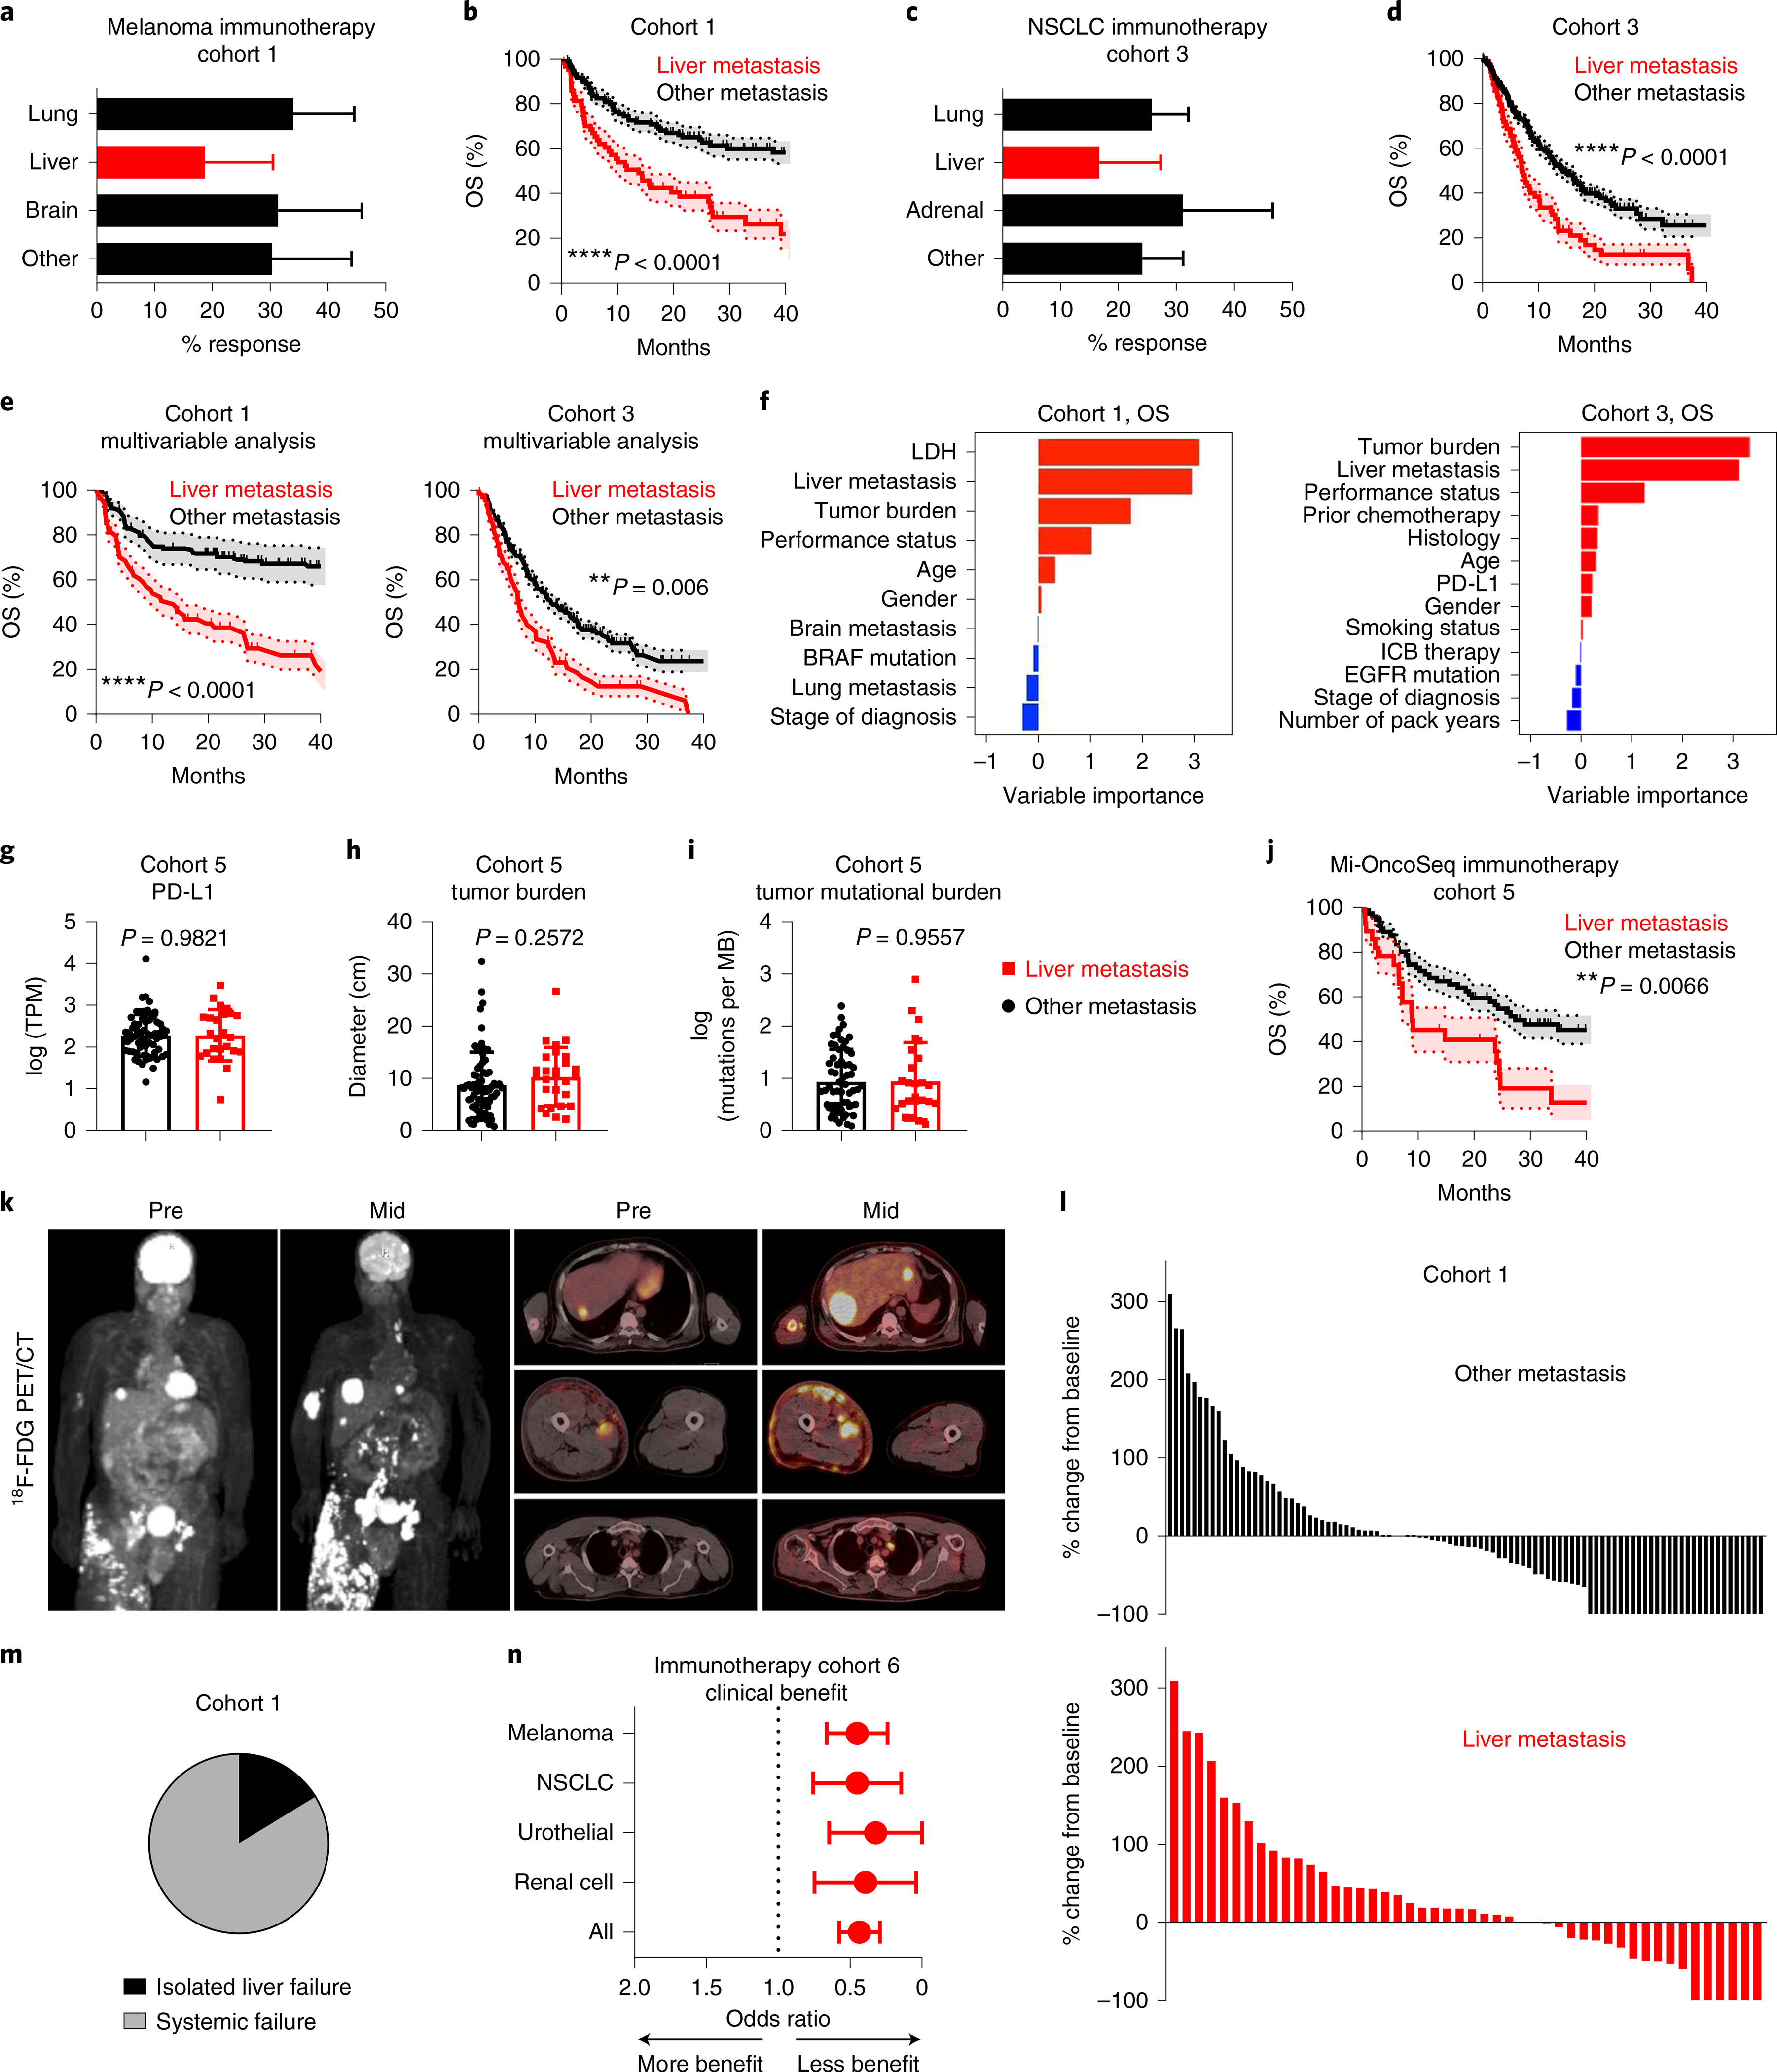
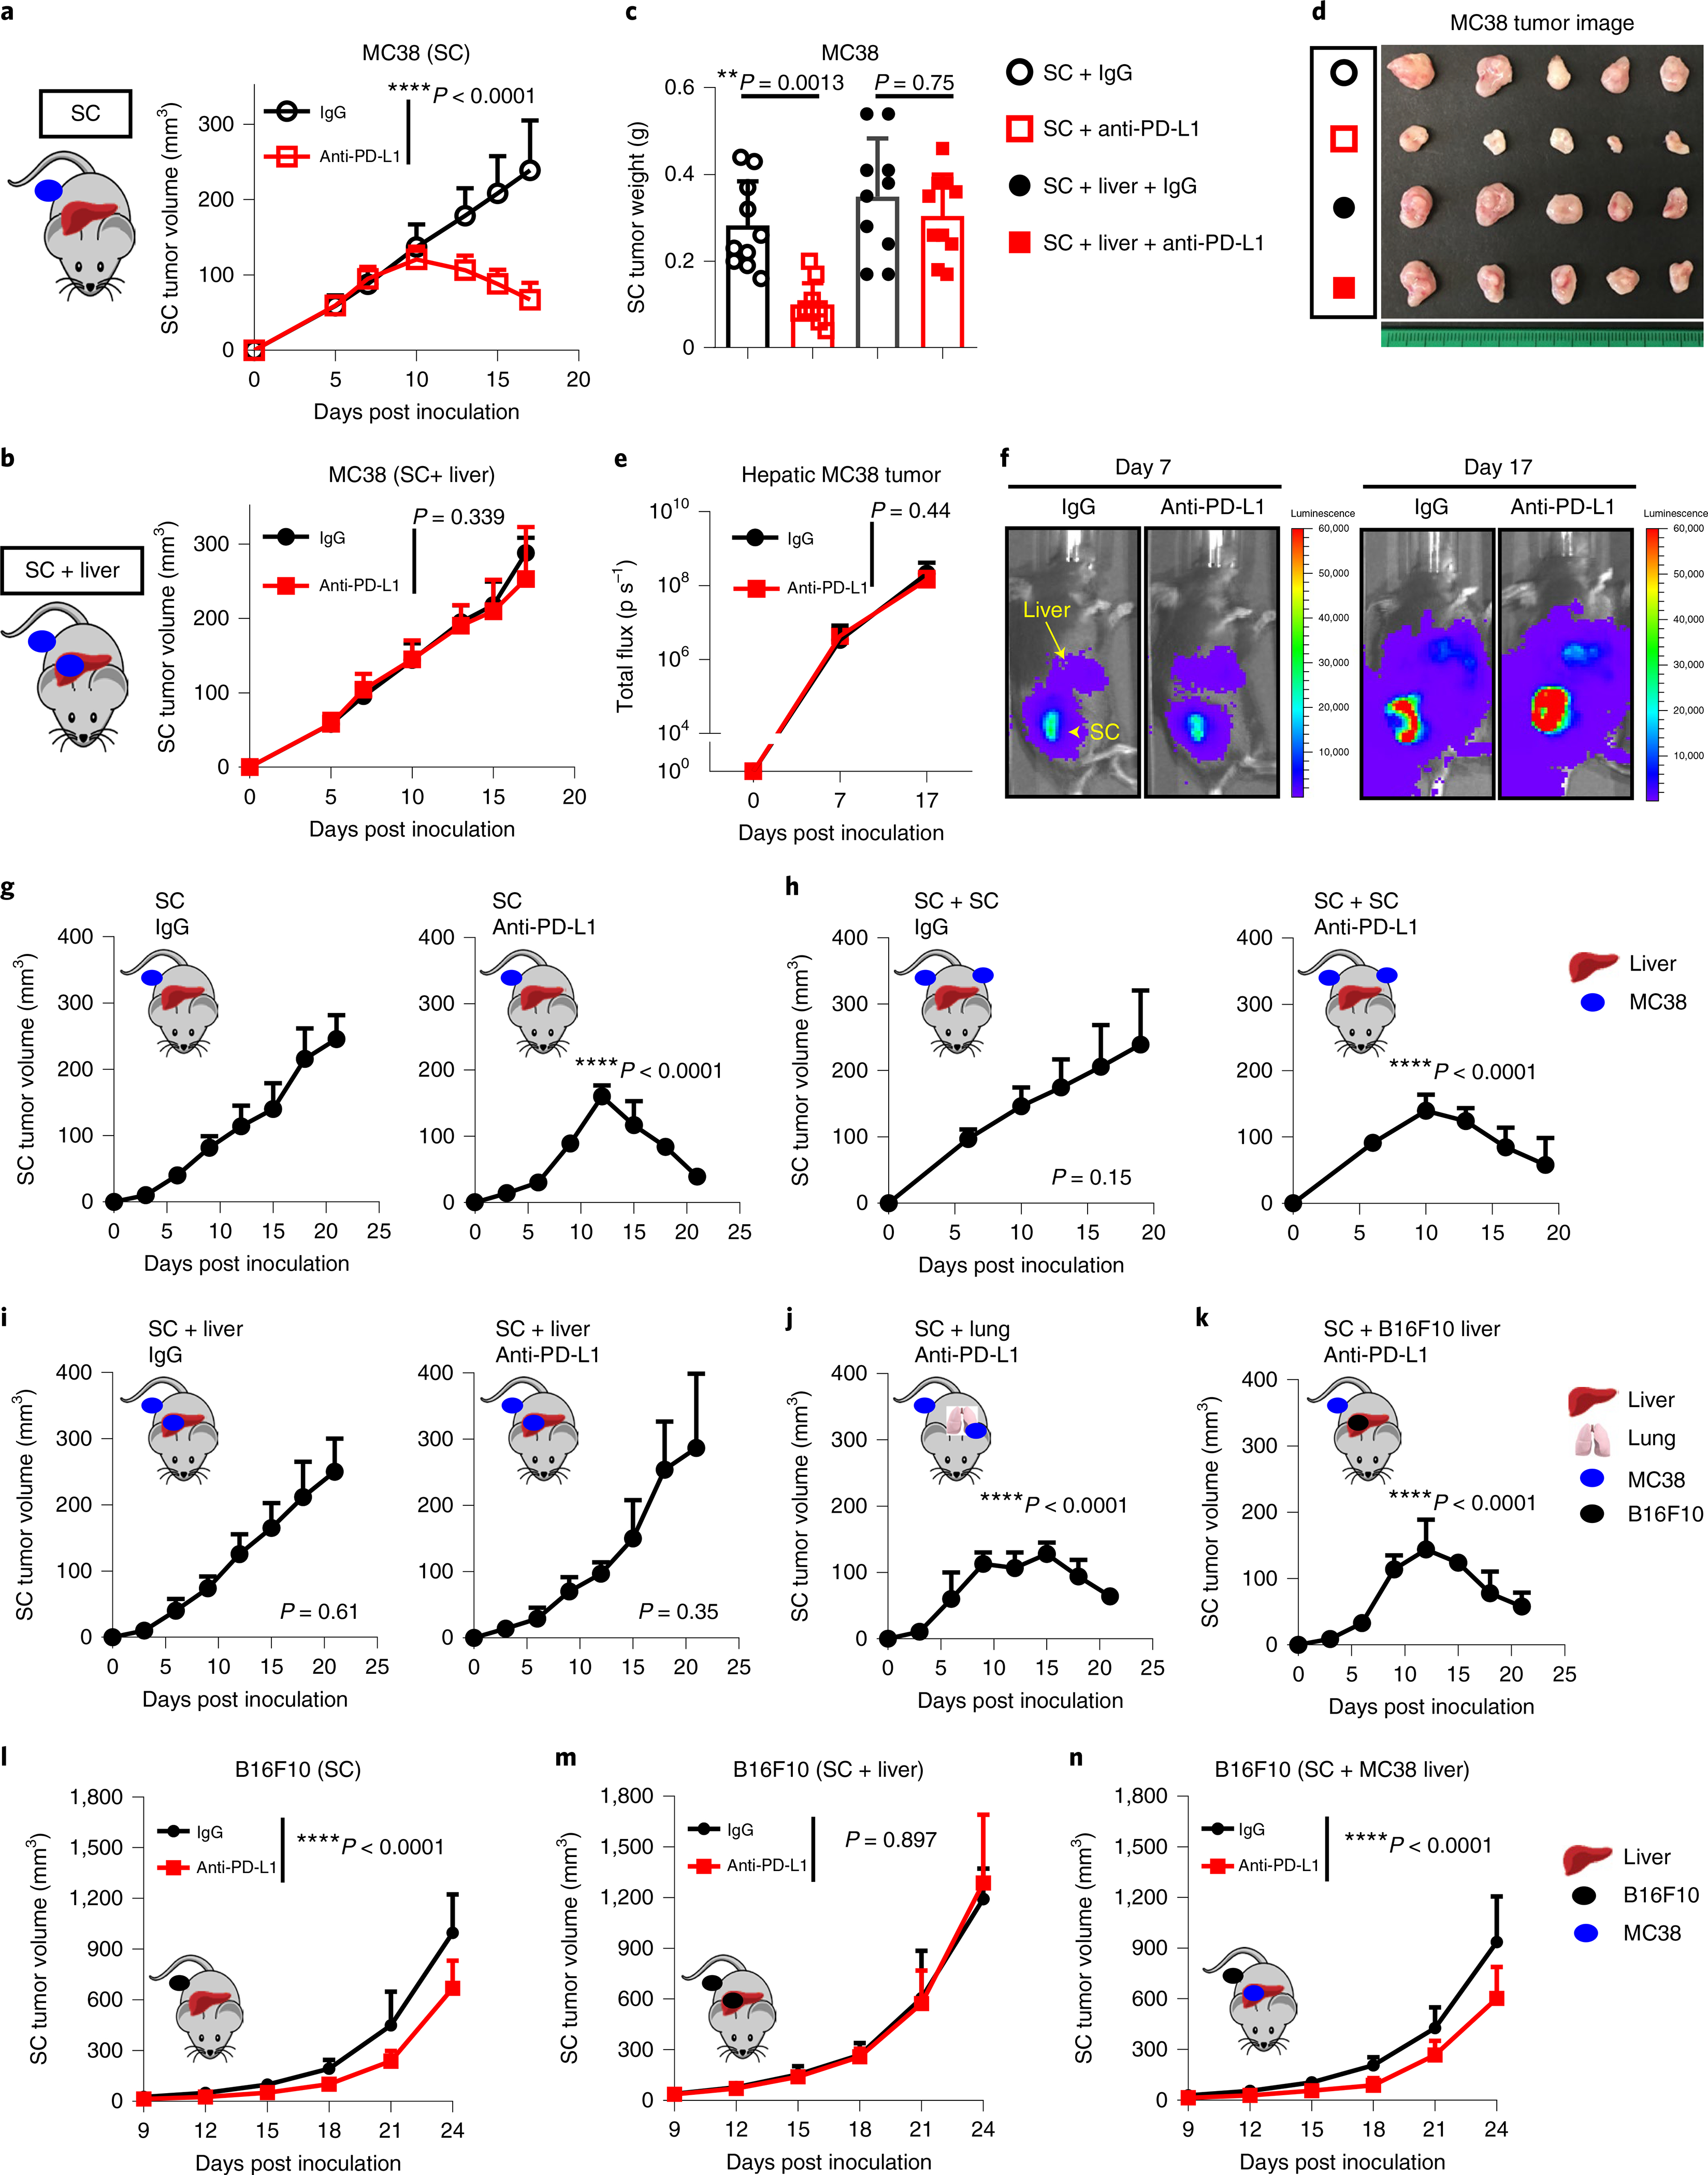
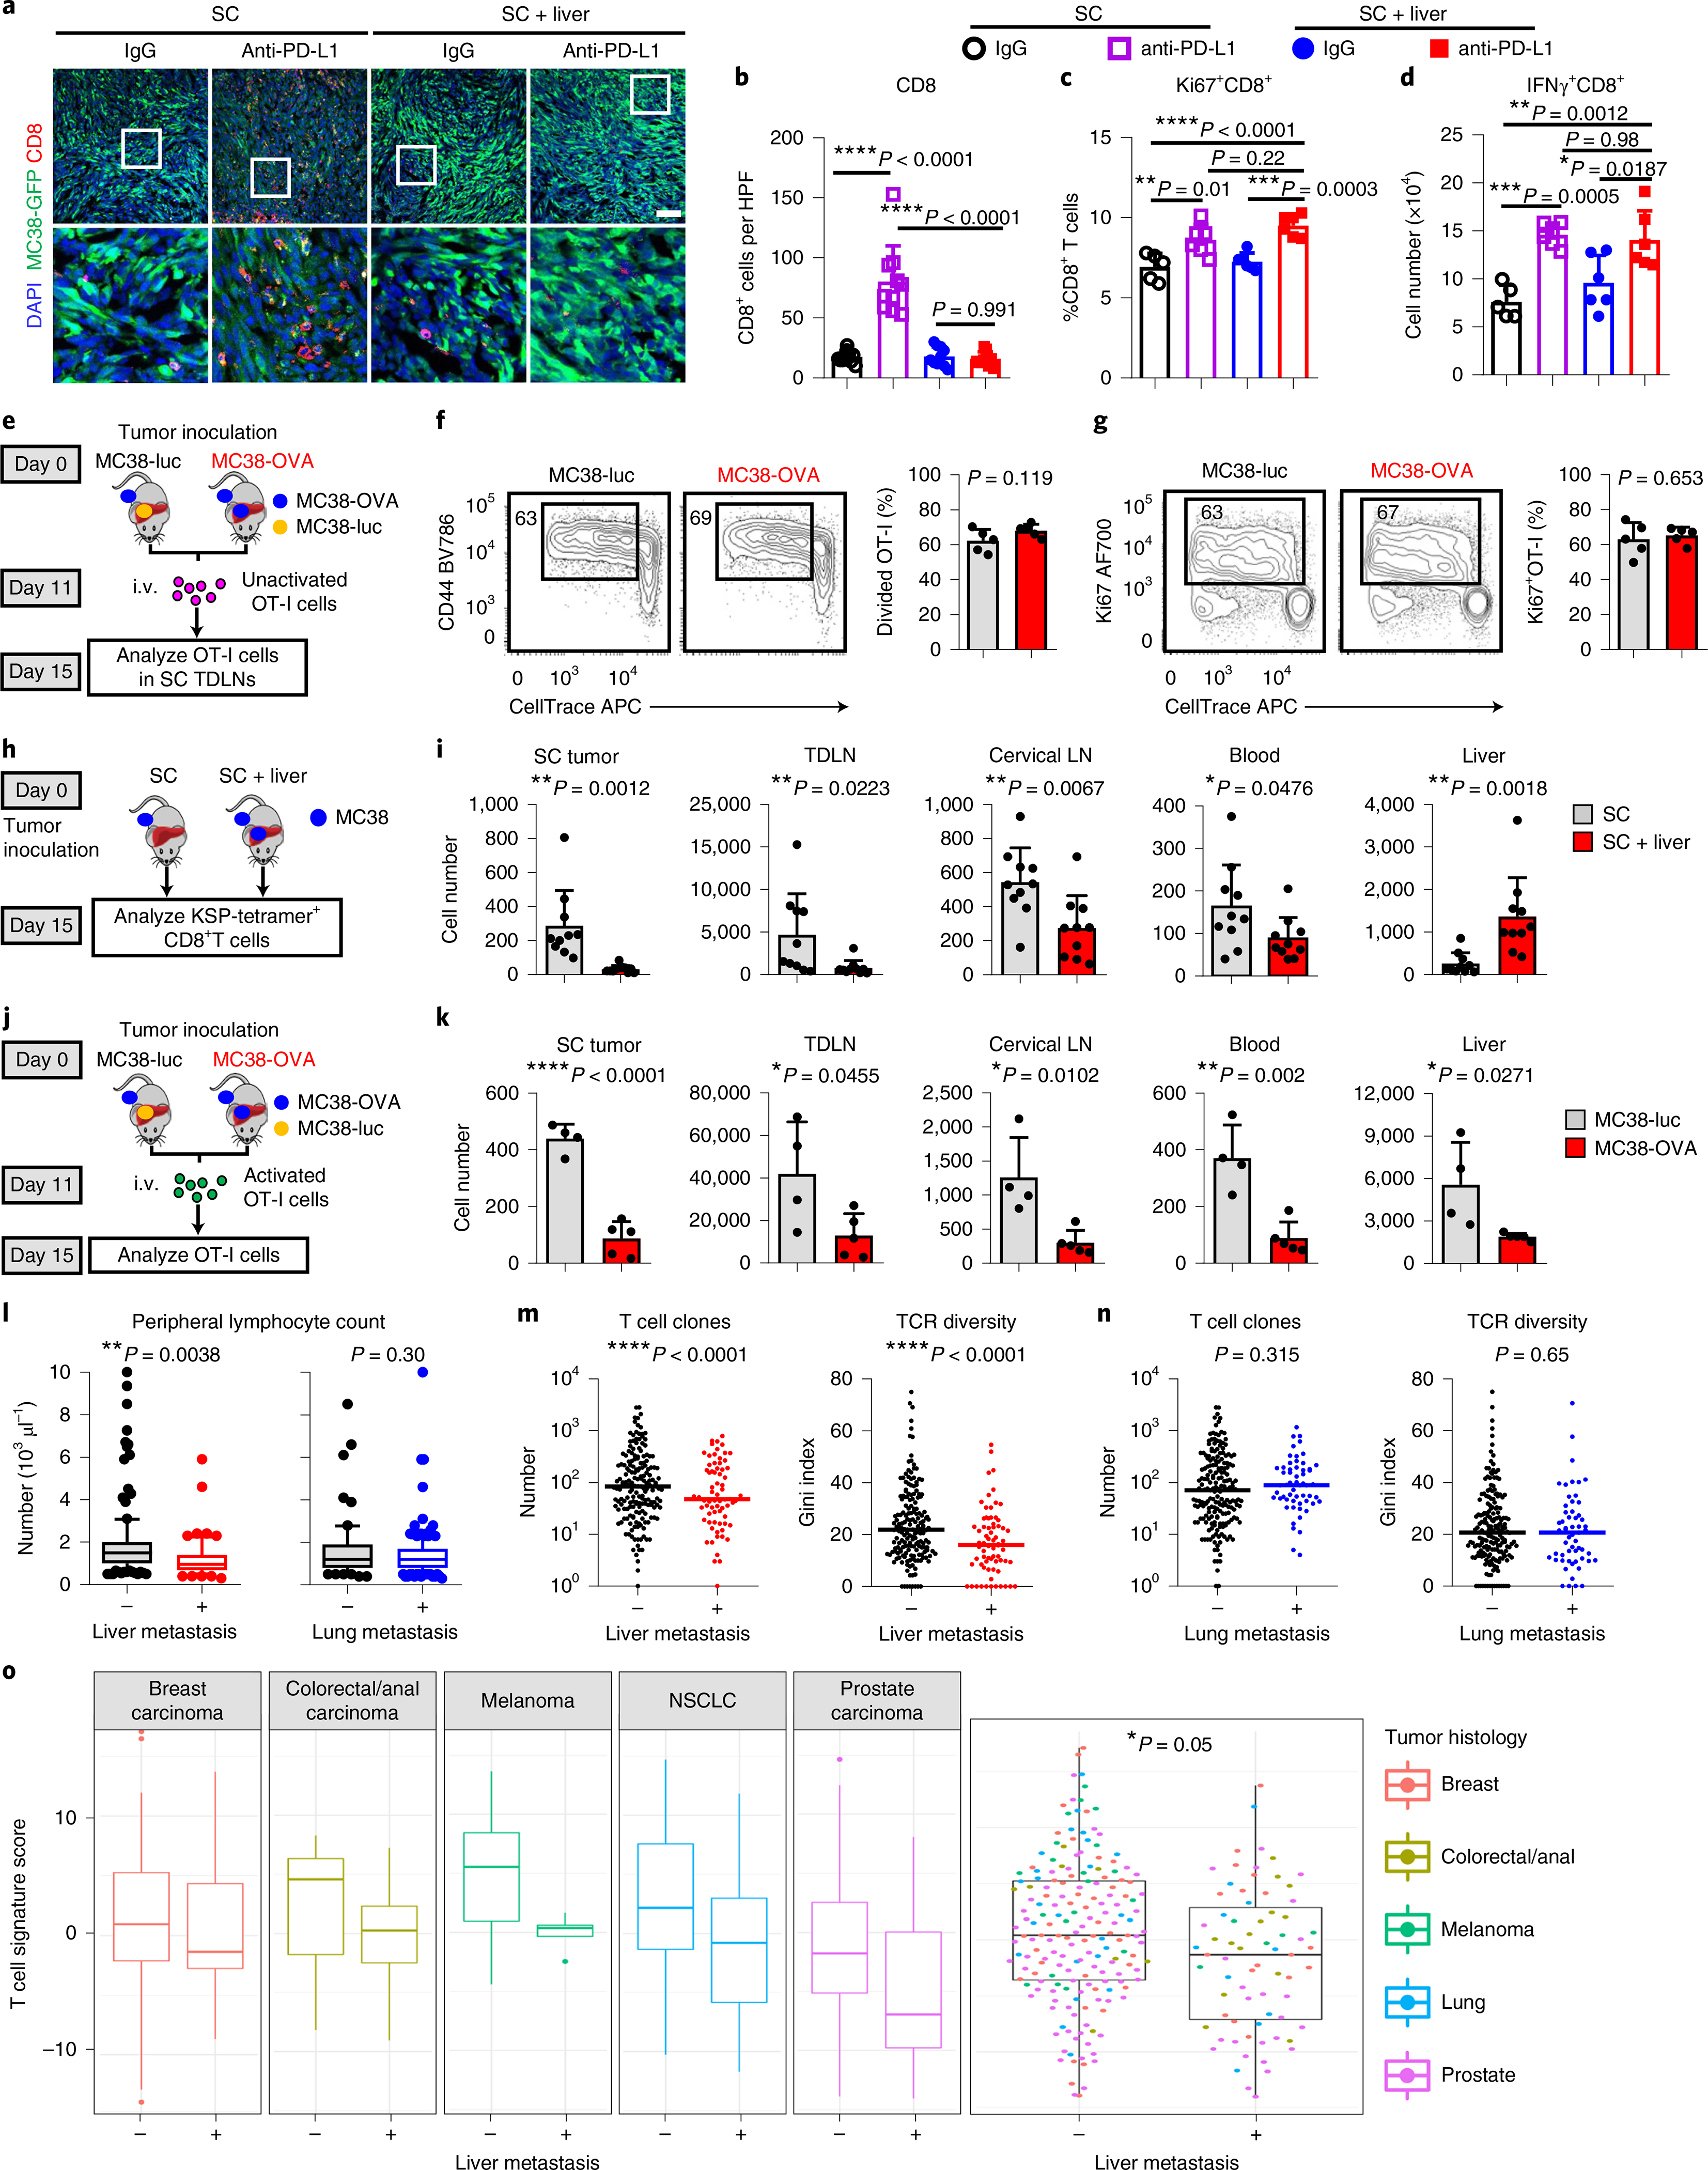
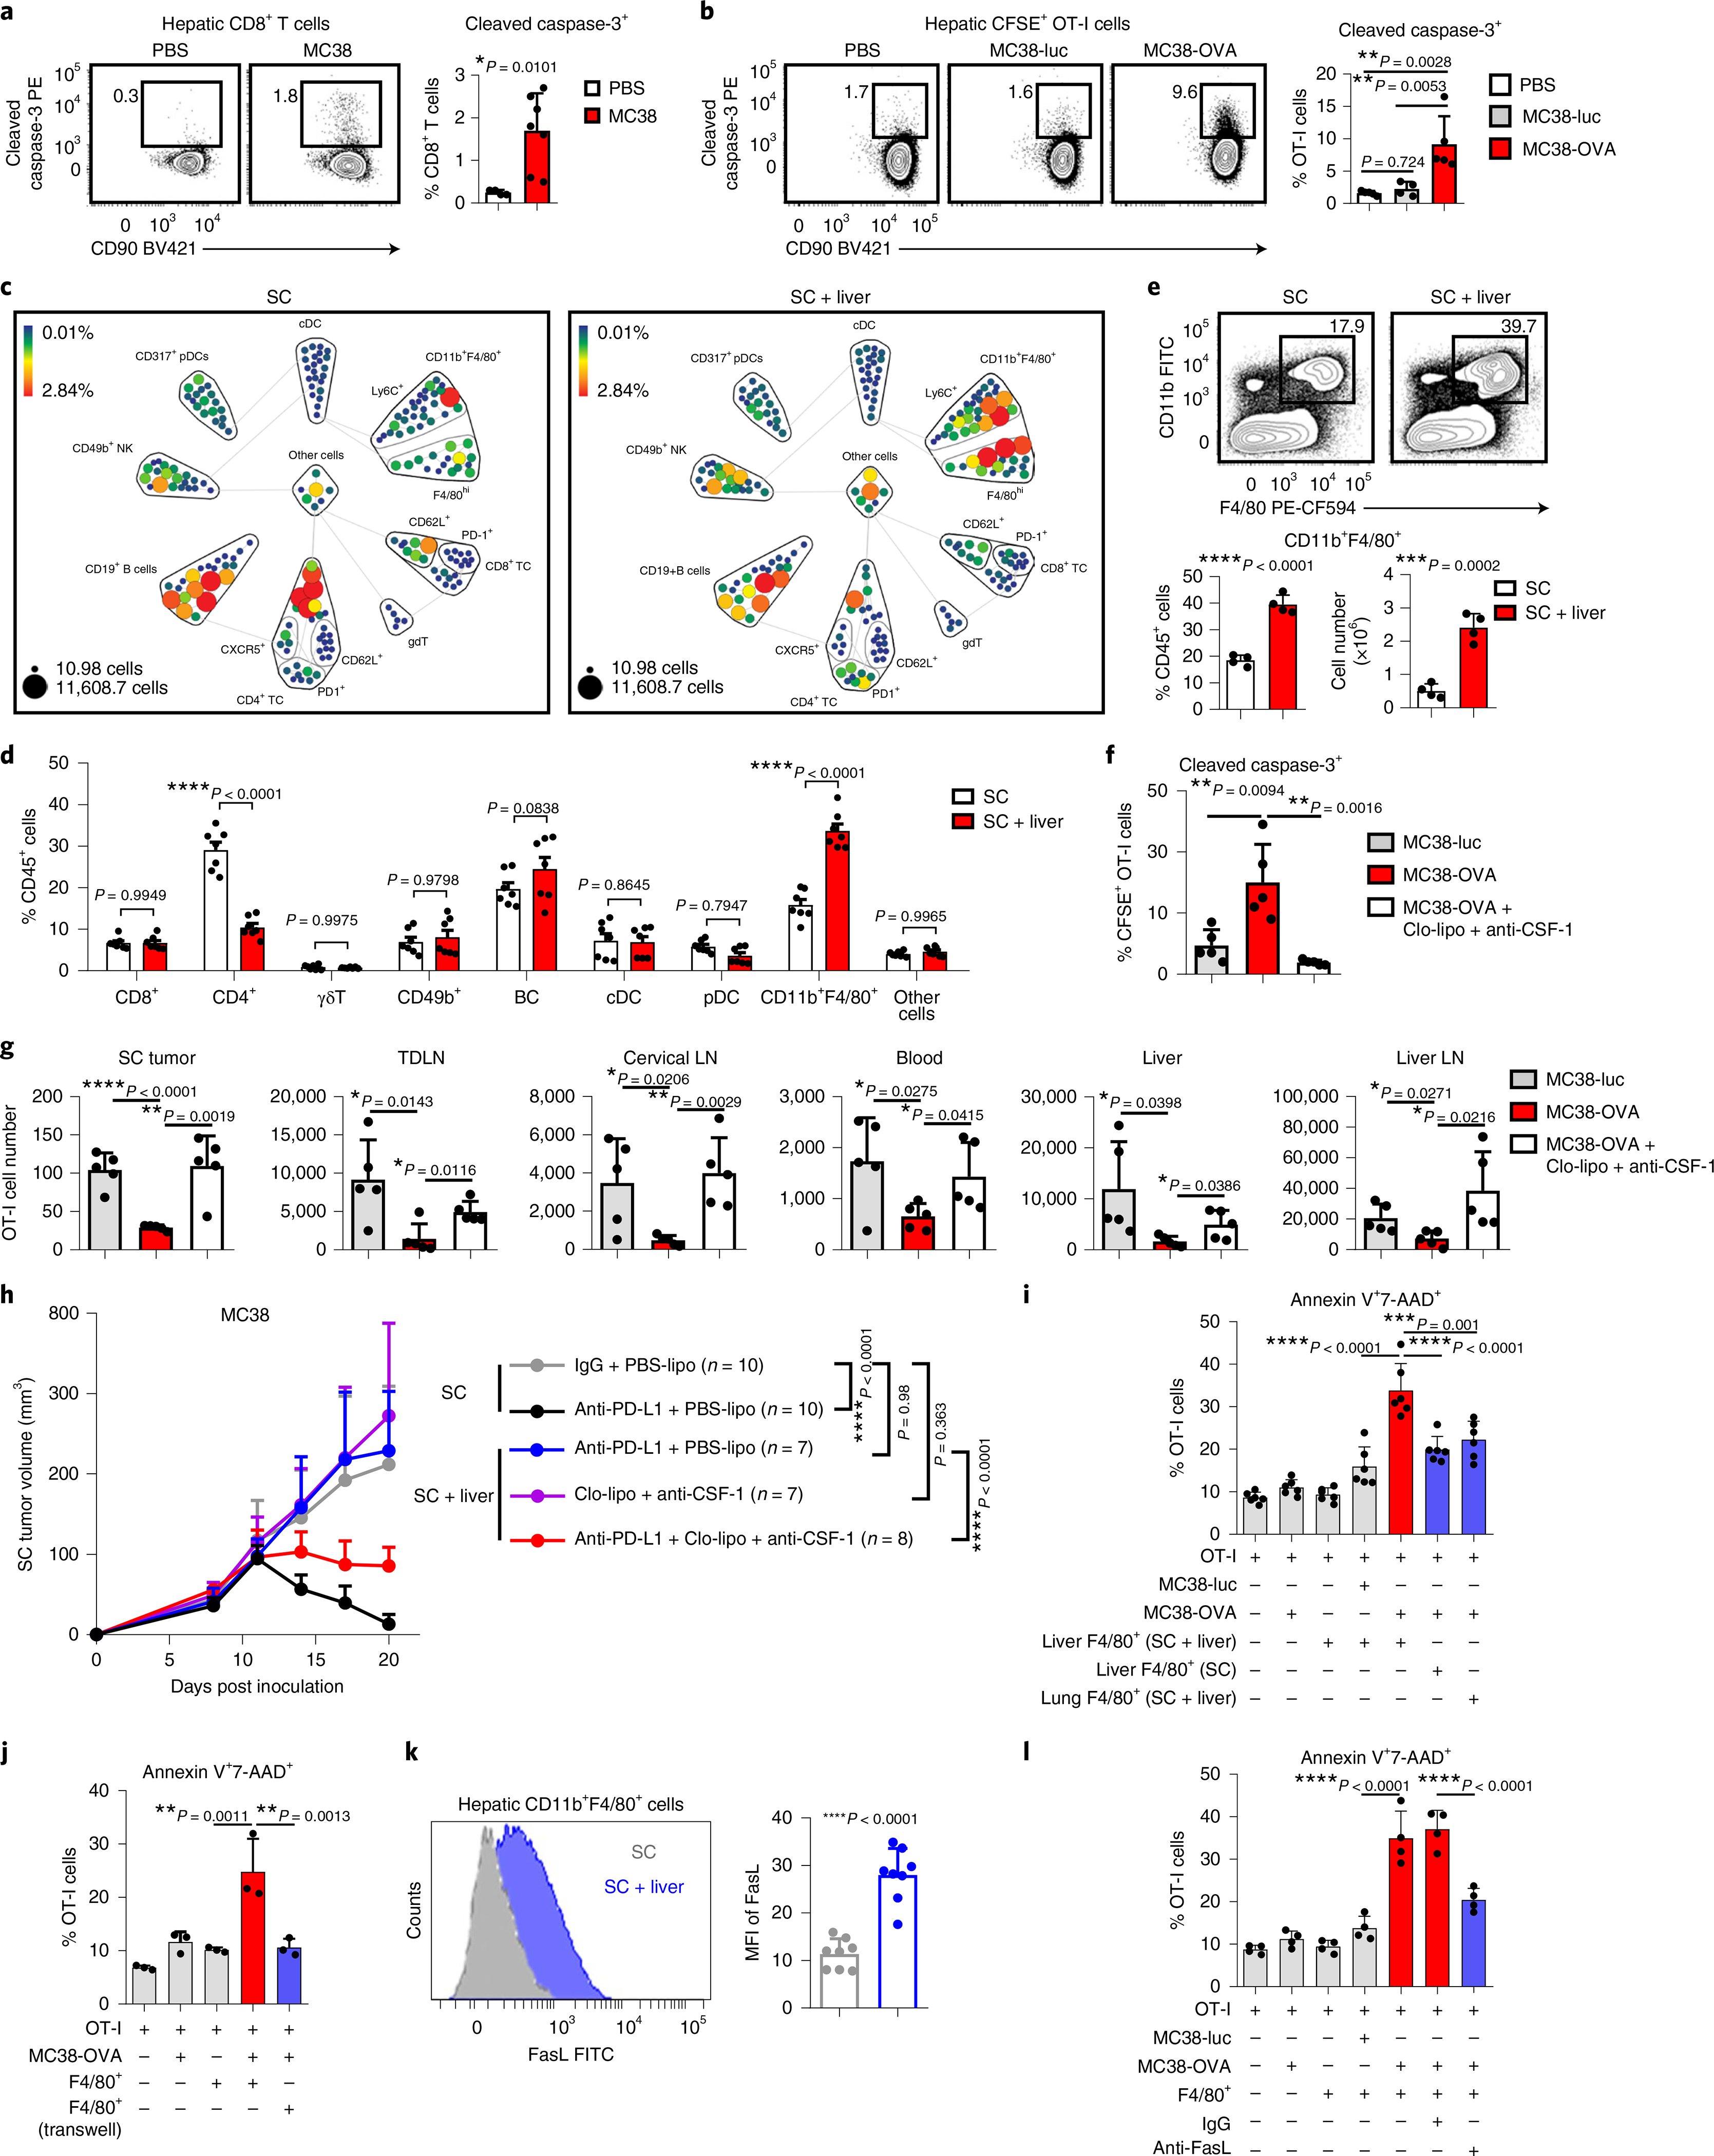
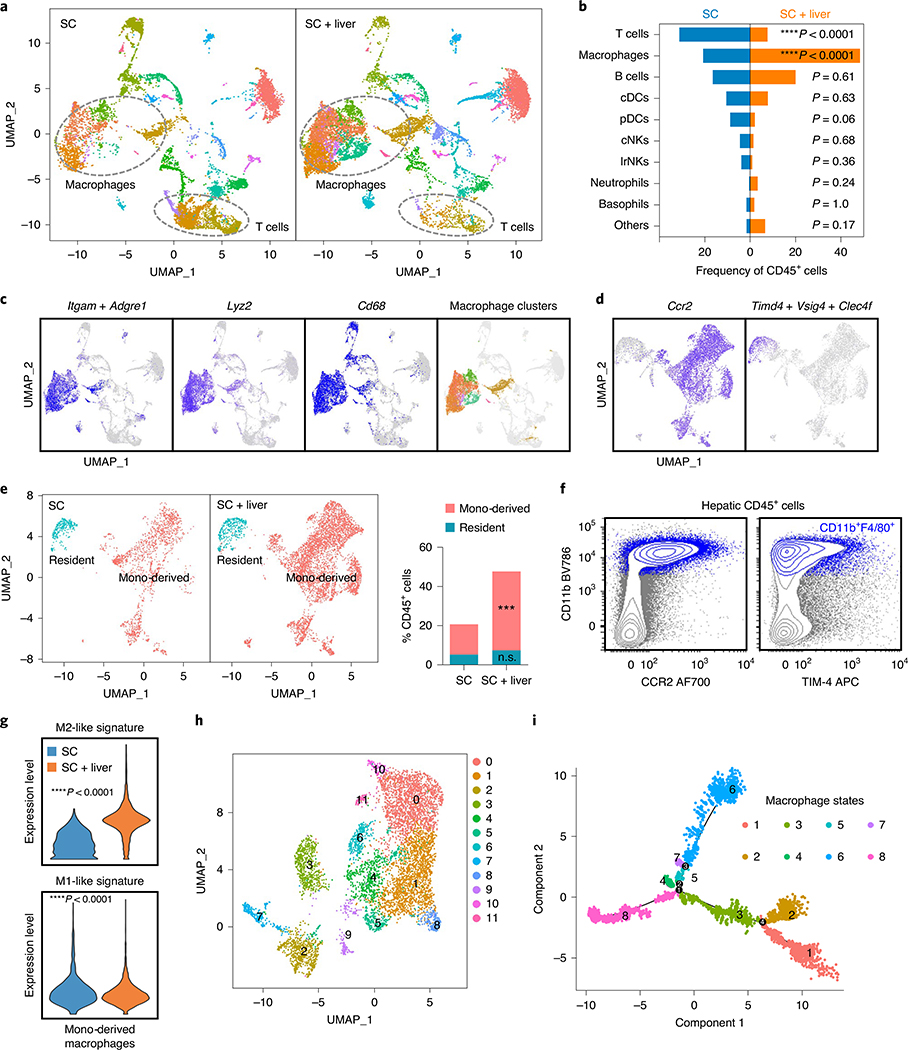
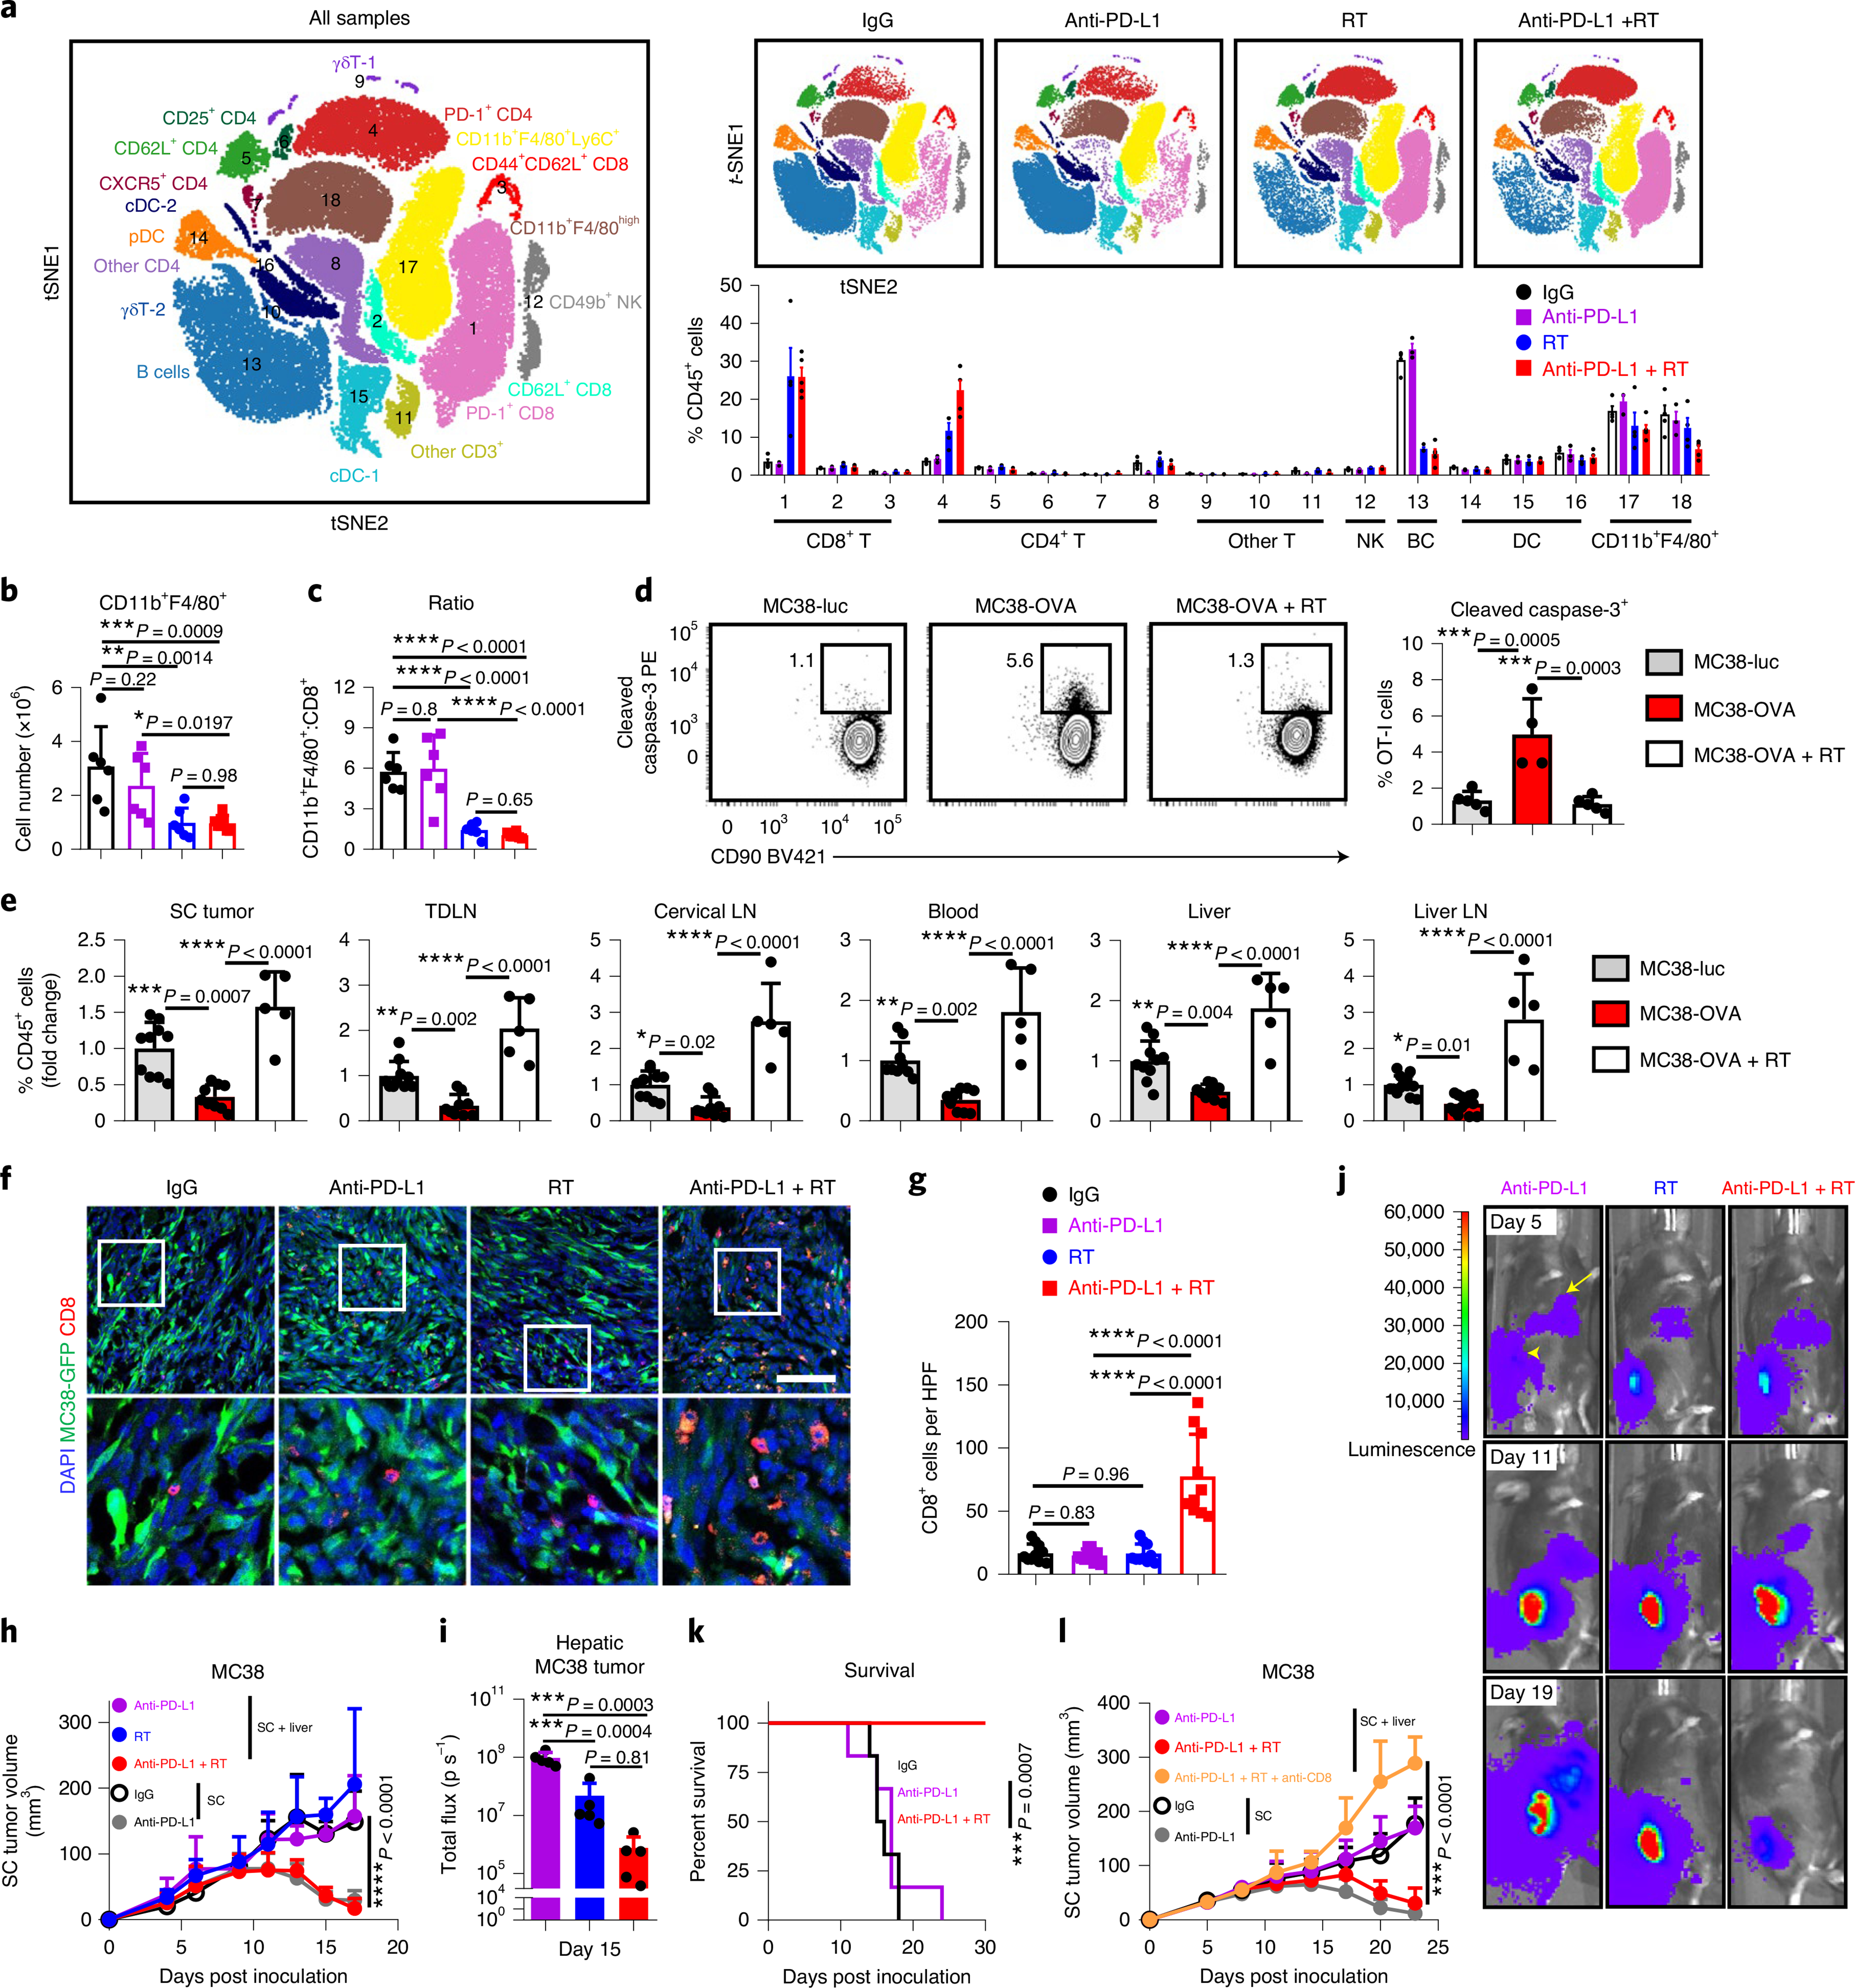
Metastasis is the primary cause of cancer mortality, and cancer frequently metastasizes to the liver. It is not clear whether liver immune tolerance mechanisms contribute to cancer outcomes. We report that liver metastases diminish immunotherapy efficacy systemically in patients and preclinical models. Patients with liver metastases derive limited benefit from immunotherapy independent of other established biomarkers of response. In multiple mouse models, we show that liver metastases siphon activated CD8+ T cells from systemic circulation. Within the liver, activated antigen-specific Fas+CD8+ T cells undergo apoptosis following their interaction with FasL+CD11b+F4/80+ monocyte-derived macrophages. Consequently, liver metastases create a systemic immune desert in preclinical models. Similarly, patients with liver metastases have reduced peripheral T cell numbers and diminished tumoral T cell diversity and function. In preclinical models, liver-directed radiotherapy eliminates immunosuppressive hepatic macrophages, increases hepatic T cell survival and reduces hepatic siphoning of T cells. Thus, liver metastases co-opt host peripheral tolerance mechanisms to cause acquired immunotherapy resistance through CD8+ T cell deletion, and the combination of liver-directed radiotherapy and immunotherapy could promote systemic antitumor immunity.


Conflict of interest statement

Competing interests

J.Y., M.D.G., S.L., Y.S., S.N.J., J.E.C., S.M.R., J.J.W., X.L., Z.C., J.Z., Y.B., L.J., A.T., J.S., R.K.A., M.S., B.S.R., F.S., S.P.N., X.C., S.W., W.S., L.V., C.M., M.A.M., C.A.S., K.C., I.K., V.T.M., T.S.L., N.R., F.W., A.M.C. and M.C. report no conflicts. A.Q. has research funding from Merck and Clovis. I.E.N. serves as a consultant for Endectra. A.A. serves as a consultant for Merck, AstraZeneca, Bristol-Myers Squibb and Pfizer/EMD Serono. A.A. receives research funding through the University of Michigan from Merck, Genentech, Prometheus Laboratories, Mirati Therapeutics, Roche, Bayer, Progenics, Astellas Pharma, Arcus Biosciences, AstraZeneca, Bristol-Myers Squibb and Clovis Oncology. C.D.L. serves as a consultant for Immunocore. C.D.L receives travel, accommodations and expenses from Bristol-Myers Squibb and Immunocore. C.D.L. receives research funding from Bristol-Myers Squibb, Merck, Novartis and Dynavax. W.Z. has served as a scientific advisor for Cstone, Oncopia and Hengenix.

Figures

Extended Data Fig. 1 |
Extended Data Fig. 1 |. Liver metastasis correlates with diminished immunotherapy efficacy in cancer patients.
a Best objective response rates in metastatic melanoma patients treated with targeted therapy stratified by baseline disease distribution. Chi-squared for liver metastasis P = 0.63, mean ± SD, liver n = 37, brain n = 23, lung n = 46. b PFS in melanoma patients treated with immunotherapy stratified by liver metastasis. Log-rank test, HR = 2.76, survival±SE, liver n = 64, other n = 118. c OS in melanoma patients treated with targeted therapy stratified by liver metastasis. Log-rank test, HR = 0.557, liver n = 37, other n = 60. d PFS in melanoma patients treated with targeted therapy stratified by liver metastasis; log-rank test, HR = 1.0670, survival±SE, liver n = 37, other n = 60. e Best objective response rates in metastatic nSCLC patients who received chemotherapy stratified by baseline disease distribution. Chi-squared, P = 0.83, mean ± SD, liver n = 43, adrenal n = 39, lung n = 140. f OS in nSCLC patients treated with chemotherapy stratified by liver metastasis; log-rank test, HR = 0.960, survival±SE, liver n = 43, other n = 106. g Forest plot for OS in indicated immunotherapy-treated melanoma patient subset (Cohort 1). Log-rank test, HR, n, and P-value indicated, mean ± SD. h OS in melanoma patients with (n = 55) and without (n = 95) liver metastases treated with immunotherapy in the first-line setting. Log-rank test, HR = 3.564, survival±SE. i OS in melanoma patients with less than the median tumour burden treated with immunotherapy stratified by presence (n = 36) or absence (n = 92) of liver metastasis. Log-rank test, HR = 2.644, survival±SE. j OS in melanoma patients with only liver metastases (n = 15) versus only lung metastases (n = 15). Log-rank test, HR = 3.616; survival±SE. k Forest plot for OS in indicated immunotherapy-treated nSCLC patient subset (Cohort 3). Log-rank test, HR, n, and P-value indicated, mean ± SD. l OS in nSCLC patients treated with immunotherapy in the first line setting stratified by presence (n = 22) or absence (n = 95) of liver metastasis. Log-rank test, HR = 1.577, survival±SE. m OS in nSCLC patients with less than the median tumour burden treated with immunotherapy stratified by presence (n = 25) or absence (n = 115) of liver metastasis. Log-rank test, HR = 2.440; survival±SE. n OS in nSCLC patients wild type EGFR stratified by presence (n = 64) or absence (n = 188) of liver metastasis. Log-rank test, HR = 1.895, survival±SE. o Tumoural PD-L1 staining score in metastatic nSCLC patients (Cohort 3) with (n = 34) and without (n = 114) liver metastases. Unpaired two-tailed Student’s t-test, mean ± SD. p Inverse probability weighted multivariable analysis of PFS in melanoma and nSCLC patients receiving immunotherapy stratified by liver metastasis; Log-rank test, HR = 1.13 and 2.06, respectively, mean ± SD, melanoma liver n = 61, melanoma other n = 102, nSCLC liver n = 63, nSCLC other n = 172. q Variable importance quantification from random forest multivariable modeling of PFS in metastatic melanoma and nSCLC patients receiving immunotherapy (Cohorts 1,3). r Inverse probability weighted multivariable analysis of OS in Cohort 5 stratified by presence of liver metastases. Log-rank test, HR = 2.15, mean ± SD, liver n = 25, other n = 57. s Frequency of relapse in indicated location in melanoma patients with liver metastases receiving immunotherapy. Count displayed. t Frequency of relapse in indicated location in nSCLC patients with liver metastases receiving immunotherapy. Count displayed. u Random effect meta-regression modeling of correlation between anti-PD-1 overall response rates in different histologies versus metastatic tropism to liver or lung. β = 4.6% per 20 liver metastasis increase; β = −0.24% per 20 lung metastasis increase. Mixed effect model, median predicted ORR and 95% confidence intervals, n per Supplementary Table 7.
Extended Data Fig. 2 |
Extended Data Fig. 2 |. Liver metastasis diminishes immunotherapy efficacy in mice.
a Schematic for establishing experimental liver metastasis by intrasplenic inoculation. b Schematic for establishing experimental liver tumours by intrahepatic inoculation. c Subcutaneous tumour growth in mice bearing liver tumours established by intrahepatic inoculation, with and without anti-PD-L1 therapy. Two-way AnOVA, mean ± SD, n = 6 per group. d Bioluminescent quantification of secondary tumour burden of a liver tumour from mouse bearing a subcutaneous tumour and liver tumour (as in Fig. 2i) versus the contralateral subcutaneous tumour in mice bearing two subcutaneous tumours (as in Fig. 2h) by bioluminescence. Quantification on day 7 prior to initiation of anti-PD-L1. Unpaired two-tailed Student’s t-test, mean ± SD, n = 10 per group. e, f Subcutaneous MC38 tumour volume (e) and weight (f) in mice with and without liver tumours in which a limited number (1×10⁶) of tumour cells were inoculated subcutaneously. Weight analysed 4 weeks after tumour inoculation. (e) two-way AnOVA; (f) unpaired two-tailed Student’s t-test, mean ± SD, n = 5 per group. Data are representative of at least two independent experiments (c-f).
Extended Data Fig. 3 |
Extended Data Fig. 3 |. Liver metastasis induces systemic loss of antigen-specific T cells.
a Subcutaneous tumour CD8+ T cell, IFnγ+CD8+ T cell and Ki67+CD8+ T cell number per gram tumour. Analysed 7 days post anti-PD-L1 treatment initiated. One-way AnOVA with Tukey’s correction, mean ± SD, IgG n = 5, others n = 8. b Representative plot for H-2Kb MuLV p15E tetramer (KSP-tetramer) staining of MC38 tumour-specific CD8+ T cells in S.C. tumour samples. c, d Schematic for unactivated OT-I cell adoptive cell transfer (c) and absolute number of CD45.1+CD8+ OT-I T cells in indicated compartments of mice bearing MC38-Luc or MC38-OVA liver tumour (d). Analysed 14 days after tumour inoculation. Unpaired two-tailed Student’s t-test, mean ± SD, n = 10 per group. e, f Schematic (e) and quantification (f) of activated OT-I-cell distribution 2 days after adoptive cell transfer into mice bearing both subcutaneous and liver MC38-OVA tumour. Displayed as relative cell number to hepatic OT-I cell number. One-way AnOVA, *P = 0.0247, **P = 0.002, ***P = 0.0003, ****P < 0.0001, mean ± SD, n = 6 per group. g, h Representative flow plots (g) and quantification (h) of activated OT-I-cell distribution 4 days after adoptive cell transfer into MC38-OVA tumour bearing mice with MC38-Luc (n = 4) or MC38-OVA (n = 5) liver tumour (as shown in Fig. 3j); unpaired two-tailed Student’s t-test, mean ± SD. i, j Schema (i) and quantification (j) of activated OT-I-cell distribution 4 days after adoptive cell transfer into subcutaneous MC38-OVA tumour bearing mice with MC38-Luc lung tumour or MC38-OVA lung tumour. Displayed as relative cell number (normalized to MC38-Luc group). Unpaired two-tailed Student’s t-test, nS, not significant (P-value: liver, 0.37; lung, 0.42; S.C. tumour, 0.09; spleen, 0.91; tdLn, 0.74; cerLn, 0.26; liverLn, 0.22; lungLn, 0.45; blood, 0.36), mean ± SD, n = 5 per group. k Flow cytometry histogram depicting expression of LFA-1 (left) and CD44 (right) on in vitro activated OT-I cells. l Flow cytometry plots depicting expression of LFA-1 (left) and CD44 (right) expression on in vivo activated OT-I cells isolated from subcutaneous MC38-OVA tumour-draining Lns or non-draining Lns. Analysed 3 days after adoptive transfer. m Flow cytometry histogram depicting expression of LFA-1 (upper) and CD44 (bottom) on tumour specific KSP-tetramer+CD8+a cells (green) in the liver. n CFSE+CD8+OT-I cell number per gram liver tissue. OT-I cells were adoptively transferred 1–2 days after anti-ICAM-1 or HA-se. Analyzed 24 hours after transfer. One-way AnOVA, mean ± SD, control n = 5, HA-se n = 6, anti-ICAM-1 n = 6. o Pre-treatment immune cell subset blood counts of nSCLC patients receiving immunotherapy (Cohort 3) with (n = 62) or without (n = 189) liver metastases. Unpaired two-tailed Student’s t-test, box and whiskers, box represents mean and IQR, whisker represents 10–90%, outliers represent min to max. p Pre-treatment blood immune cell subset counts of nSCLC patients receiving immunotherapy (Cohort 3) with (n = 187) or without (n = 62) lung metastases. Unpaired two-tailed Student’s t-test, box and whiskers, box represents mean and IQR, whisker represents 10–90%, outliers represent min to max. Data are representative of at least two independent experiments (a-n).
Extended Data Fig. 4 |
Extended Data Fig. 4 |. T cell phenotype and apoptosis in liver metastasis.
a Flow cytometry histograms showing phenotype of intrahepatic CD45+CD8+KSP-tetramer+ T cell (green) and total CD8 T-cell pool (blue) in mice with subcutaneous MC38 tumours (S.C., bottom) and subcutaneous and liver MC38 tumours (S.C. + liver, top). b Flow cytometry quantification of cleaved caspase-3 of OT-I cells in mice that bearing subcutaneous MC38-OVA tumour and sham (PBS, n = 11), MC38-Luc (n = 10) or MC38-OVA (n = 10) liver tumour. Unactivated CD45.1+CD45.2+OT-I cells were adoptive transferred and analysed 12 days after adoptive transfer. Data from two independent experiments were pooled. One-way AnOVA with Tukey’s correction, mean ± SD. c Frequency of KSP-tetramer+CD8+ cells expressing cleaved caspase-3 in liver of subcutaneous MC38 tumour-bearing mice with (n = 11) and without (n = 6) liver tumours. Unpaired two-tailed Student’s t-test, mean ± SD, data from two independent experiments were pooled. d Cell number of cleaved caspase-3 expressing OT-I cells from indicated location. OT-I cells were activated in vitro and labeled with CFSE, then intravenously transferred. Cells were analysed 4 days after transfer. One-way AnOVA with Dunnett’s multiple comparisons test, P-value: S.C. tumour 0.003, tdLn 0.0045, liverLn 0.0048, cerLn 0.0002, blood 0.0005, mean ± SD, n = 4 per group. e viSnE analysis of indicated marker as detected by CyTOF. Displayed on aggregated samples. Related to Fig. 4c. f Subcutaneous MC38 tumour growth in mice with subcutaneous and liver tumours, treated with anti-PD-L1, anti-CD4, or the combination. Two-way AnOVA with Tukey’s correction, mean ± SD, S.C. +IgG n = 5, S.C. + anti-PD-L1 n = 5, S.C. +liver n = 8, S.C. + anti-PD-L1+ anti-CD4 n = 9. g MC38 subcutaneous tumour growth in mice with subcutaneous and liver tumours, treated with anti-PD-L1, or in combination with hepatic CD4+ adoptive cell transfer (ACT). Two-way AnOVA with Tukey’s correction, mean ± SD, S.C. + IgG n = 9, S.C. + anti-PD-L1 n = 10, S.C. + liver+IgG n = 10, S.C. + liver+anti-PD-L1 n = 8, S.C + liver+CD4 ACT n = 8. Data are representative of at least two independent experiments (a-d).
Extended Data Fig. 5 |
Extended Data Fig. 5 |. Hepatic myeloid cells induce activated T-cell apoptosis via the Fas/FasL pathway.
a Gating strategy for hepatic CD11b+F4/80+ cells. b Relative cell number of intrahepatic CD11b+F4/80+ following indicated treatment. Samples were analysed after two doses of anti-CSF-1 and clodronate liposome treatment. Data were normalized to control mice receiving PBS liposomes and IgG. One-way AnOVA, mean ± SD, PBS-lipo+IgG n = 9, Clo-lipo+IgG n = 10, PBS-lipo+anti-CSF-1 n = 9, Clo-lipo+anti-CSF-1 n = 11, S.C. n = 8. c Frequency of CD11b+F4/80+ cells (left), absolute number of CD11b+F4/80+ cells (middle) and ratio of CD11b+F4/80+cells to CD8+ T cells (right) in the liver from mice bearing both MC38 subcutaneous tumour and liver tumour. Samples were collected after two doses of anti-CSF-1 and clodronate liposome treatment. Unpaired two-tailed Student’s t-test, mean ± SD, PBS-lipo+IgG n = 9, Clo-lipo+anti-CSF-1 n = 8. d Absolute number of intrahepatic dendritic cells following two doses of anti-CSF-1 and clodronate liposome treatment. Dendritic cells were gated as CD45+F4/80+CD11c+MHCII+ cells. Unpaired two-tailed Student’s t-test, mean ± SD, PBS-lipo+IgG n = 9, Clo-lipo+anti-CSF-1 n = 8. e Frequency of CD11b+F4/80+ cells (left), absolute number of CD11b+F4/80+ cells (middle) and ratio of CD11b+F4/80+ cells to CD8+ T cells (right) in the subcutaneous tumour from mice bearing both MC38 subcutaneous tumour and liver tumour. Samples were collected after two doses of anti-CSF-1 and clodronate liposome treatment. Unpaired two-tailed Student’s t-test, mean ± SD, n = 7 per group. f MC38 subcutaneous tumour growth in mice with only S.C. tumours treated with anti-PD-L1, clodronate liposome and anti-CSF-1, or the combination. Two-way AnOVA with Tukey’s correction, mean ± SD, n = 8 per group. g Schematic for clodronate liposome, anti-CSF-1, and OT-I adoptive transfer. h MC38 subcutaneous tumour growth in mice with S.C. and liver tumours treated with anti-PD-L1, clodronate liposome, anti-CSF-1, anti-CD8, or the combination. Two-way AnOVA with Tukey’s correction, mean ± SD, n = 6 per group. i Frequency of annexin V+7-AAD+ OT-I cells co-cultured in the presence of OVA peptide with hepatic F4/80+ cells isolated from liver tumour bearing mice at indicated ratios for 48 hours; Activated OT-I cells were labeled with CFSE before co-culture. One-way AnOVA with Dunnett’s multiple comparisons test, mean ± SD, n = 7 biologically independent samples. j Frequency of annexin V+7-AAD+ OT-I cells (CFSE labeled) after co-cultured in the presence of OVA peptide with hepatic F4/80+ cells in indicated conditions for 48 hours. One-way AnOVA with Tukey’s correction, mean ± SD, n = 3 biologically independent samples. k Flow cytometry histogram of Fas expression on hepatic OT-I (left) and KSP-tetramer+CD8+ T cells (right). Unactivated OT-I cells were transferred into mice bearing MC38-OVA subcutaneous tumour and liver tumour. Phenotype of transferred OT-I cells and endogenous KSP-tetramer+CD8+ T cells were analysed 12 days after adoptive transfer. l Frequency of annexin V+7-AAD+ OT-I cells co-cultured with MC38-OVA tumour cells and hepatic F4/80+ cells isolated from liver tumour bearing mice with and without TnFα blockade. Activated OT-I cells were labeled with CFSE before co-culture. Unpaired two-tailed Student’s t-test, mean ± SD, n = 4 biologically independent samples. m Quantification of H-2Kb-OVA mean fluorescent intensity (MFI) on hepatic CD11b+F4/80+ cells recovered from mice bearing subcutaneous MC38-OVA tumour with or without liver MC38-OVA tumour. Unpaired two-tailed Student’s t-test, mean ± SD, n = 5 per group. n, o Quantification of FasL (n) and H-2Kb (o) MFI on lung CD11b+F4/80+ cells recovered from mice bearing subcutaneous MC38 tumour with (n = 9) or without (n = 6) lung MC38 tumour, in comparison with hepatic CD11b+F4/80+ cells recovered from mice bearing subcutaneous MC38 tumour with (n = 9) or without (n = 6) liver MC38 tumour. Tissues were collected 10 days after tumour inoculation. One-way AnOVA, mean ± SD. Data are representative of at least two independent experiments (b-o).
Extended Data Fig. 6 |
Extended Data Fig. 6 |. Liver metastasis alters the liver immune microenvironment.
a UMAP plot of all hepatic immune cell clusters on all samples merged. b Table identifying immune cell clusters and listing key genes. c Frequency of all immune cell clusters in mice with a subcutaneous tumour (S.C.) and mice with subcutaneous and liver tumours (S.C. + liver). d Apoptosis gene set enrichment analysis of in activated T-cell clusters in mice with a subcutaneous tumour and mice with subcutaneous and liver tumours. Activated T cells were identified by expression of Cd44. Unpaired two-tailed Student’s t-test, min to max, S.C. n = 157 cells, S.C. + liver n = 38 cells. e UMAP plot of Lgal3 on all samples merged. f UMAP plot of residential and migratory macrophages on all samples merged. g Violin plot of residential and migratory macrophage gene signatures in mice with a subcutaneous tumour and mice with subcutaneous and liver tumours. Unpaired two-tailed Student’s t-test, min to max. h Violin plot of residential macrophage M2-like and M1-like gene set enrichment in mice with a subcutaneous tumour and mice with subcutaneous and liver tumours. Unpaired two-tailed Student’s t-test, nS, not significant, min to max. S.C. n = 543 cells, S.C. + liver n = 936 cells. i Violin plot of cross-presentation gene set enrichment in resident (n = 1479 cells) and mono-derived (n = 6698 cells) macrophages. Unpaired two-tailed Student’s t-test, min to max. j Violin plot of M2-like and M1-like signatures within monocyte-derived macrophage cell subsets in mice with a subcutaneous tumour and mice with subcutaneous and liver tumours. Unpaired two-tailed Student’s t-test, min to max. k Pseudotime analysis overlying time with monocyte-derived macrophage cell states. l Pseudotime analysis overlaying monocyte-derived macrophage clusters and states.
Extended Data Fig. 7 |
Extended Data Fig. 7 |. Extended CyTOF data analysis of liver immune cells after radiotherapy and immunotherapy.
a Schematic describing combination treatment with liver directed radiotherapy followed by anti-PD-L1. b-d Immune clusters identified by mass cytometry in Fig. 6a. b, Heatmap showing frequency of antibody labeling (rows) in the 18 immune populations (columns) derived from a combined analysis of all samples. c, Immune cell subset identified by mass cytometry. d, viSnE representation of key marker expression across subpopulations, displayed on aggregated samples.
Extended Data Fig. 8 |
Extended Data Fig. 8 |. Radiotherapy reshapes the liver immune microenvironment.
a, b Flow cytometry quantification of CD8+ T-cell number (a), Ki67+, IFnγ+ and granzyme B+ CD8+ T cells (b) in the livers from mice bearing both subcutaneous tumour and liver tumour with indicated treatments. Analysed 5 days after RT. One-way AnOVA, mean ± SD, n = 6 per group. c Hepatic tissue chemokine levels in subcutaneous and liver tumour bearing mice treated in indicated fashion. Analysed 5 days after RT by Luminex; One-way AnOVA, mean ± SD, n = 5 per group. d-f ELISA analysis of culture supernatant (d, n = 3 biologically independent samples) and phenotypic analysis (e, f, n = 4 biologically independent samples) of MC38 cells 48 hours after irradiation. One-way AnOVA, **P = 0.006, ***P = 0.0003, ****P < 0.0001, mean ± SD. g Flow cytometry plot and quantification of cleaved caspase-3 in total hepatic CD8+ T cells from mice bearing both subcutaneous tumour and liver tumour, with (n = 8) or without (n = 7) liver-directed radiotherapy (RT). Unpaired two-tailed Student’s t-test, mean ± SD. h Schematic describing liver-directed radiotherapy and adoptive cell transfer. Data are representative of at least two independent experiments (a-g).
Extended Data Fig. 9 |
Extended Data Fig. 9 |. Radiotherapy abolishes immunotherapy resistance induced by liver metastasis.
a, b Flow cytometry quantification of subcutaneous tumour dLn Ki67+ (a) and IFnγ+ (b) in CD8+ and CD4+ T cells in mice with subcutaneous and liver metastasis treated as indicated; analysed 7 days after radiotherapy. One-way AnOVA, mean ± SD, IgG n = 4, others n = 5. c Representative bioluminescent imaging of subcutaneous and liver tumour bearing mice following treatment with anti-PD-L1, radiotherapy, and anti-CD8. d Subcutaneous tumour volume of mice bearing only subcutaneous MC38 tumours treated with radiation to the liver, anti-PD-L1, or the combination. Two-way AnOVA with Tukey’s correction, mean ± SD, n = 7 per group. e Subcutaneous tumour volume of mice bearing subcutaneous KPC2 tumours treated with anti-PD-L1. Two-way AnOVA, mean ± SD, n = 10 per group. f KPC2 subcutaneous tumour growth in mice with (S.C. +liver) or without (S.C.) liver tumours treated with anti-PD-L1, or in combination with liver directed radiotherapy. f, Two-way AnOVA, mean ± SD with Tukey’s correction, n = 10 per group. g KPC2 liver tumour growth in mice with subcutaneous and liver tumours treated as in (f). One-way AnOVA, mean ± SD, n = 5 for IgG and anti-PD-L1 group, n = 7 for anti-PD-L1+RT group. Data are representative of at least two independent experiments (a-g).
Extended Data Fig. 10 |
Extended Data Fig. 10 |. Impact of liver metastasis on cancer-immunity cycle.
The graphical abstract describes how liver metastases alter the normal cancer immunity cycle by inducing hepatic siphoning of T cells, and further how liver-directed radiotherapy can disrupt hepatic siphoning to promote effective anti-tumoral immunity.
Fig. 1 |
Fig. 1 |. Liver metastasis correlates with diminished immunotherapy efficacy in patients with cancer.
a, Best objective response rates in patients with metastatic melanoma who received immunotherapy, stratified by baseline disease distribution (Cohort 1). Chi-squared for liver metastasis 19.66, P < 0.0001. Data are shown as mean ± s.d.; liver n = 64, brain n = 50, lung n = 94. b, OS (Cohort 1), stratified by liver metastasis. Log-rank test, hazard ratio (HR) = 3.717. The shaded area represents the s.e.; liver n = 64, other n = 118. c, Best objective response rates in patients with metastatic nSCLC who received immunotherapy (Cohort 3), stratified by baseline disease distribution. Chi-squared for liver metastasis 3.29, P = 0.045. Data are shown as mean ± s.d.; liver n = 74, adrenal n = 48, lung n = 214. d, OS (Cohort 3), stratified by presence of liver metastasis. Log-rank test, HR = 2.03. The shaded area represents the s.e.; liver n = 74, other n = 205. e, Inverse-probability-weighted multivariable analysis of OS in patients with melanoma (Cohort 1) and with nSCLC (Cohort 3) who received immunotherapy, stratified by liver metastasis. Log-rank test, HR = 1.75 and 1.61, respectively. Data are shown as mean ± s.d.; melanoma liver n = 63, melanoma other n = 107, nSCLC liver n = 71, nSCLC other n = 186. f, Variable importance quantification from random forest modeling of OS in immunotherapy-treated patients with metastatic melanoma (Cohort 1) and with nSCLC (Cohort 3), immune-checkpoint blockade (ICB). g–i, PD-L1 expression in patients with (n = 25) and without (n = 62) liver metastases, transcripts per million (TPM) (g), tumor burden of patients with (n = 27) and without (n = 70) liver metastases (h), and tumor mutational burden of patients with (n = 26) and without (n = 62) liver metastases (i). Unpaired two-tailed Student’s t-test. Data are shown as mean ± s.d. j, OS, stratified by liver metastases. Log-rank test, HR = 2.444. The shaded area represents the s.e.; liver n = 28, other n = 72. k, Pre- and midtreatment (3 months after therapy initiation) 18F positron emission tomography–computed tomography (PET/CT) scan of a patient with metastatic melanoma with liver metastases who received concurrent ipilimumab and nivolumab. l, Waterfall plot showing change of tumoral burden (Cohort 1) from initiation to best objective response in melanoma patients with liver (n = 48) or other (n = 98) metastases. Unpaired two-tailed Student’s t-test, P = 0.0372. Data are shown as percentage change. m, Frequency of isolated failure in liver versus systemic failure in patients with melanoma (Cohort 1) who have failed immunotherapy, n = 43. n, Odds ratio of best objective clinical benefit rate in patients with the indicated histologies who received immunotherapy, stratified by liver metastasis. Chi-square, melanoma: P = 0.0005, nSCLC: P = 0.0005, urothelial P = 0.0065, renal cell P = 0.013, all P < 0.0001. Data are shown as mean ± s.d.; melanoma n = 378, nSCLC n = 177, renal cell carcinoma n = 84, urothelial n = 79.
Fig. 2 |
Fig. 2 |. Liver metastasis diminishes immunotherapy efficacy in mice.
a–d, MC38 subcutaneous tumor growth (a,b) in mice with only subcutaneous (SC) tumors and mice with subcutaneous and liver metastasis (SC + liver) treated with anti-PD-L1. Two-way analysis of variance (AnOVA) was used for statistical analysis. Data are shown as mean ± s.d.; n = 8 per group and 10 per group, respectively. Tumor weights (c) and representative images (d) in mice treated as described above. One-way AnOVA with Tukey’s correction was used for statistical analysis. Data are shown as mean ± s.d.; n = 10 per group, pooled data from 2 independent experiments. e,f, MC38 liver tumor quantification (e) and bioluminescent images (f) in mice bearing liver and subcutaneous tumors treated with isotype (n = 9) and anti-PD-L1 (n = 7). Two-way AnOVA was used for statistical analysis. Data are shown as mean ± s.d. g–k, MC38 subcutaneous tumor growth in mice with a single subcutaneous tumor (SC, g), with bilateral subcutaneous tumors (SC + SC, h), with subcutaneous tumor and liver tumor (SC + liver, i), with subcutaneous tumor and lung tumor (SC + lung, j) or with subcutaneous MC38 tumor and liver B16F10 tumor (SC + B16F10 liver, k) with the indicated treatments. Two-way AnOVA was used for statistical analysis; P values are shown in comparison with the SC IgG group. Data are shown as mean ± s.d.; n = 5 per group. l–n, B16F10 subcutaneous tumor growth in mice with subcutaneous tumors treated with anti-PD-L1 (n = 10) or isotype (n = 6) (l), with subcutaneous and B16F10 liver tumors treated with anti-PD-L1 (n = 7) or isotype (n = 6) (m) or with subcutaneous B16F10 tumor and MC38 liver tumor (SC + MC38 liver) (n) treated with anti-PD-L1 (n = 8) or isotype (n = 6). Two-way AnOVA was used for statistical analysis. Data are shown as mean ± s.d. Data are representative or inclusive of at least two independent experiments (a–n).
Fig. 3 |
Fig. 3 |. Liver metastasis induces systemic loss of antigen-specific T cells.
a,b, Immunofluorescent staining of CD8+ cells (a) and quantification (b) in MC38 subcutaneous tumors from mice with subcutaneous tumors only or with subcutaneous and liver tumors. Analysis was done at 10 d after therapy initiation. One-way AnOVA with Tukey’s correction was used for statistical analysis. Data are shown as mean ± s.d.; n = 10 fields from n = 3 mice per group. Scale bar, 50 μm. c,d, Flow analysis of Ki67+CD8+ and IFn-γ+CD8+ T cells from subcutaneous tumor dLns in mice with and without liver metastasis treated with anti-PD-L1 therapy. Mice were analyzed 1 week after therapy initiation. One-way AnOVA with Tukey’s correction was used for statistical analysis. Data are shown as mean ± s.d.; isotype SC n = 5, all other groups n = 6. e–g, Unactivated OT-I cell adoptive transfer (e), activation (f), and proliferation (g) in subcutaneous tumor dLns of mice bearing MC38-OVA subcutaneous tumors with MC38 liver metastasis of the indicated genotype. Unpaired two-tailed Student’s t-test was used for statistical analysis. Data are shown as mean ± s.d.; n = 5 per group. i.v., intravenous injection. h,i, Flow analysis of CD8+KSP-tetramer+ T cells in indicated compartments (h, schematic; i, absolute number). Unpaired two-tailed Student’s t-test was used for statistical analysis. Data are shown as mean ± s.d.; n = 10 per group. j,k, OT-I cells were activated in vitro for 7 d, labeled with CFSE and then intravenously transferred into different groups of mice (j). Absolute number of CFSE+CD8+ OT-I T cells in indicated compartments by flow cytometry (k). Unpaired two-tailed Student’s t-test was used for statistical analysis. Data are shown as mean ± s.d.; MC38-luc n = 4, MC38-OVA n = 5. l, Absolute lymphocyte counts of patients with nSCLC receiving immunotherapy (Cohort 3) with (n = 62) or without (n = 187) liver metastases (left) or with (n = 187) or without (n = 62) lung metastases (right). Unpaired two-tailed Student’s t-test was used for statistical analysis. The box shows the mean and interquartile range (IQR), whiskers represent 10–90% and outliers represent the minimum to maximum value. m, The number of intratumoral T cell clones and intratumoral T cell receptor (TCR) diversity in patients (Cohort 7) with (n = 70) and without (n = 179) liver metastases. Unpaired two-tailed Student’s t-test was used for statistical analysis. The median value is indicated. n, The number of intratumoral T cell clones and intratumoral T cell receptor diversity in patients (Cohort 7) with (n = 57) and without (n = 191) lung metastases. Unpaired two-tailed Student’s t-test was used for statistical analysis. The median value is indicated. o, Composite and disease-specific T cell signature score in metastatic patients of the indicated cancer type stratified by the presence of liver metastasis (Cohort 7). A linear mixed-effect model was used for statistical analysis. The box shows the mean and IQR, whiskers represent 10–90% and outliers represent the minimum to maximum value. Breast n = 65, colorectal n = 21, melanoma n = 26, nSCLC n = 34, prostate n = 106. Data are representative or inclusive of at least two independent experiments (a–k).
Fig. 4 |
Fig. 4 |. Hepatic myeloid cells induce activated T cell apoptosis via the Fas–FasL pathway.
a, Flow cytometry analysis of hepatic cleaved caspase-3+CD8+ T cells in subcutaneous MC38 tumor-bearing mice with indicated liver tumor. Analysis was done 2 weeks after tumor inoculation. Unpaired two-tailed Student’s t-test was used for statistical analysis. Data are shown as mean ± s.d.; PBS n = 4, MC38 n = 7. b, Flow cytometry analysis of cleaved caspase-3+OT-I cells in mice bearing subcutaneous MC38-OVA tumor only (PBS, n = 5) and MC38-luc (n = 4) and MC38-OVA (n = 5) liver tumors. OT-I cells were activated in vitro, transferred at day 11 and analyzed at day 14. One-way AnOVA with Tukey’s correction was used for statistical analysis. Data are shown as mean ± s.d. c,d, CyTOF SPADE analysis (c) and frequency (d) of hepatic immune cells from mice bearing only subcutaneous MC38 tumors and of mice bearing both subcutaneous and liver MC38 tumors. Size indicates absolute number; color indicates frequency of CD45+ cells. Analysis was done at day 10 after tumor inoculation. cDC, conventional dendritic cells; γδT, gamma delta T cells; nK, natural killer cells; TC, T cells. Data in d represent pooled data from two independent experiments. Two-way AnOVA with Bonferroni’s correction was used for statistical analysis. Data are shown as mean ± s.d. e, Flow cytometry analysis of hepatic CD11b+F4/80+ cells. Analysis was done 2 weeks following inoculation. Unpaired two-tailed Student’s t-test was used for statistical analysis. Data are shown as mean ± s.d.; n = 4 per group. f,g, Flow cytometry quantification of hepatic cleaved caspase-3+ OT-I cells (f), and absolute number of OT-I cells in indicated compartments (g) in indicated mice treated with clodronate liposomes (Clo-lipo) and anti-CSF-1 (as shown in Extended Data Fig. 5g). Unpaired two-tailed Student’s t-test was used for statistical analysis. Data are shown as mean ± s.d.; n = 5 per group. h, MC38 subcutaneous tumor growth in mice bearing indicated tumors treated with anti-PD-L1; clodronate liposome and anti-CSF-1; or the combination. Controls include PBS liposomes (PBS-lipo). Two-way AnOVA with Tukey’s correction t-test was used for statistical analysis. Data are shown as mean ± s.d.; n values are as indicated. i,j, Frequency of annexin V+7-AAD+OT-I T cells following coculture with the indicated cell types (n = 6 biologically independent samples) (i) and in indicated configuration (transwell, n = 3 biologically independent samples) (j) for 48 h. j, F4/80+ cells from liver-tumor-bearing mice. One-way AnOVA with Tukey’s correction was used for statistical analysis. Data are shown as mean ± s.d. k, Flow cytometry analysis of FasL expression on hepatic CD11b+F4/80+ cells in subcutaneous tumor-bearing mice with and without liver tumors. Unpaired two-tailed Student’s t-test was used for statistical analysis. Data are shown as mean ± s.d.; n = 8 per group. l, Frequency of annexin V+7-AAD+OT-I T cells following coculture with the indicated cell types and blockade of FasL. F4/80+ cells from liver-tumor-bearing mice. One-way AnOVA with Tukey’s correction was used for statistical analysis. Data are shown as mean ± s.d.; n = 4 biologically independent samples. Data are representative of at least two independent experiments (a–l).
Fig. 5 |
Fig. 5 |. Liver metastasis alters the liver immune microenvironment.
a,b, UMAP plot (a) and frequency (b) of hepatic hematopoietic (Ptprc-expressing) cell clusters in mice with subcutaneous tumors and subcutaneous and liver tumors. Analysis was done at day 14 after tumor inoculation. Chi-square statistic: 17.47 (Macrophages), 16.85 (T cells). c, UMAP plot of indicated macrophage markers in merged sample. d, UMAP plot of Ccr2 and composite plot of Timd4, Vsig4 and Clec4f within the macrophage clusters identified in c on a merged sample. e, UMAP plot and frequency of residential (Timd4+Vs ig4+Clec4f+) and monocyte (mono)-derived (Ccr2+) macrophages in mice with subcutaneous tumors or with subcutaneous and liver tumors. Chi-square statistic: 15.67 (monocyte-derived); n.s., not significant, P = 0.55; ***P = 0.0001; SC residential n = 543, SC monocyte-derived n = 1,599, SC + liver residential n = 936, SC + liver monocyte-derived n = 5,099. f, Flow cytometry plot showing that the majority of hepatic macrophages (CD11b+F4/80+ cells, blue) in mice with subcutaneous and liver tumors express CCR2, whereas limited hepatic macrophages express TIM-4. g, M2-like and M1-like gene signature score in monocyte-derived macrophages; unpaired two-tailed Student’s t-test was used for statistical analysis, and the minimum to maximum are shown. SC n = 1,599, SC + liver n = 5,099. h, Reclustered UMAP plot of monocyte-derived macrophage clusters on merged sample. i, Monocle2 pseudotime plot of monocyte-derived macrophages showing different macrophage states and branch points.
Fig. 6 |
Fig. 6 |. Radiotherapy reshapes the liver immune microenvironment and abolishes immunotherapy resistance induced by liver metastasis.
a, viSnE analysis of CyTOF immunophenotyping of livers from mice with both subcutaneous and liver tumors, treated with IgG (n = 4), anti-PD-L1 (n = 3), liver-directed radiotherapy (RT, n = 4) or combination therapy (n = 5). Analysis was done 5 d after RT. All samples combined (left), combined samples from each group (top right) and frequencies in different groups (bottom right) are shown as mean ± s.e. b,c, Flow cytometry quantification of hepatic CD11b+F4/80+ macrophage number (b) and ratio to CD8+ T cells (c) in mice treated as in a. Analysis was done 5 d after RT. One-way AnOVA was used for statistical analysis. Data are shown as mean ± s.d.; n = 6 per group. d,e, Flow cytometry analysis of hepatic cleaved caspase-3+ OT-I cells (d) and OT-I cell number in indicated compartments (e) from mice with indicated liver tumors and treatments (Extended Data Figure 8i). Analysis was done 4 d after OT-I adoptive transfer. d, One-way AnOVA, mean ± s.d., d, MC38-luc n = 5; MC38-OVA n = 4; MC38-OVA + RT n = 5. In e, data were pooled from two independent experiments. MC38-luc n = 10, MC38-OVA n = 9, MC38-OVA + RT n = 5. f,g, Immunofluorescent staining of CD8+ cells (f) and quantification (g) in MC38 subcutaneous tumors from mice with subcutaneous tumor and liver metastasis treated with IgG, anti-PD-L1 and/or radiotherapy. Analysis was done 10 d after radiotherapy. One-way AnOVA was used for statistical analysis. Data are shown as mean ± s.d. Scale bar, 50 μm. n = 10 fields from 3 mice per group. h, MC38 subcutaneous tumor growth in mice with subcutaneous and liver tumors treated with anti-PD-L1, liver-directed radiotherapy or the combination. Two-way AnOVA with Tukey’s correction was used for statistical analysis. Data are shown as mean ± s.d.; n = 5 per group. i,j, MC38 liver metastasis bioluminescent quantification (i, n = 5 per group) and representative images (j) of mice treated with anti-PD-L1, liver-directed radiotherapy or the combination. One-way AnOVA was used for statistical analysis. Data are shown as mean ± s.d. k, Survival of mice bearing MC38 subcutaneous tumors and liver metastases following treatment with anti-PD-L1 and radiotherapy. Log-rank test was used for statistical analysis. Survival is shown; n = 6 per group. l, MC38 subcutaneous tumor growth in mice bearing subcutaneous and liver tumors following treatment with the indicated combinations of liver-directed radiotherapy, anti-PD-L1 and anti-CD8. Two-way AnOVA with Tukey’s correction was used for statistical analysis. Data are shown as mean ± s.d.; SC + liver anti-PD-L1 + RT n = 8, other groups n = 7. Data are representative of at least two independent experiments (b–l).

Comment in

References

    1. Mehlen P & Puisieux A Metastasis: a question of life or death. Nat. Rev. Cancer 6, 449–458 (2006). - PubMed
    1. Disibio G & French SW Metastatic patterns of cancers: results from a large autopsy study. Arch. Pathol. Lab. Med. 132, 931–939 (2008). - PubMed
    1. Li F & Tian Z The liver works as a school to educate regulatory immune cells. Cell. Mol. Immunol. 10, 292–302 (2013). - PMC - PubMed
    1. Doherty DG Immunity, tolerance and autoimmunity in the liver: a comprehensive review. J. Autoimmun. 66, 60–75 (2016). - PubMed
    1. Crispe IN Hepatic T cells and liver tolerance. Nat. Rev. Immunol. 3, 51–62 (2003). - PubMed

Publication types

MeSH terms

Grants and funding