. 2021 Jan;28(1):92-102.
doi: 10.1038/s41594-020-00534-w. Epub 2021 Jan 4.

Structural and functional characterization of the Spo11 core complex

Affiliations

Structural and functional characterization of the Spo11 core complex

Corentin Claeys Bouuaert et al. Nat Struct Mol Biol. 2021 Jan.

Abstract

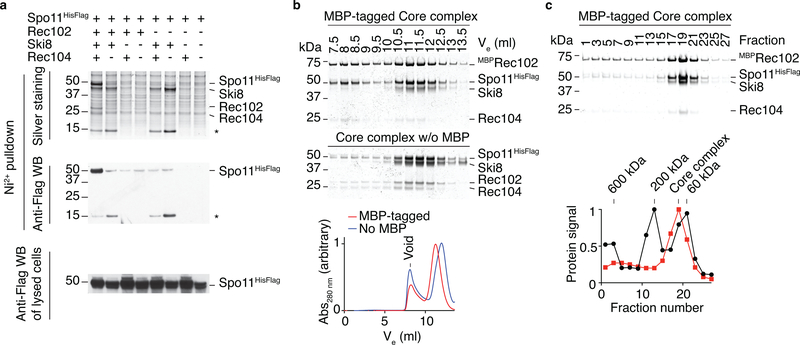
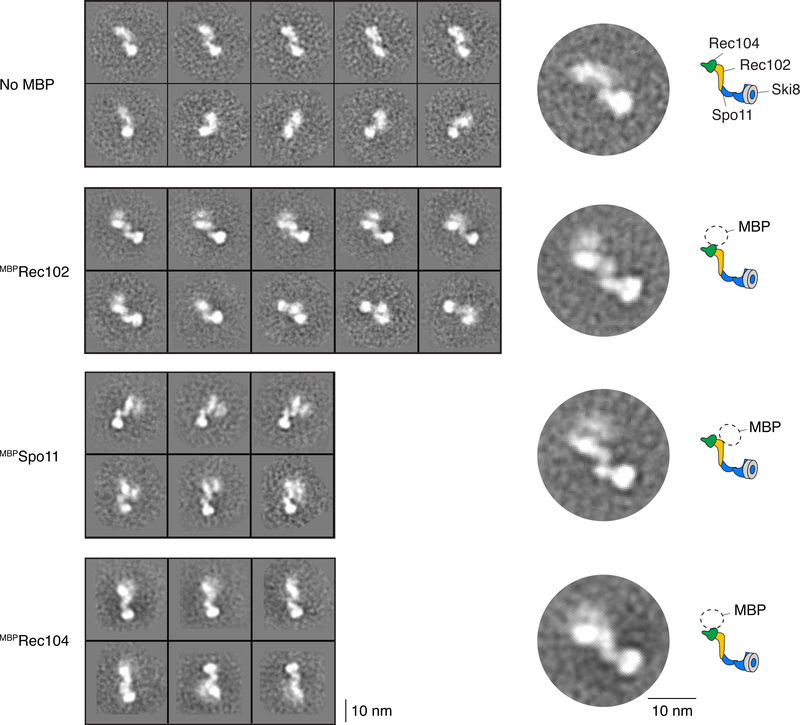
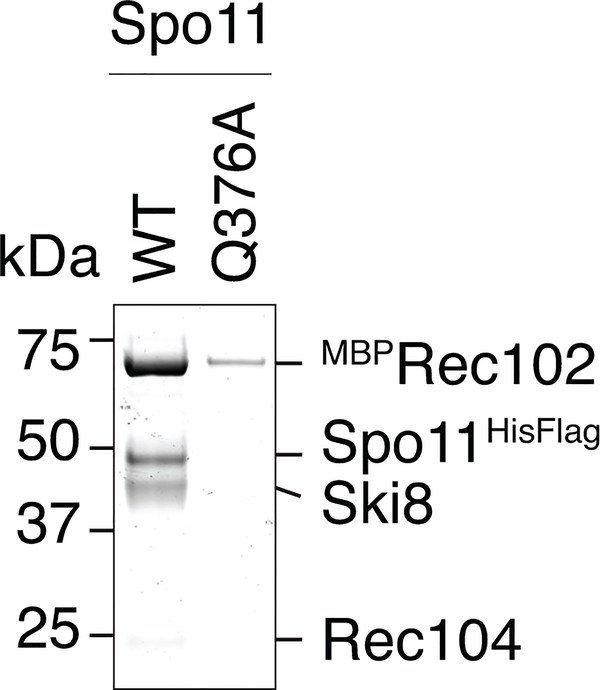
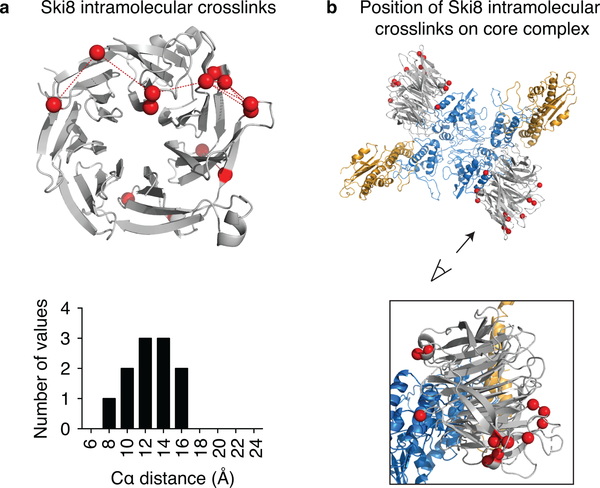
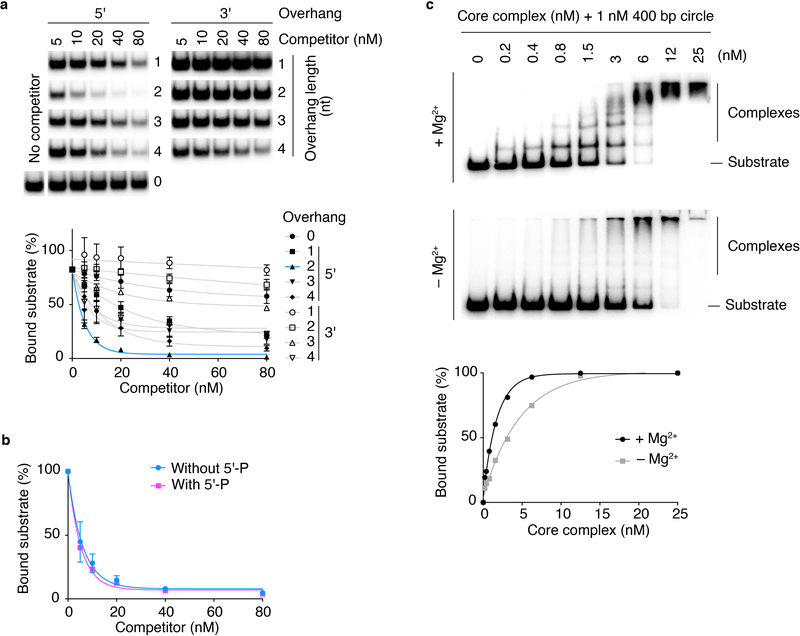
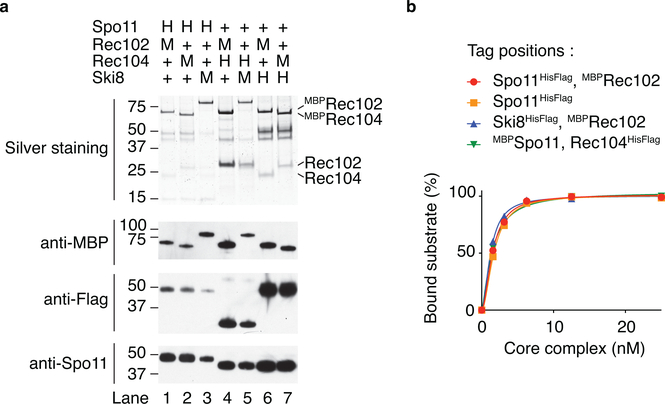
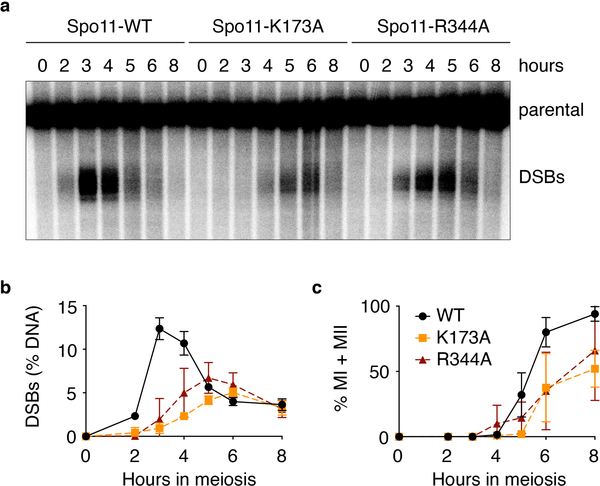
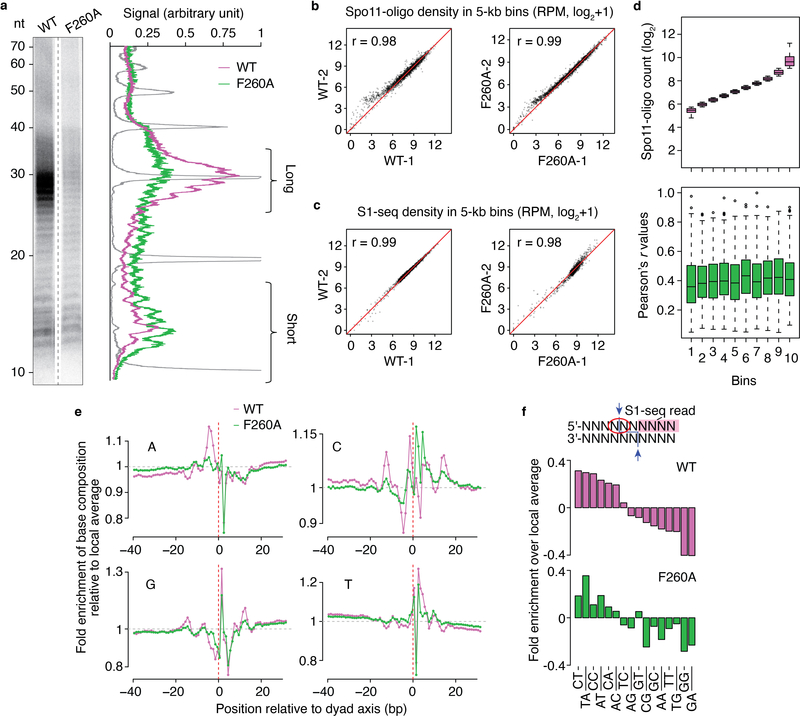
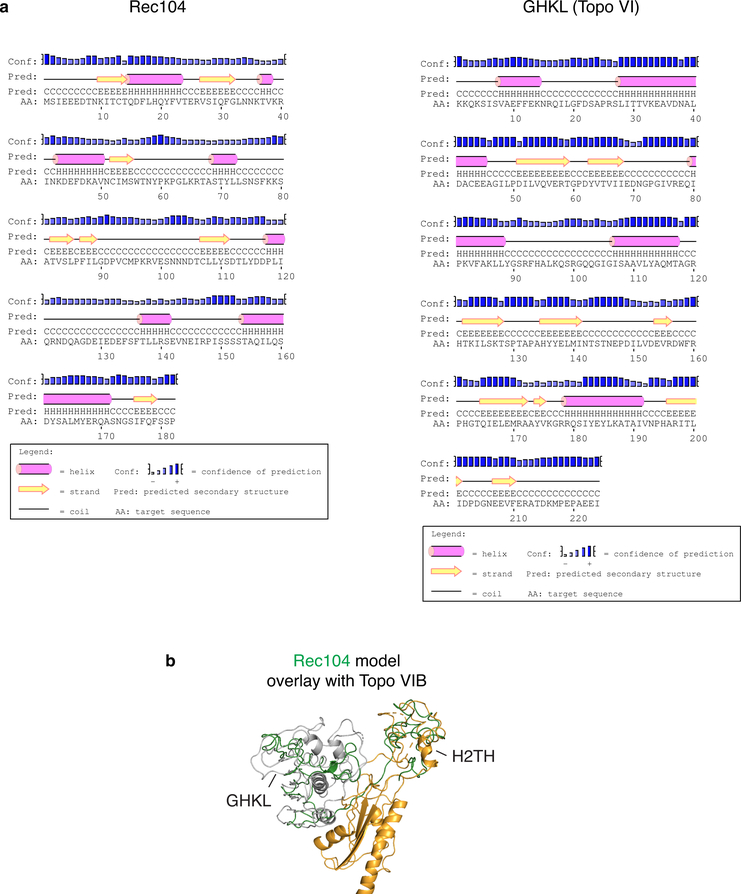
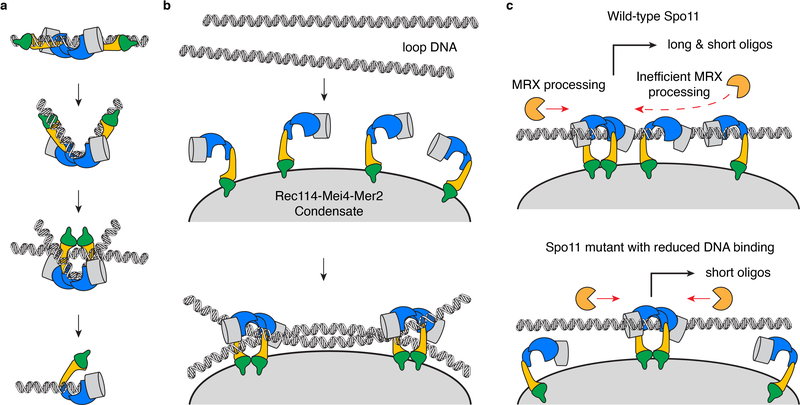
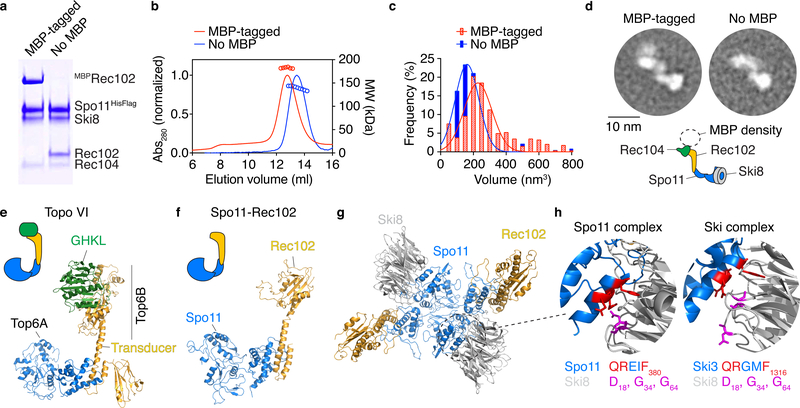
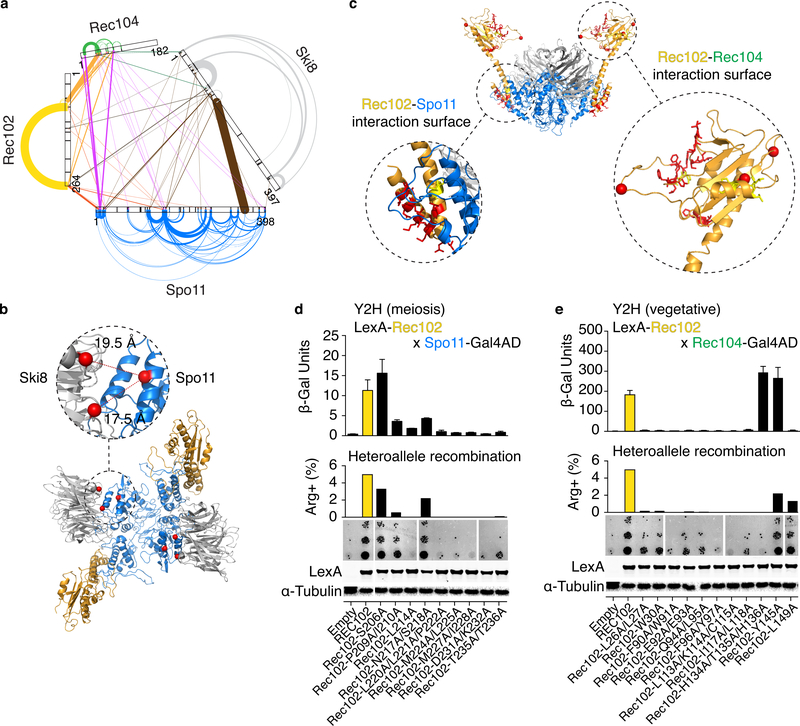
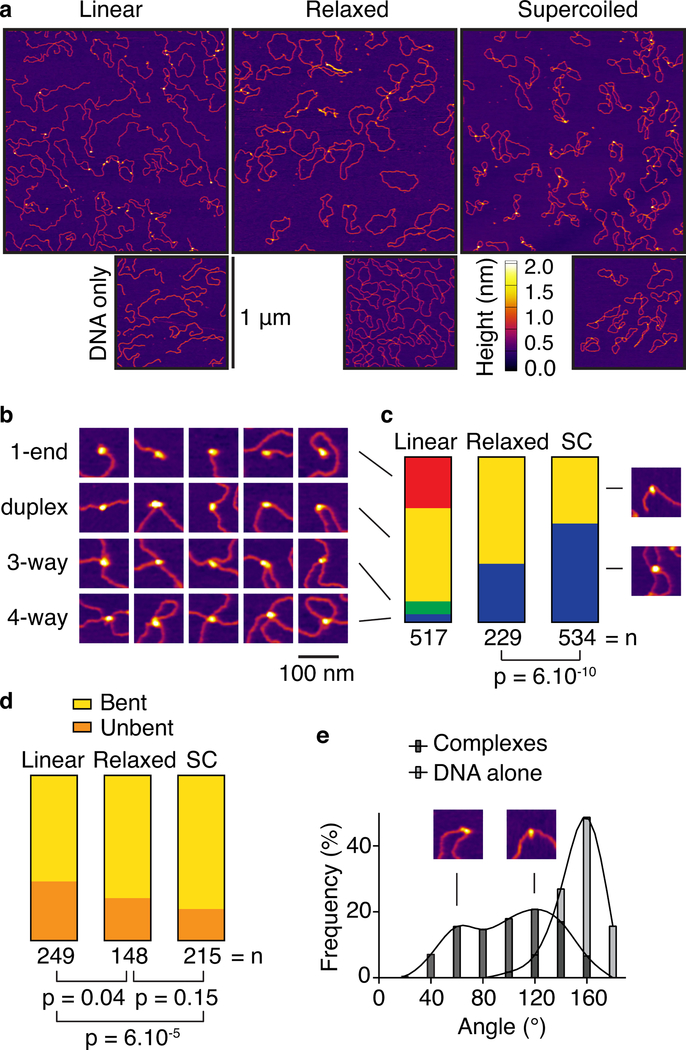
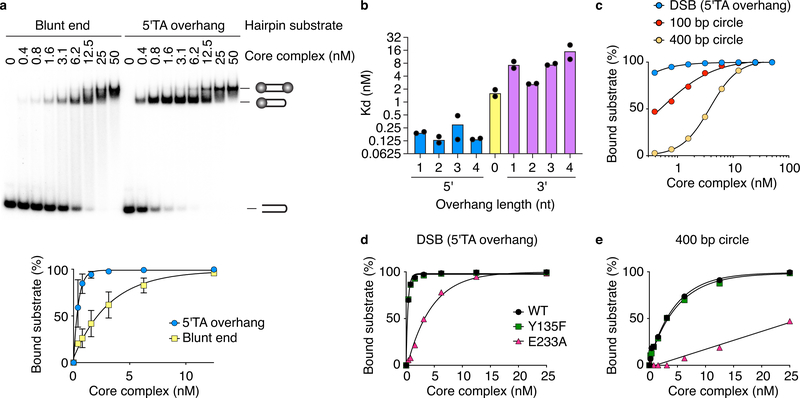
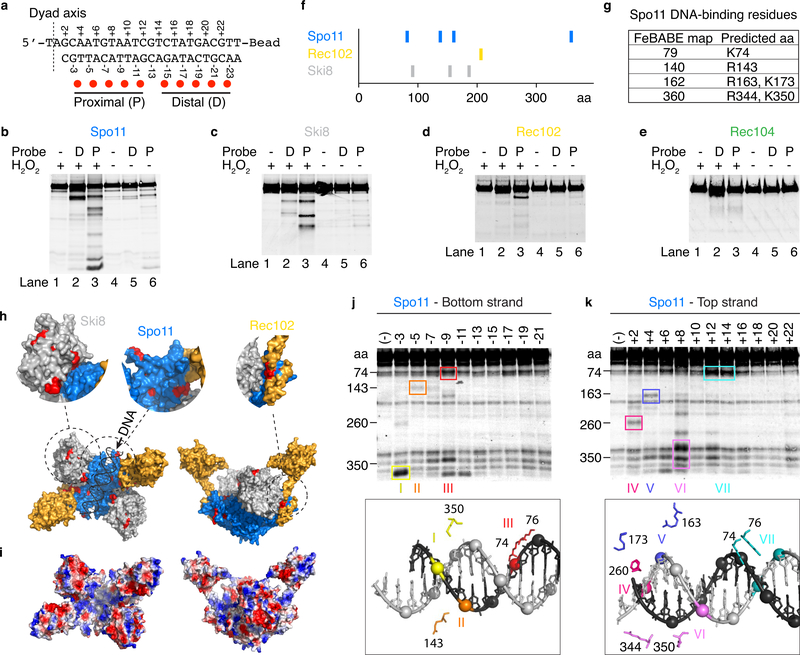
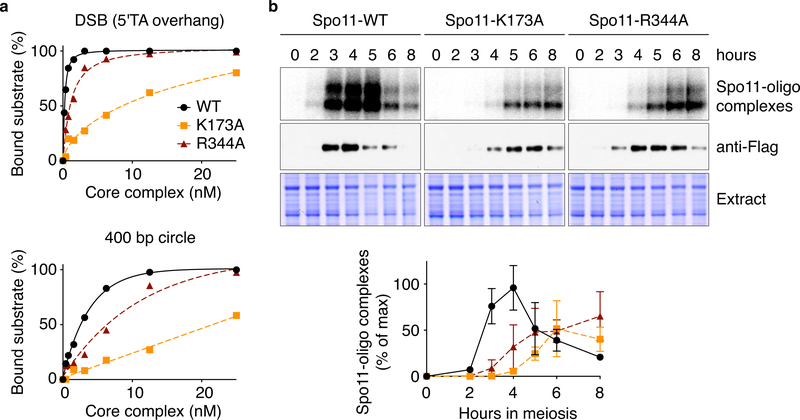
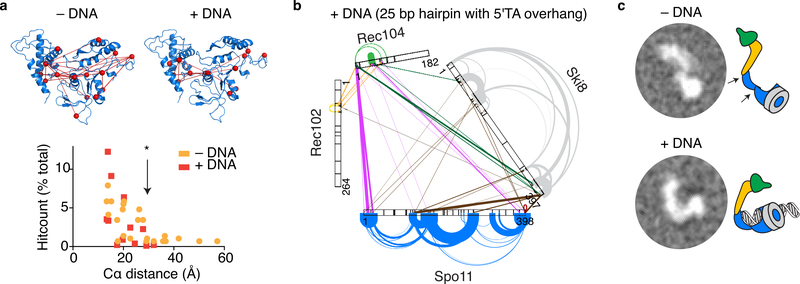
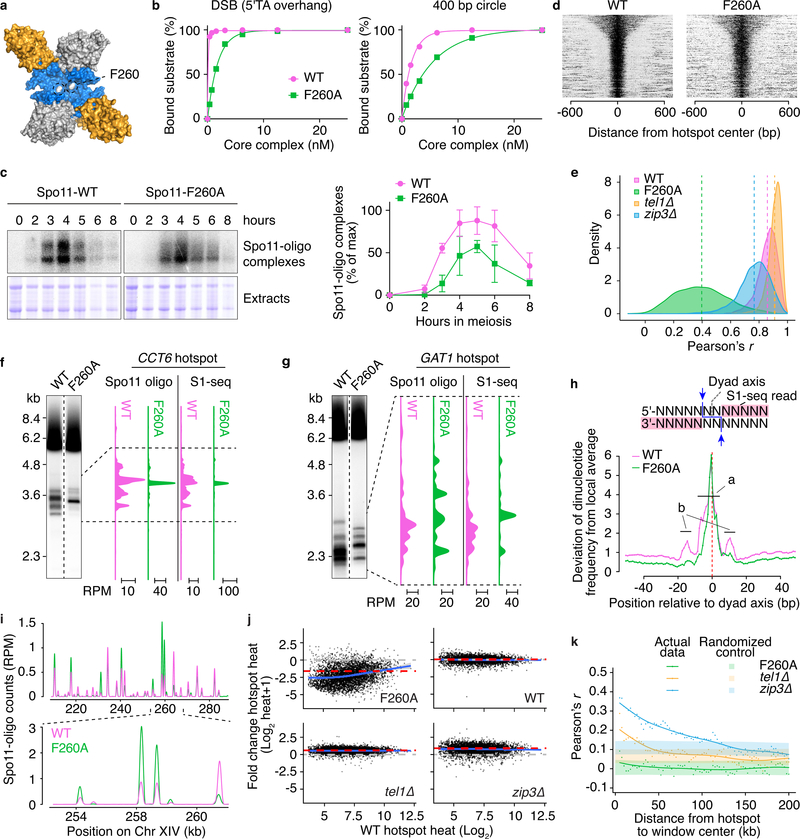
Spo11, which makes DNA double-strand breaks (DSBs) that are essential for meiotic recombination, has long been recalcitrant to biochemical study. We provide molecular analysis of Saccharomyces cerevisiae Spo11 purified with partners Rec102, Rec104 and Ski8. Rec102 and Rec104 jointly resemble the B subunit of archaeal topoisomerase VI, with Rec104 occupying a position similar to the Top6B GHKL-type ATPase domain. Unexpectedly, the Spo11 complex is monomeric (1:1:1:1 stoichiometry), consistent with dimerization controlling DSB formation. Reconstitution of DNA binding reveals topoisomerase-like preferences for duplex-duplex junctions and bent DNA. Spo11 also binds noncovalently but with high affinity to DNA ends mimicking cleavage products, suggesting a mechanism to cap DSB ends. Mutations that reduce DNA binding in vitro attenuate DSB formation, alter DSB processing and reshape the DSB landscape in vivo. Our data reveal structural and functional similarities between the Spo11 core complex and Topo VI, but also highlight differences reflecting their distinct biological roles.


Conflict of interest statement

Competing Interests: The authors declare no competing interests.

Figures

Extended Data Fig. 1:
Extended Data Fig. 1:. Co-expression of core complex subunits, size exclusion chromatography and glycerol gradient sedimentation analyses of the core complex
a, Silver-stained SDS-PAGE gels (top) and anti-Flag western blot (WB; center) of Spo11 complexes after purification on nickel resin. Absence of Rec102, Rec104, or Ski8 leads to poor solubility of Spo11. Bottom: anti-Flag western blot of lysed Sf9 cells showing Spo11 expression levels. Asterisks: C-terminal truncation of Spo11 that retains the affinity tag and interaction with Ski8. b, Size exclusion chromatography of purified core complex with and without MBP tag on Rec102. Silver-stained SDS-PAGE gels of eluted fractions are shown above, with chromatograms from absorption at 280 nm below. c, Glycerol gradient sedimentation of MBP-tagged Spo11 core complexes. The silver-stained SDS-PAGE gel shows fractions collected from the bottom of the gradient. Quantification of protein signal from two independent experiments is shown together with molecular weight markers run on a separate gradient and quantified by Bradford assay. Note: Material in the void volume (panel b) and at the bottom of the glycerol gradient (panel c) lacks Ski8, which is consistent with Ski8 being required for solubility.
Extended Data Fig. 2:
Extended Data Fig. 2:. 2D class averages of nsEM images with different versions of the core complex
Core complexes without MBP or with MBP fused at the N-terminus of Rec102, Spo11 or Rec104 are shown. A cartoon of the presumed arrangement of the subunits and the position of the MBP electron density is shown. With the MBP-tagged Spo11 construct, the electron density of MBP is located at a similar position to the Rec102- or Rec104-tagged constructs. This is consistent with the observation that the N-terminus of Spo11 frequently crosslinks with Rec104 (pink lines in Fig. 2a), suggesting that the N-terminus of Spo11, absent from the structural model, is flexible and perhaps directly contacts Rec102/Rec104. The observation of a single MBP density for all three subunits tested provides further support for the 1:1:1:1 stoichiometry of the core complex. Complexes with MBP-tagged Ski8 were not well behaved and could not be purified.
Extended Data Fig. 3:
Extended Data Fig. 3:. The interaction between Ski8 and Spo11 is important for the integrity of the complex
SDS-PAGE analysis of core complexes purified with wild-type Spo11 or the Ski8-interaction deficient Q376A mutant. Equivalent percentages of the total protein purified from similar amounts of Sf9 extract were loaded in each lane, demonstrating the poor yield when the Spo11–Ski8 interaction is compromised.
Extended Data Fig. 4:
Extended Data Fig. 4:. Intramolecular crosslinks within Ski8 validate the XL-MS results.
a, Ski8 intramolecular crosslinks modeled on the structure of Ski8. The histogram shows the frequency of XL-MS events as a function of distance between the α-carbons (Cα) of the crosslinked lysines (red spheres). The crosslinkable limit of DSS is 27.4 Å. b, Ski8 intramolecular crosslinks modeled on the core complex show that the crosslinked residues are away from the interaction surface with Spo11.
Extended Data Fig. 5:
Extended Data Fig. 5:. DNA-binding properties of the core complex
a, Competition experiment using a labeled 25-bp hairpin substrate with 5′-TA overhang in the presence of unlabeled substrates with various overhang configurations. EMSA gel bands of bound labeled substrate are shown. Mean and ranges from two experiments are plotted. The substrate with a 2-nucleotide 5′ overhang is the most effective competitor. b, Competition experiment using a labeled 25-bp hairpin substrate with 5′-TA overhang in the presence of unlabeled competitor substrates with or without 5’ phosphate. Error bars represent ranges from two experiments. c, EMSA of core complex binding to 400-bp mini-circles in the presence or absence of Mg2+. For the top panel, binding reactions contained 5 mM Mg2+ and the gel and electrophoresis buffer contained 0.5 mM Mg2+. For the bottom panel, the binding reactions, gel, and buffer contained 1 mM EDTA.
Extended Data Fig. 6:
Extended Data Fig. 6:. Affinity purification of different combinations of tagged complexes and comparison of DNA-binding activities
a, Purification of core complexes that carry combinations of HisFlag (H) and MBP (M) tags on different subunits. All combinations yielded soluble Spo11 (western blot, bottom panel). While the Coomassie-stained gel shown in Fig. 1a suggests that Rec104 may be sub-stoichiometric, the similar relative intensities between MBP-tagged Rec102 and Rec104 in the silver-stained gel (where the MBP tag makes up the majority of each tagged protein’s mass) and anti-MBP western blot indicate that the two subunits have the same stoichiometry (compare lanes 1 with 2, and 6 with 7). The difficulty in purifying soluble Spo11-containing complexes when Rec104 is absent (Extended Data Fig. 1a) further bolsters the inference that the purified core complexes (nearly) always include Rec104. b, Comparison of the DNA-binding activity of core complexes that carried affinity tags on different subunits. All tagged complexes assayed had similar DNA-binding activities.
Extended Data Fig. 7:
Extended Data Fig. 7:. In vivo analyses of Spo11 DNA-binding mutants
a, Southern blot analysis of meiotic DSB formation at the CCT6 hotspot in strains expressing wild-type (WT) Spo11 or the K173A or R344A mutant proteins. b, Quantification of DSB formation at the CCT6 hotspot. Error bars represent the range from two experiments. c, Meiotic progression. MI + MII indicates the fraction of cells that have undergone the first or both meiotic divisions, as scored by DAPI staining.
Extended Data Fig. 8:
Extended Data Fig. 8:. Genome-wide analyses of DSB formation in the F260A mutant
a, Relative enrichment of the short Spo11-oligo class in F260A. Deproteinized, labeled oligos were separated by denaturing gel electrophoresis. Lane profiles are shown on the right. A 10-nt ladder is plotted in grey. b, c. Reproducibility of DSB maps. Correlations of Spo11-oligo counts (b) and S1-seq counts (c) within hotspots between two biological replicates of Spo11 wild type and F260A are plotted. Pearson’s r between datasets is indicated. d, Changed DSB distribution in F260A is not correlated with hotspot strength. Spo11 hotspots were binned according to oligo counts in wild type. Boxplots show the distribution of Pearson’s r values comparing within-hotspot Spo11-oligo distributions between wild type and F260A, as in Fig. 8e. The thick horizontal bars are medians, box edges are upper and lower quartiles, whiskers indicate values within 1.5 fold of interquartile range, and points are outliers. e, Base composition in S1-seq maps. The big spike in the G map at +2 is partially because this is the complement of the preferred C 5′ of the scissile phosphate, but it is also the first base of the ligation junction (and end-most base after S1 digestion), so the degree to which there is enrichment to the right but not left of the dyad axis probably reflects a modest end-bias in library prep in S1-seq. f, Spo11 preference at the scissile phosphate (dinucleotide indicated by the red circle).
Extended Data Fig. 9:
Extended Data Fig. 9:. Possible relation of Rec104 to a GHKL fold
a, Secondary structure predictions for Rec104 and the GHKL domain of Topo VIB were generated by PsiPred. b, Rec104 model generated by iTasser (green) overlaid on Topo VI. The transducer domain of Topo VI is yellow, the GHKL domain is grey.
Extended Data Fig. 10:
Extended Data Fig. 10:. Model of Spo11-induced break formation
a, AFM experiments suggest a model where the core complex binds a DNA duplex, bends it, then traps a second duplex. Perhaps DNA cleavage happens in the context of a trapped DNA junction, similar to Topo VI. After cleavage, Spo11 remains covalently attached to the DNA end through covalent and non-covalent interactions. b, Model of assembly of the DSB machinery. DNA-driven condensation by Rec114–Mei4–Mer2 is proposed to provide a platform that recruits the core complex, where it engages its DNA substrate. A hypothetical arrangement is shown where each dimer of core complexes captures a pair of DNA duplexes, which, for example, could be sister chromatids. c, Depletion of long oligos in Spo11 mutants with reduced DNA-binding activity is consistent with a model where long oligos arise from occlusion of the DNA substrate by multiple Spo11 complexes that reduce access to MRX/Sae2.
Fig. 1:
Fig. 1:. The meiotic DNA double-strand break core complex.
a. SDS-PAGE of purified core complexes with a C-terminal tag on Spo11, with and without MBP tag on Rec102 (4 μg per lane). b. SEC-MALS of the core complex with and without MBP on Rec102. c. Volumes of core complexes imaged by AFM. d. 2D class averages from nsEM of core complexes with or without MBP on Rec102. Cartoon illustrates subunit positions. e. Structure of Topo VI (PDB: 2Q2E). f. Model of Spo11–Rec102 based on homology with Topo VI. g. Structural model of a dimer of the Spo11–Rec102–Ski8 complex. Rec104 is not included. h. Interaction between Ski3 and Ski8 in the Ski complex and modeled interaction between Spo11 and Ski8. The motif in Ski3 that interacts with Ski8 (red) is also found in Spo11. Mutation of Q376 in Spo11 abolishes the yeast two-hybrid interaction with Ski8 and compromises integrity of the complex (see Extended Data Fig. 3). Uncropped gel image for panel a and data for graphs in b, c are provided as Source Data.
Fig. 2:
Fig. 2:. Protein-protein interactions within the core complex.
a. XL-MS of the core complex. Arches and lines represent intramolecular and intermolecular crosslinks, respectively. Line width is proportional to the number of independent crosslinked peptides and is a proxy for crosslinking frequency. b. Intermolecular crosslinks between Spo11 and Ski8. Distances between α-carbons (red spheres) of crosslinked lysines are shown. c. Positions of mutated residues (red) at predicted interaction surfaces between Rec102 and Spo11 (left), or Rec102 and Rec104 (right). Red spheres are α-carbons of Rec102 lysines that crosslink with Rec104. d, e. Quantitative β-galactosidase assays to measure yeast-two-hybrid (Y2H) interactions in meiotic or vegetative conditions (mean ± SD from four replicates). Center: Complementation of the meiotic recombination defect in a rec102 null mutant background. The graph shows the frequency of Arg+ prototrophs generated by recombination between two different arg4 mutant alleles; the image shows examples of growth of 5-fold serial dilutions of meiotic cultures spotted onto medium lacking arginine. Bottom: anti-LexA western blotting with α-tubulin as loading control. Data for empty vector and wild-type Rec102 are duplicated in d, e to aid comparison. Uncropped blot images and data for graphs are provided as Source Data.
Fig. 3:
Fig. 3:. DNA-binding by the core complex analyzed by AFM.
a. Wide-field views of core complexes bound to pUC19 plasmids. b. Examples of binding to ends (1-end), internally on duplex DNA (duplex), junctions of three DNA arms (3-way), and junctions with four DNA arms (4-way). c. Quantification of DNA-bound particles with the three substrates assayed. SC, supercoiled. d. Fractions of duplex-bound particles that exhibited DNA bending. e. Histogram of bending angles (n = 212 particles). Angles at randomly chosen positions along the DNA are shown as a control (n = 115 particles). P values in c, d are from two-sided Fisher’s exact tests. Data for graphs in c, d, e are provided as Source Data.
Fig. 4:
Fig. 4:. DNA-binding properties of the core complex.
a. EMSA of the core complex binding to DNA ends. Core complex was titrated with 5′-labeled 25-bp hairpin substrates with either blunt or two-nucleotide 5′-overhang ends. Quantification (mean ± SD from n=3 experiments) is shown below. b. Apparent dissociation constants for binding (EMSA) to DNA ends with 5′ and 3′ overhangs of different lengths. Data points and means from two experiments are plotted. c. Quantification of EMSAs comparing core complex binding to duplex DNA (100-bp or 400-bp DNA circles) vs. DNA ends (25-bp hairpin with 5′-TA overhang). d, e. EMSAs of end binding (d) and duplex binding (e) by Spo11 active-site mutants. Uncropped blot image for a and data for graphs are provided as Source Data.
Fig. 5:
Fig. 5:. Mapping DNA-binding surfaces by hydroxyl radical footprinting.
a. Sequence of the DNA substrate and positions of FeBABE moieties (red dots). The dyad axis is the center of rotational symmetry of Spo11 DSBs. b–e. Hydroxyl radical cleavage of core complexes carrying a C-terminal Flag tag on Spo11 (b), Ski8 (c), or Rec104 (e), or an N-terminal tag on Rec102 (d). Asterisks in panel b indicate cleavage positions illustrated in panel f. f. Summary of hydroxyl radical cleavages. g. Estimated cleavage positions in Spo11 and corresponding predicted DNA-binding residues. h. Hydroxyl radical cleavage sites (red) highlighted on the model of the core complex. i. Electrostatic potential map of the core complex model. j, k. Hydroxyl radical cleavage of tagged Spo11 using probes labeled at single positions along either the bottom (j) or top (k) strands. Prominent cleavage positions are color-coded (roman numerals) and highlighted on the structural model of the end-bound complex (below) to show the spatial correlation with positions of FeBABE-modified phosphates. Some minor cleavage positions were omitted for simplicity. Non-specific degradation fragments were also observed, some of which comigrate with bone fide FeBABE-dependent fragments because cleaved positions tend to be surface-exposed. Uncropped blot images for panels b-e, j, k are provided as Source Data.
Fig. 6:
Fig. 6:. Mutations that affect Spo11 DNA binding compromise DSB formation.
a. Binding of wild-type or mutant Spo11-containing core complexes to a 25-bp hairpin substrate with 5′-TA overhang (DSB) or a DNA mini-circle. The affinity of R344A was decreased 3-fold for DNA duplex and 4-fold for DNA ends. For K178A, the affinity was decreased 27-fold for the ends and could not be measured on duplex DNA because binding did not reach saturation. b. Labeling of Spo11-oligo complexes. Representative gels of n = 2 assays are shown above; quantification is plotted below (mean and range from two experiments). Uncropped blot and gel images and data for graphs are provided in the Source Data.
Fig. 7:
Fig. 7:. Conformational changes upon DNA binding.
a. Model of a Spo11 monomer displaying intramolecular crosslinks without (left) and with (right) DNA. The histogram tabulates distances separating α-carbons of crosslinked lysines. The crosslinkable limit (*) is 27.4 Å. Model-clashing crosslinks would not be explained better by Spo11 dimerization. b. XL-MS of the core complex bound to DNA (hairpin substrate with 2-nt 5′ overhang). c. 2D class averages from nsEM of core complexes in the presence or absence of DNA. DNA substrate in all panels was a 25-bp hairpin with 5′-TA overhang.

Data for graph in panel a are provided in the Source Data.
Fig. 8:
Fig. 8:. A mutation that affects Spo11-DNA interaction leads to a re-distribution DSBs.
a. Position of F260. b. DNA binding by wild-type (WT) or F260A core complexes. c. Labeling of Spo11-oligo complexes [left, representative gels; right, quantification (mean ± SD, three experiments)]. d. Spo11 oligos at known hotspots ordered by decreasing width (n=3908). Oligo counts for each hotspot were normalized to the local sum, so color coding shows spatial patterns, not relative strength between hotspots. e. Altered DSB distribution within hotspots. For each hotspot (n=3908), we calculated Pearson’s r between the consensus Spo11-oligo pattern in wild type (average of independent maps) and either F260A or wild type from this study, or tel1Δ and zip3Δ. f, g. DSBs in sae2Δ genomic DNA detected by Southern blotting at CCT6 (f) and GAT1 (g). h. Nonrandom base composition (summed deviation from local average of dinucleotide frequencies) at DSB sites. Schematic illustrates where Spo11 cuts (arrows) relative to S1-seq reads. I,j. Altered hotspot strengths. (i) Unscaled RPM (reads per million mapped) compares relative strengths between example hotspots, not absolute changes. (j) Log-fold changes in absolute strength of hotspots (n=3908) are plotted as a function of strength in the consensus wild-type map. The genome-wide Spo11-oligo counts in F260A, tel1Δ and zip3Δ were scaled by 0.4, 1.5 and 1.8 fold, respectively, based on quantification of Spo11-oligo complexes. Lines show Loess trend (blue), average fold change (red), and no change (gray). k. Changes in hotspot strength in F260A do not show domains of correlated behavior. Each point compares the log-fold change in hotspots with the change in their neighbors in a 5-kb window the indicated distance away. Shaded regions show 95% confidence intervals for hotspots randomized within-chromosome. Uncropped blot and gel images for panels c, f and g and data for graphs in b, c are provided as Source Data.

References

    1. Bergerat A et al. An atypical topoisomerase II from Archaea with implications for meiotic recombination. Nature 386, 414–7 (1997). - PubMed
    1. Keeney S, Giroux CN & Kleckner N Meiosis-specific DNA double-strand breaks are catalyzed by Spo11, a member of a widely conserved protein family. Cell 88, 375–84 (1997). - PubMed
    1. Corbett KD, Benedetti P & Berger JM Holoenzyme assembly and ATP-mediated conformational dynamics of topoisomerase VI. Nat Struct Mol Biol 14, 611–9 (2007). - PubMed
    1. Graille M et al. Crystal structure of an intact type II DNA topoisomerase: insights into DNA transfer mechanisms. Structure 16, 360–70 (2008). - PubMed
    1. Buhler C, Lebbink JH, Bocs C, Ladenstein R & Forterre P DNA topoisomerase VI generates ATP-dependent double-strand breaks with two-nucleotide overhangs. J Biol Chem 276, 37215–22 (2001). - PubMed

Methods-only References

    1. Kugou K et al. Rec8 guides canonical Spo11 distribution along yeast meiotic chromosomes. Mol Biol Cell 20, 3064–76 (2009). - PMC - PubMed
    1. Maleki S, Neale MJ, Arora C, Henderson KA & Keeney S Interactions between Mei4, Rec114, and other proteins required for meiotic DNA double-strand break formation in Saccharomyces cerevisiae. Chromosoma 116, 471–86 (2007). - PMC - PubMed
    1. McGuffin LJ, Bryson K & Jones DT The PSIPRED protein structure prediction server. Bioinformatics 16, 404–5 (2000). - PubMed
    1. Richards FM Calculation of molecular volumes and areas for structures of known geometry. Methods Enzymol 115, 440–64 (1985). - PubMed
    1. Sebastiaan Winkler G et al. Isolation and mass spectrometry of transcription factor complexes. Methods 26, 260–9 (2002). - PubMed

Publication types

MeSH terms