. 2021 Feb;28(2):152-161.
doi: 10.1038/s41594-020-00539-5. Epub 2021 Jan 4.

Promoter-proximal CTCF binding promotes distal enhancer-dependent gene activation

Affiliations

Promoter-proximal CTCF binding promotes distal enhancer-dependent gene activation

Naoki Kubo et al. Nat Struct Mol Biol. 2021 Feb.

Abstract

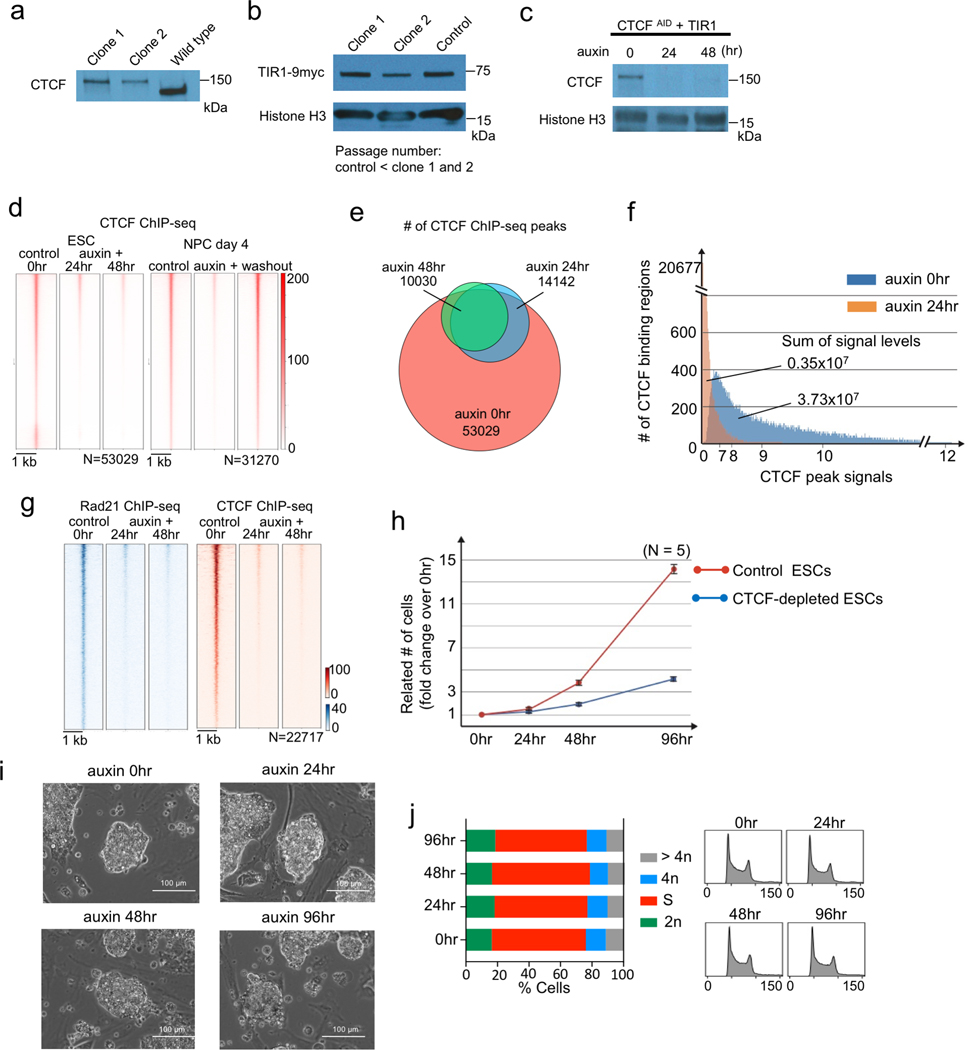
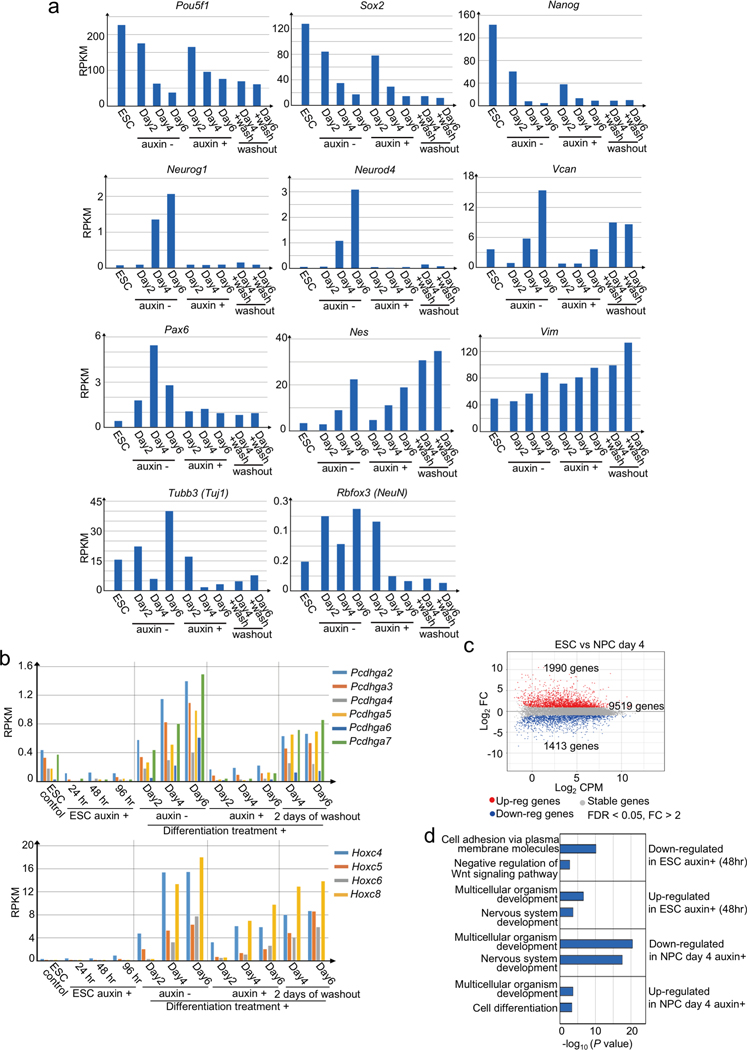
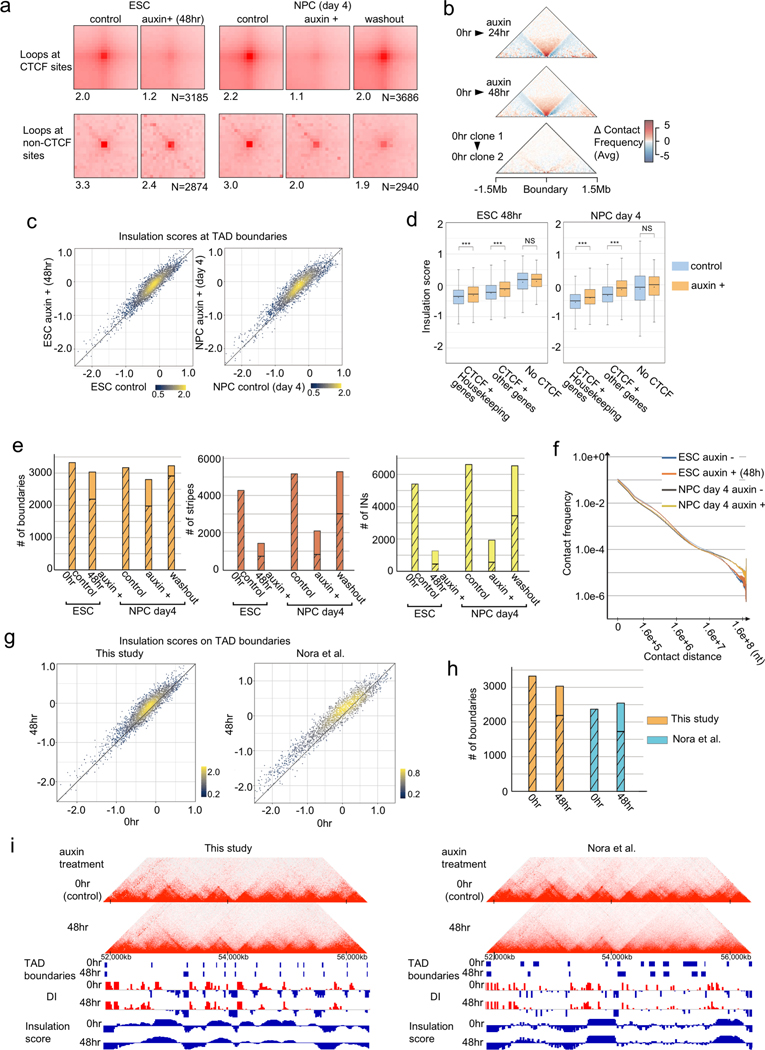
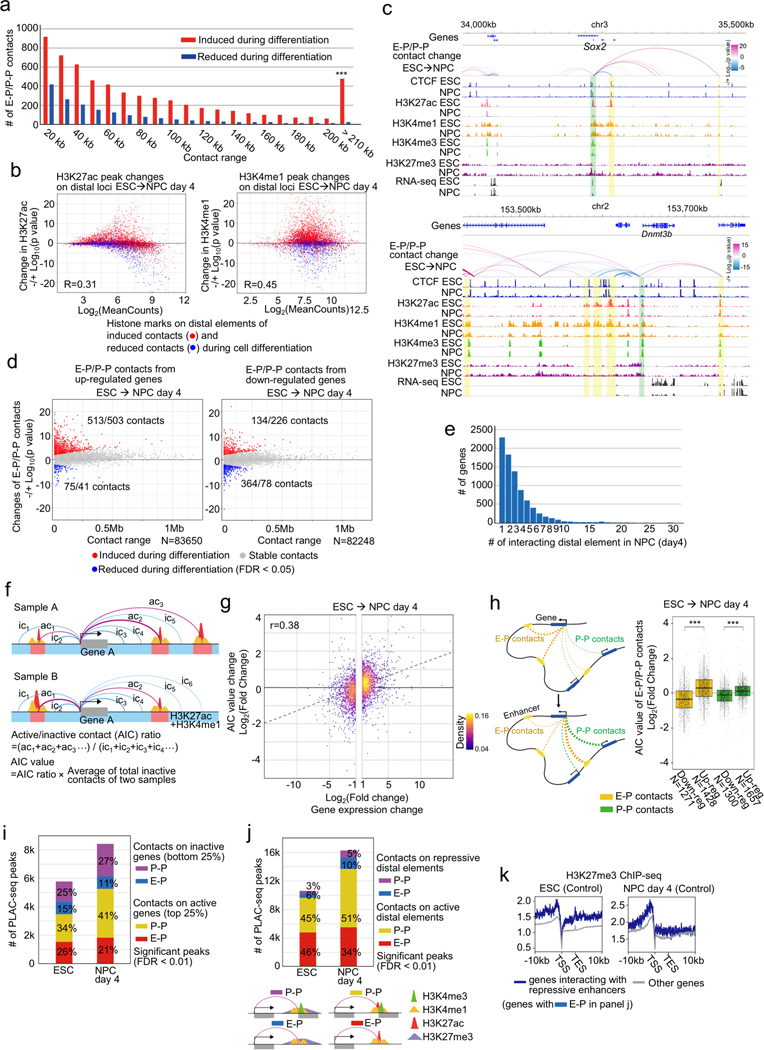
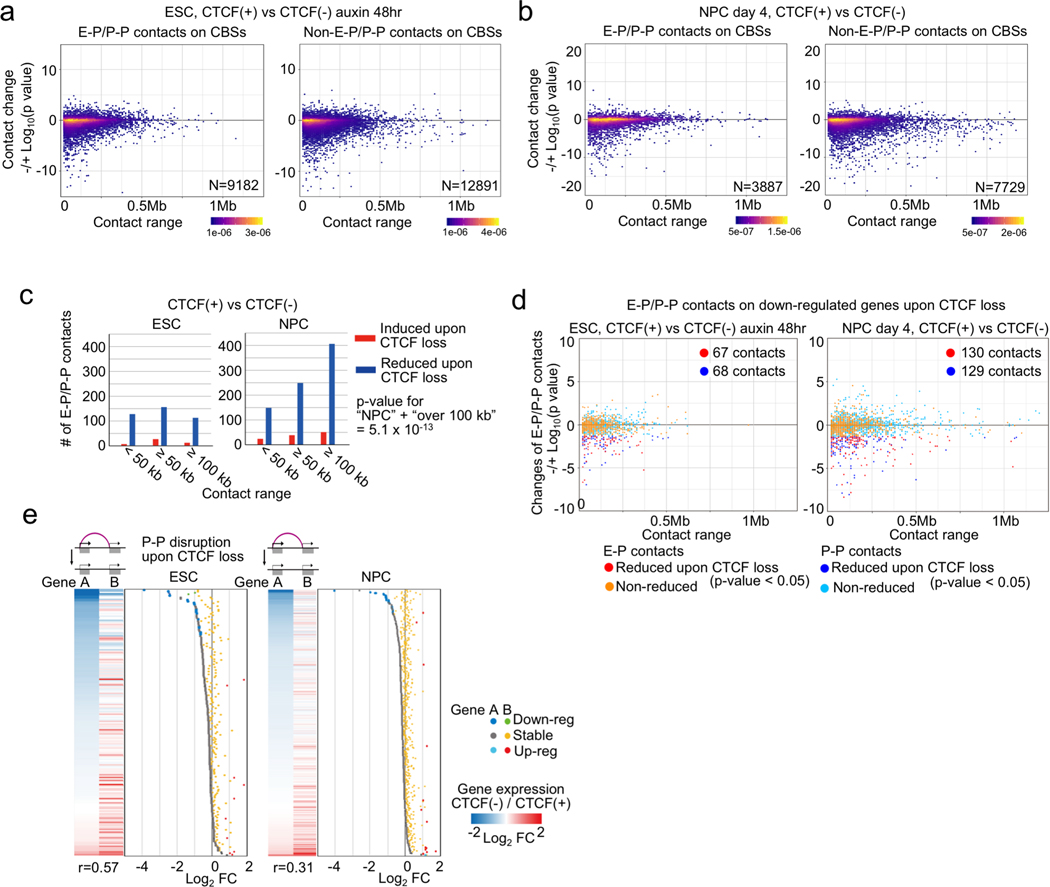
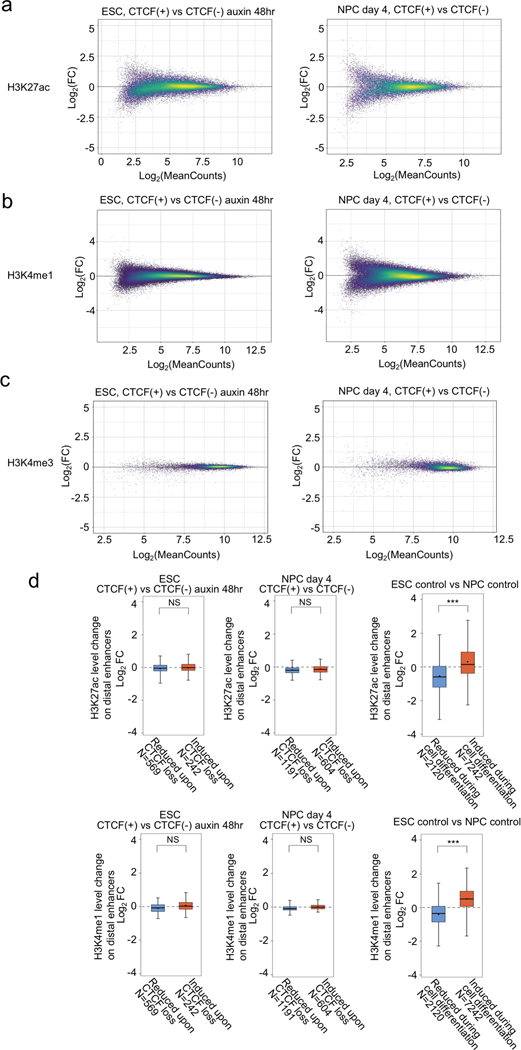
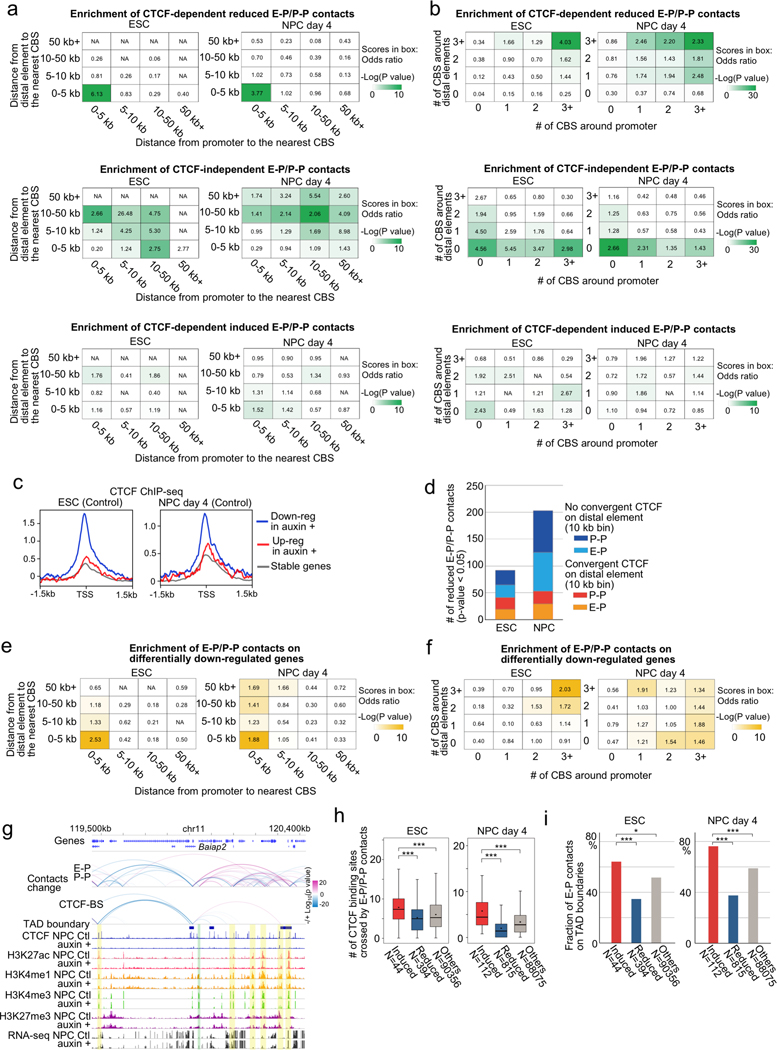
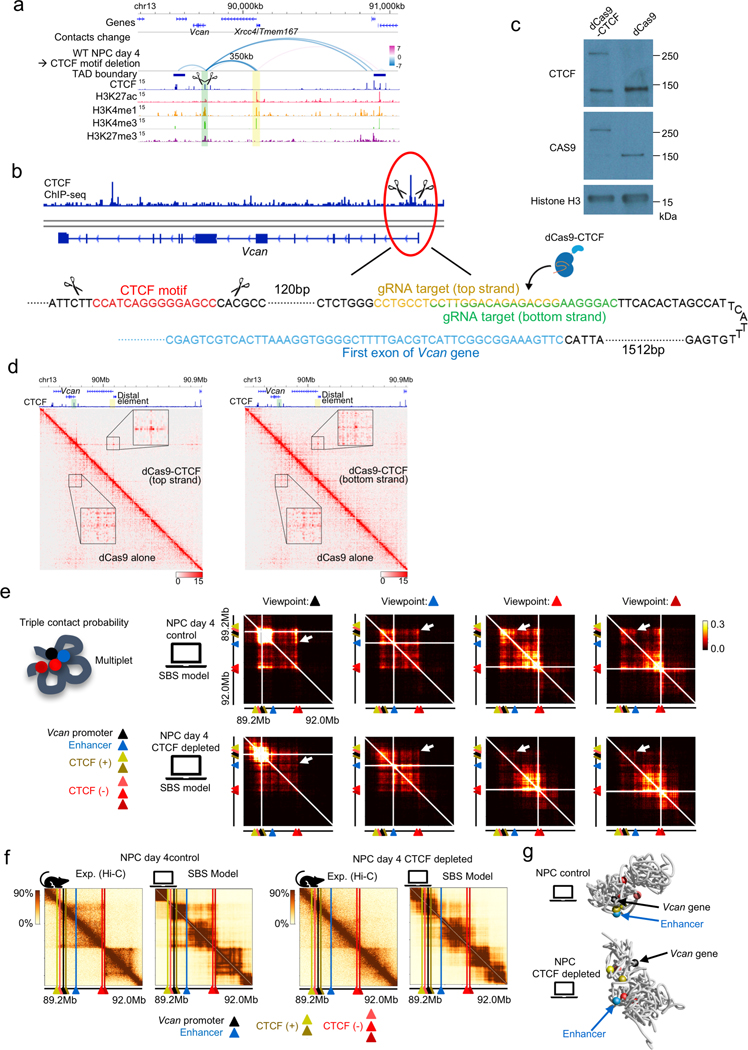
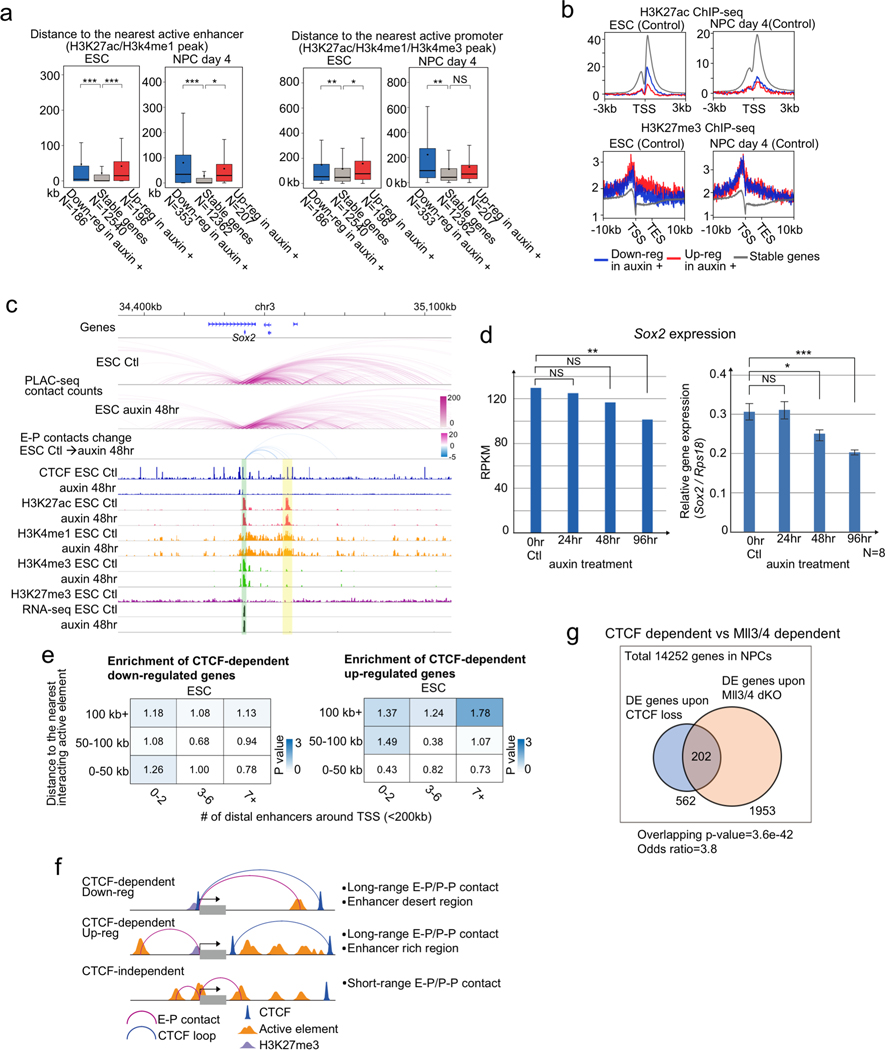
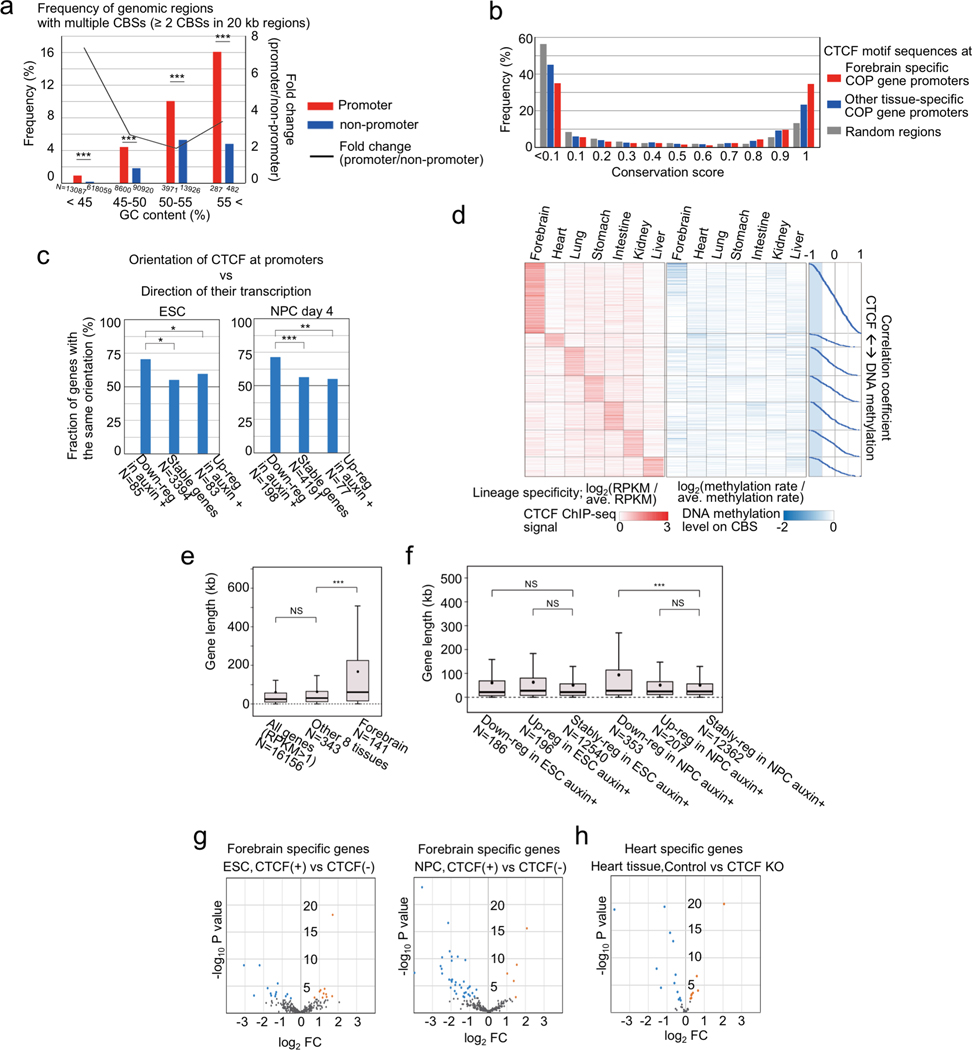
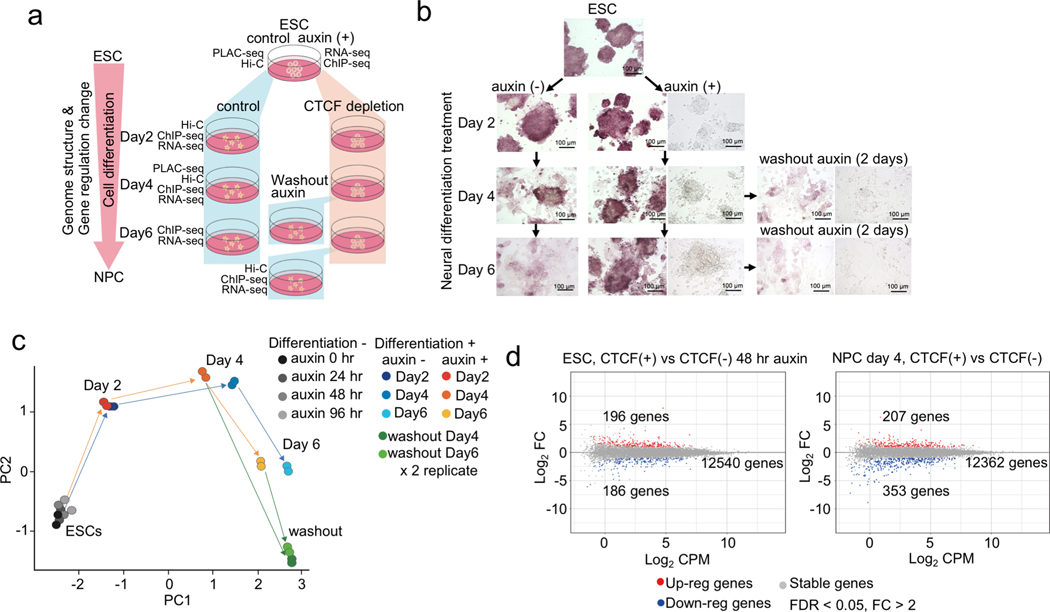
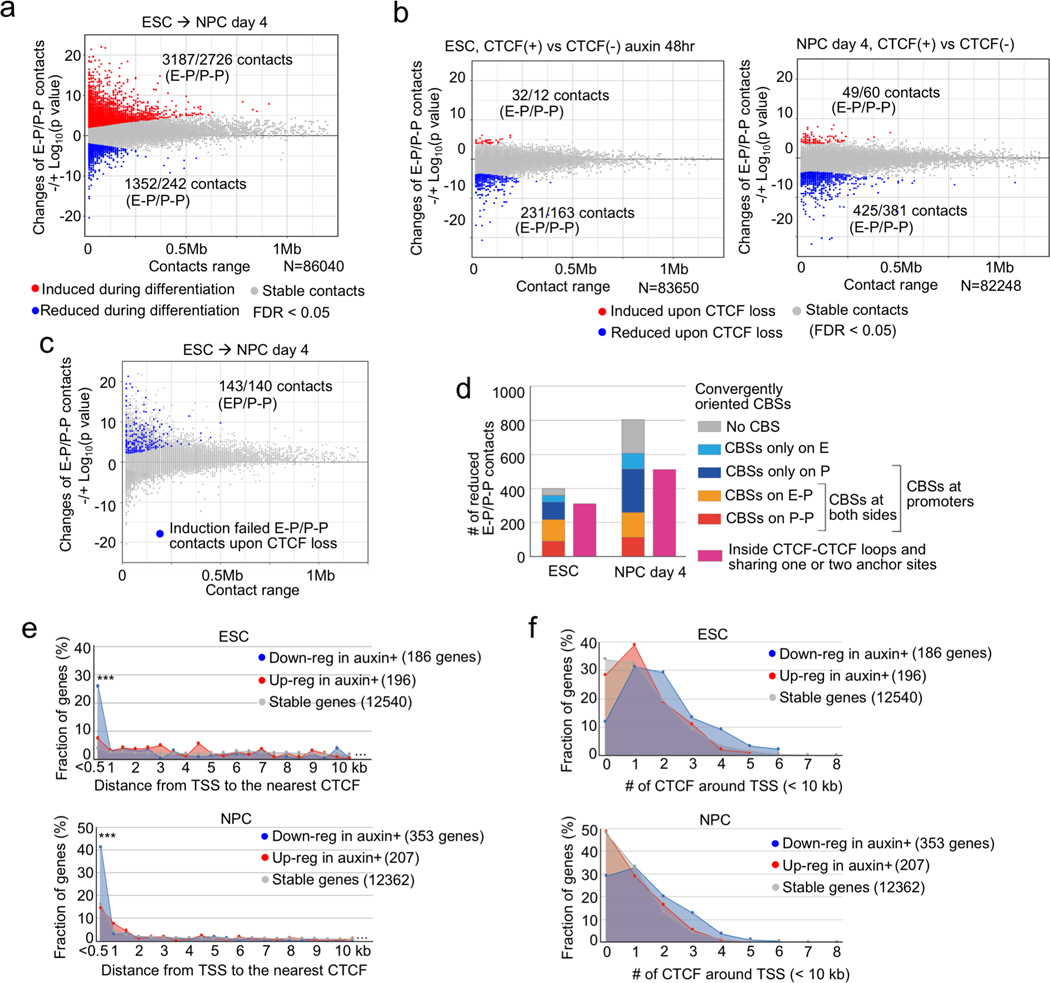
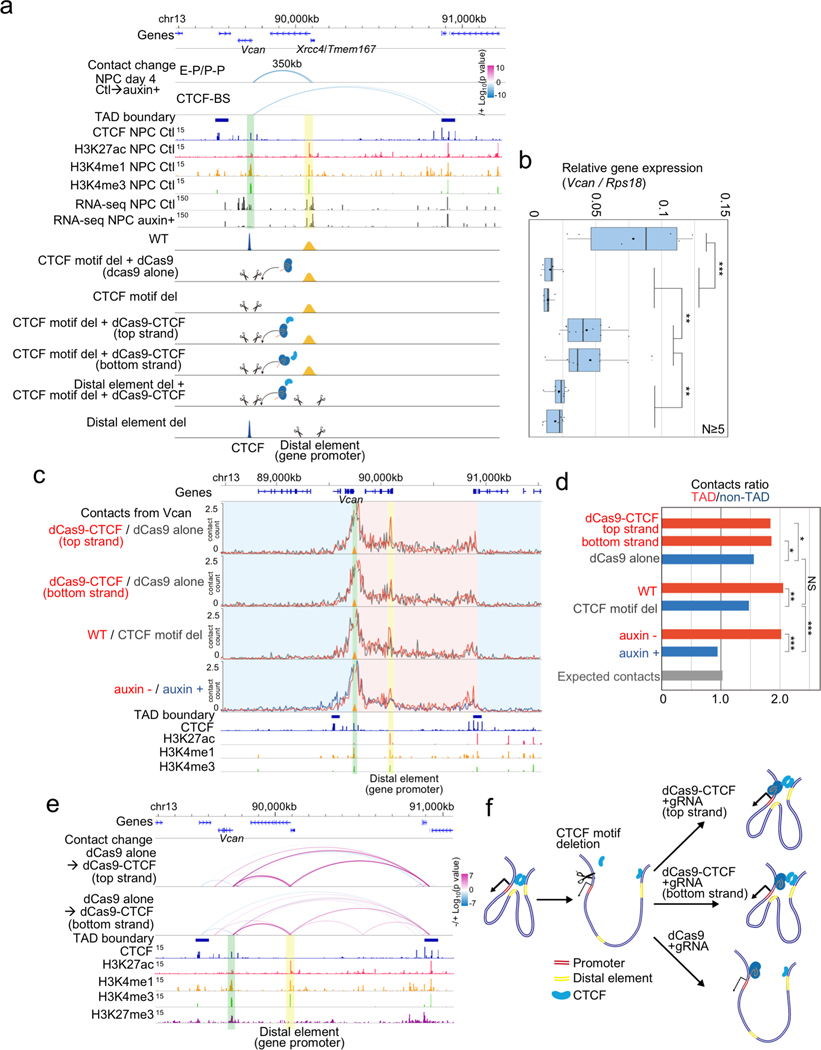
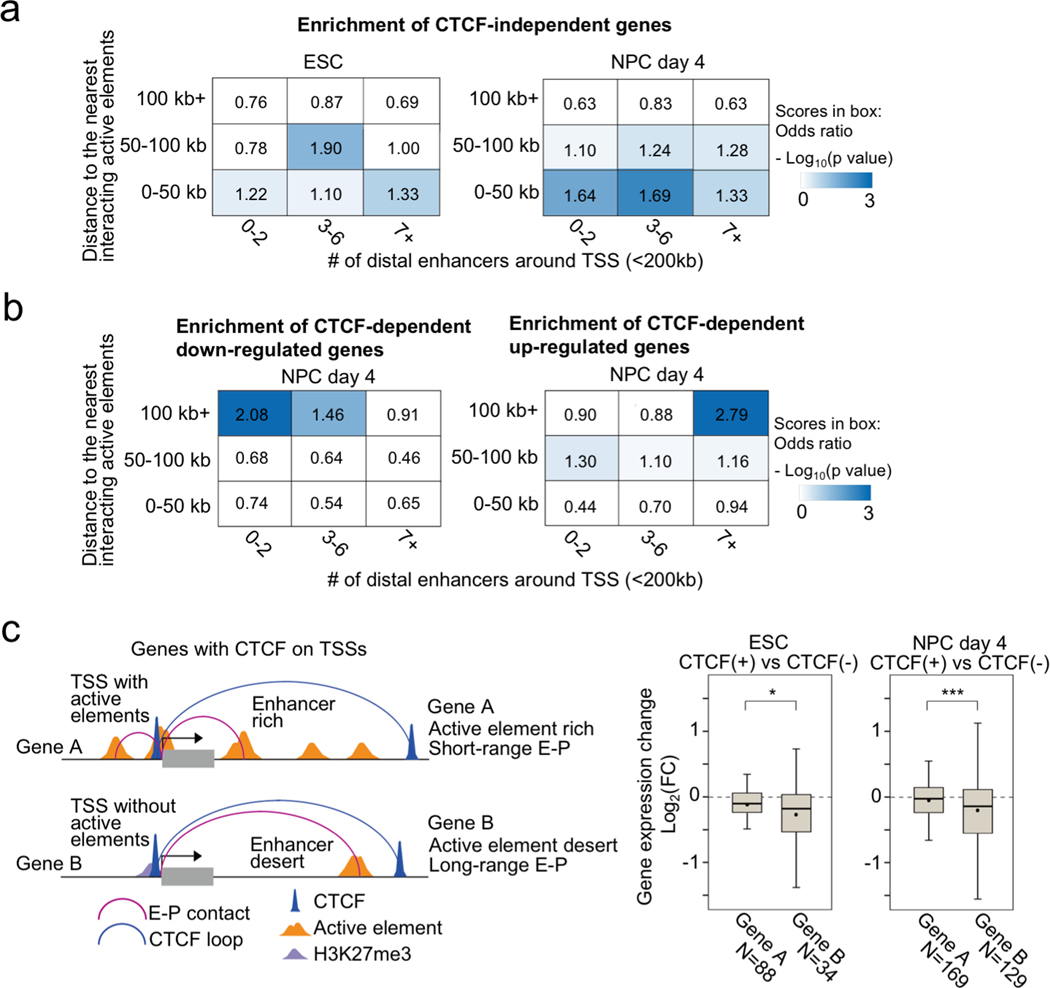
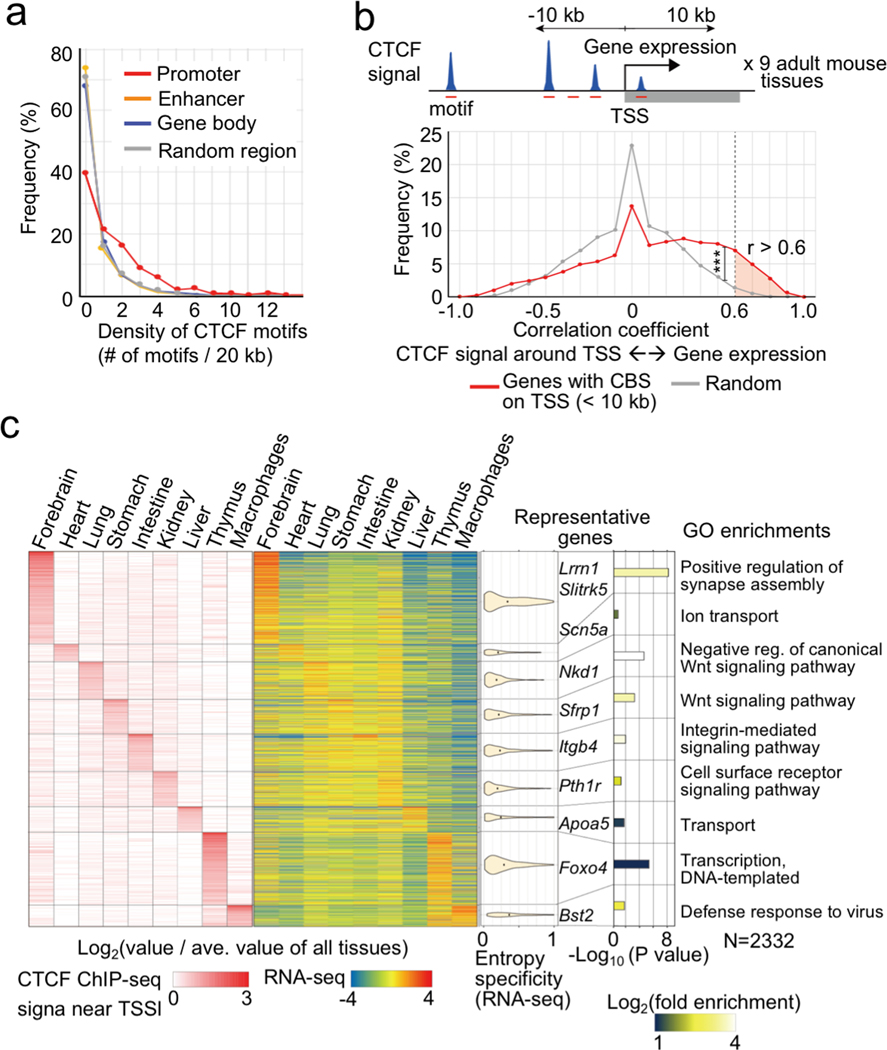
The CCCTC-binding factor (CTCF) works together with the cohesin complex to drive the formation of chromatin loops and topologically associating domains, but its role in gene regulation has not been fully defined. Here, we investigated the effects of acute CTCF loss on chromatin architecture and transcriptional programs in mouse embryonic stem cells undergoing differentiation to neural precursor cells. We identified CTCF-dependent enhancer-promoter contacts genome-wide and found that they disproportionately affect genes that are bound by CTCF at the promoter and are dependent on long-distance enhancers. Disruption of promoter-proximal CTCF binding reduced both long-range enhancer-promoter contacts and transcription, which were restored by artificial tethering of CTCF to the promoter. Promoter-proximal CTCF binding is correlated with the transcription of over 2,000 genes across a diverse set of adult tissues. Taken together, the results of our study show that CTCF binding to promoters may promote long-distance enhancer-dependent transcription at specific genes in diverse cell types.


Figures

Extended Data Fig. 1
Extended Data Fig. 1. Depletion of CTCF and characterization of CTCF-depleted cells.
a, b, Western blot showing AID-tagged CTCF and wild type CTCF (a) and the expression of TIR1 protein in two mESC clones. TIR1 expression in these clones that went through multiple passages was comparable to that in control cells with lower passage number. Uncropped images are available as source data online. c, Western blot showing acute depletion of CTCF protein after 24 and 48 hours of auxin treatment. Uncropped images are available as source data online. d, Heatmaps showing CTCF ChIP-seq signals centered at all regions of CTCF peaks identified in the control cells and CTCF occupancy at the same regions in CTCF-depleted cells at each time point of differentiation. e, Venn-diagram comparing the number of CTCF ChIP-seq peaks identified in control and CTCF-depleted ESCs at each time point. f, Histogram showing the number of CTCF binding regions in y-axis and the associated CTCF ChIP-seq signal level in x-axis. The CTCF signal levels in control cells and auxin treated cells were calculated for CTCF peak regions identified in the control cells. g, Heatmaps comparing Rad21 ChIP-seq signals centered at all regions of Rad21 peaks identified in control and CTCF-depleted ESCs at each time point (left, blue heat map). CTCF occupancy are also shown (right, red heat map). h, Growth curves of mouse ESCs with or without auxin treatment. Date are plotted as averages +/− standard deviation (n=5 independent experiments). I, Bright-field microscopy images of mouse ESC colonies before and after auxin treatment. j, Cell cycle analysis by flow cytometry using propidium iodide staining in control ESCs and after 24, 48, and 96 hours of auxin treatment.
Extended Data Fig. 2
Extended Data Fig. 2. Transcriptional changes during neural differentiation of control and CTCF-depleted mES cells.
a, Gene expression profiles of pluripotent marker genes (Pou5f1, Sox2, Nanog) and examples of induction failure gene upon CTCF loss that is important for nervous system development (Neurog1, Neurod4, Vcan, Pax6, Tubb3 (Tuj1), Rbfox3 (NeuN)) in control and CTCF-depleted cells during differentiation from ESC to NPC and 2 days after washing out of auxin in NPCs. b, Gene expression profiles of Pcdhga and Hoxc gene clusters during multiple days of auxin treatment in ESCs and during differentiation from ESC to NPC in control and CTCF-depleted cells followed by washing out auxin in NPCs. c, Transcriptional changes between control ESCs and NPCs (day 4). Differentially up-regulated and down-regulated genes are plotted in red and blue, respectively (fold change > 2, FDR < 0.05). d, Top two enriched GO terms of the sets of differentially expressed genes upon CTCF loss are shown along with p values (Fisher’s exact test).
Extended Data Fig. 3
Extended Data Fig. 3. Global disruption of chromatin architecture upon CTCF loss.
a, APA on Hi-C peak loci (> 100-kb looping range) on convergent CTCF binding sites identified in control ESCs (n=3185) and NPCs (n=3686) and on Hi-C peak loci that have no CBSs (n=2874 (ESCs), n=2940 (NPCs). Scores on the bottom represent focal enrichment of peak pixel against pixels in its lower left. b, Aggregate boundary analysis showing average change in boundary strength between samples. Each triangle is a contact map of the difference in the average contact profile at TAD boundaries between two time points. The bottom column shows difference in the average boundary profile between the two control samples. c, Scatter plots of insulation scores at TAD boundaries in control and auxin treated ESCs (left) and NPCs (right). A higher score denotes lower insulation. d, Boxplots showing insulation scores at TAD boundaries that overlapped with housekeeping genes and CBSs, with other genes and CBSs, and TAD boundaries without CBSs in control and auxin treated ESCs and NPCs. All boxplots hereafter are defined as: Central bar, median; lower and upper box limits, 25th and 75th percentiles, respectively; whiskers, minimum and maximum value within the rage of (1st quartile-1.5*(3rd quartile- 1st quartile)) to (3rd quartile+1.5*(3rd quartile- 1st quartile)). *** p value < 0.001, two-tailed t-test. e, The number of TAD boundaries (left), stripes (middle), and insulated neighborhoods (INs) in control, CTCF-depleted, and auxin washout cells. Hatched bars indicate overlap with control cells. f, Hi-C contact frequencies at each genomic distance. g–i, Comparison of Hi-C datasets generated in this study and by Nora et al.. Scatter plots of insulation scores at all TAD boundaries (g). Number of TAD boundaries in control and CTCF-depleted cells from both studies. Hatched bars indicate the overlap with control cells (h). Genome browser snapshots showing Hi-C contact heatmaps, TAD boundaries, directionality indices (DIs), and insulation scores analyzed in the two independent studies at the same genomic region in control and CTCF-depleted cells (i).
Extended Data Fig. 4
Extended Data Fig. 4. Features of E-P and P-P contacts that change during neural differentiation in control cells.
a, Histogram showing the number of significantly induced (red) and reduced (blue) E-P contacts between ESCs and NPCs and their genomic distances. *** p value < 0.001, Pearson’s Chi-squared test. b, Scatter plots showing changes of H3K27ac and H3K4me1 ChIP-seq signals at distal elements that display significantly induced (red) or reduced (blue) E-P or P-P contacts during neural differentiation. c, Genome browser snapshots of Sox2 (top) and Dnmt3b (bottom) loci. Arcs show changes of H3K4me3 PLAC-seq contacts on active elements and promoters between ESCs and NPCs (see Methods for details). The colors of arcs represent degrees of interaction change between samples (blue to red, −/+log10(p-value)) (Fisher’s exact test). Promoter regions of Sox2 and Dnmt3b and interacting enhancer regions are shown in green and yellow shadows, respectively. CTCF, H3K4me1, H3K27ac, H3K4me3, H3K27me3 ChIP-seq and RNA-seq in ESCs and NPCs (day 4) are also shown. d, Scatter plots showing changes of E-P or P-P contacts anchored on up-regulated (left) and down-regulated (right) genes between ESCs and NPCs. Genomic distances between their two loop anchor sites are plotted on x-axis. Significantly induced and reduced chromatin contacts are shown as red and blue dots, respectively (FDR < 0.05). e, Histogram showing the number of genes and the number of their interacting distal elements in NPCs. Genes without significant chromatin contacts were removed in this analysis. f, Schematic representation of the AIC model to compute the correlation between changes of multiple E-P contacts and gene expression levels. H3K27ac and H3K4me1 peaks are shown as red and yellow peaks, respectively, and regions where these two types of peaks overlap are defined as active elements (red colored regions). Promoter-centered chromatin contacts on these active elements are shown as red arcs (active contacts) and other chromatin contacts are shown as blue arcs (inactive contacts). AIC ratio and value was calculated as indicated on the bottom (see Methods for details). g, Scatter plots showing changes of AIC values and gene expression levels in differentially expressed genes during neural differentiation with linear approximation. h, (Left) Schematic representation of a model to calculate AIC values using only P-P or E-P contacts. Promoter-centered chromatin contacts on active enhancers are shown as yellow arcs and chromatin contacts on other promoters are shown as green arcs. AIC ratios and values of P-P contacts and E-P contacts to other inactive contacts were calculated as shown in panel f. (Right) Box plots showing changes of the AIC values of P-P and E-P contacts in differentially expressed genes. The number of data points is indicated on the bottom. *** p value < 0.001, two-tailed t-test. i, Histogram of the number of significant PLAC-seq peaks (FDR < 0.01) on P-P and E-P pairs anchored on active and inactive genes (top and bottom 25% of gene expression) in ESCs and NPCs. j, Histogram showing the number of significant PLAC-seq peaks (FDR < 0.01) on P-P and E-P pairs anchored on active distal elements (presence of H3K4me1 and H3K27ac) and repressive distal elements (presence of H3K4me1 and H3K27me3, but not H3K27ac peaks) in ESCs and NPCs. Schematic representation of each type of chromatin contact is shown on the bottom. k, Average enrichments of H3K27me3 ChIP-seq signals on TSSs and TESs of genes that interact with repressive distal enhancers identified in panel (j). H3K27me3 ChIP-seq signals on other genes are shown as control.
Extended Data Fig. 5
Extended Data Fig. 5. Changes of chromatin contacts upon acute CTCF loss illuminate relationship between CTCF-dependent P-P contacts and gene regulation.
a, b, Scatter plots showing changes of H3K4me3 PLAC-seq contacts (y-axis) on convergently oriented CBSs and their loop ranges (x-axis). Chromatin contacts in CTCF-depleted cells were compared to the chromatin contacts in control cells in ESC (a) and NPC stage (day 4) (b). The plots were classified based on whether they are on promoters and enhancers (E-P and P-P) (left) or not (right). c, Histograms showing the number of significantly changed E-P(P-P) contacts upon CTCF loss and their genomic distances in ESC (left) and NPC (right) stages. Significantly induced and reduced contacts are shown as red and blue bars, respectively. P value: Pearson’s Chi-squared test for the comparison of the number of chromatin contacts that were long-range (≥ 100 kb) or not between the ESCs and NPCs. d, Scatter plots showing changes of E-P(P-P) contacts anchored on CTCF-dependent down-regulated genes in ESC (left) and NPC stage (right). Chromatin contacts were classified based on whether they were E-P or P-P contacts (red vs blue dots). Their genomic ranges are plotted in x-axis. The number of reduced E-P and P-P contacts are also shown, respectively (p value < 0.05). e, Heatmaps and dotplots showing gene expression changes (fold change, FC) of genes that lost P-P contacts upon CTCF loss in ESC (left) and NPC (right) stages. Each gene pair interacting through CTCF-dependent P-P contacts is shown as either Gene A or Gene B. Gene A have a lower log2-FC than Gene B. Pearson Correlation coefficients (r) between the gene expression changes of the two paired genes are shown on the bottom of the heatmaps. Blue and green dots; down-regulated gene A and B (FDR < 0.05), gray and yellow dots; stably regulated gene A and B, light blue and red dots; up-regulated gene A and B (FDR < 0.05).
Extended Data Fig. 6
Extended Data Fig. 6. CTCF loss does not measurably alter histone modification at promoters and enhancers.
a–c, Scatter plots showing the changes of H3K27ac (a) and H3K4me1 (b) ChIP-seq signal levels upon CTCF loss on all significant peak regions in ESCs (left) and NPCs (right). The changes of H3K4me3 ChIP-seq signal levels on all peak regions on transcription start sites (TSSs) are also shown (c). d, Boxplots showing the changes of H3K27ac (top) and H3K4me1 (bottom) ChIP-seq signal levels on distal element loci of all analyzed E-P contacts. The changes upon CTCF depletion in ESC (left) and NPC stage (middle) and the changes during neural differentiation (right) are shown. The numbers of data points are also indicated on the bottom. NS not significant, *** p value < 0.001, two-tailed t-test.
Extended Data Fig. 7
Extended Data Fig. 7. Features of CTCF-dependent/-independent E-P and P-P contacts.
a, b, Enrichment analysis of CTCF-dependent reduced E-P and P-P contacts (top), CTCF-independent E-P and P-P contacts (middle), and CTCF-dependent induced E-P and P-P contacts (bottom). Chromatin contacts were categorized based on the distance from the loop anchor sites on the distal element side (vertical columns) or promoter side (horizontal columns) to the nearest CBS (a) or based on the number of CBSs around loop anchor sites (10 kb bin ±5kb) on the distal element side (vertical columns) or promoter side (horizontal columns) (b). Enrichment values are shown by odds ratio (scores in boxes) and p-values (color) in ESCs (left) and NPCs (right) (see Methods). c, Average enrichment of CTCF ChIP-seq signals on TSSs of CTCF-dependent up-regulated (red) or down-regulated (blue) and CTCF-independent genes (gray) in ESCs (left) and NPCs (right). d, Histograms showing the number of reduced CTCF-dependent E-P and P-P contacts (p value < 0.05) anchored on CTCF-dependent down-regulated gene promoters with CBSs (TSS ± 5 kb) in ESCs (left) and NPCs (right). Chromatin contacts were classified based on whether their interacting distal elements were anchored on convergent CTCF or not (within 10 kb bin). e, f, Enrichment analysis of E-P and P-P contacts anchored on CTCF-dependent down-regulated genes categorized based on the distance from the loop anchor sites on the distal element side (vertical columns) or promoter side (horizontal columns) to the nearest CBS (e). The same enrichment analysis categorized based on the number of CBSs around loop anchor sites (10 kb bin ±5kb) on distal element side (vertical columns) or promoter side (horizontal columns) (f). Enrichment values shown by odds ratio (scores in boxes) and p-values (color) in ESCs (left) and NPCs (right) (see Methods). g, Genome browser snapshots of the Baiap2 locus. Arcs show changes of chromatin contacts on E-P and on CBSs. The colors of arcs represent change from control cells to CTCF-depleted cells (blue to red, −/+log10(p-value)). Promoter regions of Baiap2 and interacting enhancer regions are shown in green and yellow shadows, respectively. CTCF, H3K4me1, H3K27ac, H3K4me3, H3K27me3 ChIP-seq, and RNA-seq in control and CTCF-depleted NPCs, and TAD boundaries in control cells are also shown. h, Boxplots showing the number of CBSs located between two anchor sites of significantly induced (red) or reduced (blue) E-P contacts upon CTCF loss, and CTCF-independent E-P contacts (gray). The numbers of data points are indicated on the bottom. *** p value < 0.001, two-tailed t-test. i, The fraction of E-P and P-P contacts that overlapped with TAD boundaries in ESCs (left) and NPCs (left). The numbers of data points are indicated on the bottom. * p value < 0.05, *** p value < 0.001, Pearson’s Chi-squared test.
Extended Data Fig. 8
Extended Data Fig. 8. SBS polymer model and rescue experiments using dCas9-CTCF.
a, Genome browser snapshots of the Vcan locus. Arcs show changes of chromatin contacts anchored on the Vcan promoter, distal enhancer, and CBSs identified s between wild type NPCs and NPCs in which promoter-proximal CTCF motif sequences were deleted. The colors of arcs represent degrees of interaction change upon the deletion of CTCF motif sequences (blue to red, −/+log10(p-value)). The promoter region and interacting enhancer region are shown in green and yellow shadows, respectively. CTCF, H3K27ac, H3K4me1, H3K4me3, and H3K27me3 ChIP-seq, and TAD boundaries in wild type NPCs are also shown. b, Schematic representation of the dCas9-CTCF rescue experiments. c, Western blot of cells lysates expressing dCas9-CTCF or dCas9 control plasmids. Uncropped images are available as source data online. d, Snapshots of heatmaps around Vcan showing mapped reads of PLAC-seq in dCas9-CTCF (top and bottom strand) and dCas9 control cell lines. Peaks of chromatin contacts between theVcan gene promoter and the downstream distal element are shown in zoom-in. e, SBS model showing triplet interactions between the Vcan promoter (black), distal enhancer (blue) and CBSsthat weaken upon CTCF depletion (white arrows). Heatmaps from each viewpoint in control and CTCF-depleted NPCs are shown. CTCFs (+) (browns) and CTCFs (−) (reds) are convergently oriented. f, Hi-C contact maps (left) of the Vcan locus in control and auxin treated NPCs and the SBS polymer model (right) (HiCRep stratum adjusted correlation SCC = 0.76 and SCC = 0.62 respectively). Genomic positions of Vcan promoter (black), distal enhancer (blue) and relevant motif-oriented CBSs (brown and red) are shown by colored triangles. g, SBS derived 3D structures of the Vcan locus in control and CTCF-depleted NPCs, with relevant elements indicated by colored beads (color as in (b)).
Extended Data Fig. 9
Extended Data Fig. 9. Mechanisms of CTCF-dependent/-independent gene regulation.
a, Boxplots showing the distance from TSS to the nearest enhancer (left) and promoter (right) region in ESCs and NPCs. Red: CTCF-dependent up-regulated genes, blue: CTCF-dependent down-regulated genes, gray: CTCF-independent stably regulated genes. The numbers of genes analyzed in each group are indicated on the bottom. *** p value < 0.001, ** p value < 0.01, * p value < 0.05, two-tailed t-test. b, Average enrichment of H3K27ac ChIP-seq signals on TSSs of CTCF-dependent up-regulated (red), and down-regulated (blue) genesand CTCF-independent genes (gray) in ESCs (left) and NPCs (right). Average enrichment of H3K27me3 ChIP-seq signals on TSSs and TESs are also shown (bottom). c, d, Genome browser snapshot of the Sox2 locus (c) whose reduction of expression level was moderate 24 or 48 hours after CTCF depletion in ESCs in RNA-seq and qPCR (d). The arcs show PLAC-seq contact counts in control (top) and CTCF-depleted ESCs (middle) at every 10-kb bin. Changes of chromatin contacts on enhancers and the Sox2 promoter are also shown (bottom). Sox2 gene promoter and interacting super enhancer are shown in green and yellow shadows, respectively. CTCF, H3K4me1, H3K27ac, H3K4me3, and H3K27me3 ChIP-seq, RNA-seq in control and CTCF-depleted ESCs are shown. The error bars in the right panel of (d) indicate standard deviation of 8 independent experiments. RPKM values were calculated from two RNA-seq replicates. NS not significant, * p value < 0.05, ** p value < 0.01, *** p value < 0.001, two-tailed t-test. e, Enrichment analysis of CTCF-dependent down-regulated (left) and up-regulated (right) genes categorized based on the distance to the nearest interacting enhancer (vertical columns) and the number of enhancers around TSS (< 200 kb) (horizontal columns) in ESCs. Enrichment values are shown by odds ratio (scores in boxes) and p-values (color). The distance to the nearest interacting enhancer is represented by the shortest genomic distance of significant PLAC-seq peaks on enhancers and promoters (p-value < 0.01). (see Fig. 4b for the same analysis in NPCs). f, Model for the general features of CTCF-dependent down-regulated (top), up-regulated genes (middle), and CTCF-independent genes (bottom). g, Venn-diagram showing overlapping between CTCF dependent genes and Mll3/4 dependent genes in NPCs. Statistical significance based on Fisher’s exact test. Odds ratio represents the strength of association.
Extended Data Fig. 10
Extended Data Fig. 10. Features of tissue-specific CTCF occupied promoter genes.
a, Histogram showing frequencies of genomic regions with 2 or more CBSs in all analyzed 9 tissues, classified based on GC content levels. Black line shows fold change between the two groups. Total numbers of genomic regions analyzed in each group are indicated on the bottom. *** p value < 0.001, two-tailed t-test. b, Histogram showing frequencies of CTCF motif sequences and their PhastCons conservation scores. c, Histogram showing the fractions of genes whose promoter CTCF binding motifs were the same direction with the orientation of transcription. The fractions in CTCF-dependent down-and up-regulated genes and CTCF-independent genes in ESCs and NPCs are shown. The numbers of genes analyzed in each group are indicated on the bottom. * p value < 0.05, ** p value < 0.01, *** p value < 0.001, Pearson’s Chi-squared test. d, Heatmap showing lineage-specific DNA methylation levels at CBSs (motif sequences ±100 bp) in promoter regions of genes shown in Fig. 5c. The DNA methylation levels at multiple CBSs in the same promoter region (TSS ±10 kb) were averaged. Lineage-specificity of DNA methylation levels shown in the heatmap are calculated by log2(DNA methylation level / average methylation level of all tissues). The heatmap was sorted by correlation coefficient between CTCF ChIP-seq signal levels and DNA methylation levels across multiple tissues in each group. Each correlation coefficient is shown in the scatter plots (right) (r < −0.5, highlighted in blue). e, Boxplots showing length of lineage-specific genes with CTCF occupied promoter that had high correlation coefficient (> 0.6) in Fig 5b, c. Forebrain-specific genes and other lineage-specific genes are shown at right and middle, respectively. All genes whose RNA-seq RPKM value is more than 1 in at least one tissue sample were used as control (left). The numbers of genes analyzed in each group are indicated on the bottom. NS not significant, *** p value < 0.001, two-tailed t-test. f, Boxplots showing gene length of CTCF-dependent down-regulated, up-regulated and CTCF-independent genes in ESCs and NPCs. The numbers of genes analyzed in each group are indicated on the bottom. NS not significant, *** p value < 0.001, two-tailed t-test. g, Volcano plots showing the gene expression changes of the forebrain-specific CTCF-occupied genes between control cells and CTCF-depleted cells in ESCs (left) and NPCs (right). h, Volcano plots showing gene expression changes of heart-tissue-specific CTCF-occupied genes between control heart tissue and CTCF knockout heart tissue.
Fig. 1 |
Fig. 1 |. CTCF loss impedes cell differentiation from ESC to NPC.
a, Schematic representation of experimental design and sample preparation. The auxin-inducible degron system was used to deplete CTCF during cell differentiation from ESCs to NPCs (day 2, 4, 6). An additional 2 days of neural differentiation was performed after washing out auxin for day 4 and day 6 differentiated cells. Types of experiments performed at each time point are indicated. b, Microscopic images of cells under the treatment regime described in (a). Alkaline phosphatase staining was performed at every time point. Non-stained bright-field images of each auxin treated sample and auxin washout sample are also shown on the right. c, Principal component analysis of gene expression profiles of control and CTCF-depleted cells at each time point of cell differentiation and 2 days after washing out auxin. Gene expression profiles in ESCs with multiple days of auxin treatment (24, 48, and 96 hours) were also analyzed. Two replicates of each sample are shown. d, Gene expression changes upon CTCF depletion in ESCs (left, 48 hours with or without auxin) and in differentiated cells (right, differentiation day 4 with or without auxin). Differentially up-regulated and down-regulated genes are plotted in red and blue, respectively (fold change > 2, FDR < 0.05).
Fig. 2 |
Fig. 2 |. CTCF loss reduces promoter-anchored contacts at a modest number of genes.
a, b, Scatter plots showing genome-wide changes of chromatin contacts anchored on promoters and enhancers (y-axis) identified in differential interaction analysis between ESCs and NPCs (a) and between control and CTCF-depleted cells in ESC (b, left) and NPC stage (day 4) (b, right). Genomic distances between their two loop anchor sites are plotted in x-axis. Significantly induced and reduced chromatin contacts are shown as red and blue dots, respectively (FDR < 0.05). The interaction changes are shown by significance value (−/+log10(p-value)) (Fisher’s exact test, n=2 independent experiments). The numbers of significantly changed E-P and P-P contacts are indicated. c, E-P and P-P contacts that were significantly induced during neural differentiation but significantly reduced upon CTCF loss were plotted as blue dots on the scatter plots displayed in (a). The numbers of significantly changed E-P and P-P contacts are indicated. d, Histogram showing the numbers of significantly reduced E-P and P-P contacts upon CTCF loss that were categorized based on whether their anchor sites (10-kb bin) on promoter and enhancer regions have convergently oriented CTCF binding sites (CBSs) or not. Purple bars show the number of E-P and P-P contacts that were located inside CTCF-CTCF loops and whose anchor sites overlapped with at least one anchor site of CTCF-CTCF loops. e, f, Fraction of genes classified based on genomic distance from TSS to the nearest CTCF ChIP-seq peak (e), and fraction of genes classified based on the number of CTCF ChIP-seq peaks around TSS (< 10 kb) (f) are shown. CTCF-depletion induced down-regulated genes (blue), up-regulated genes (red), and CTCF-independent genes (gray) in ESCs (top) and NPCs (bottom) are shown. *** p value < 0.001, Pearson’s Chi-squared test for the comparison of the number of genes that had CTCF at TSS (< 500 bp) or not between down-regulated genes and the other types of genes.
Fig. 3 |
Fig. 3 |. Rescue of CTCF-dependent chromatin contacts and gene activation by artificial tethering of CTCF to the promoter.
a, Genome browser snapshots of a region around the Vcan gene. Arcs show the changes of chromatin contacts on enhancers and promoters (E-P/P-P) and CTCF binding sites (CTCF-BS); colors represent degrees of interaction change (blue to red, −/+log10(p-value)) (Fisher’s exact test, n=2 independent experiments). The Vcan promoter and the 350 kb downstream distal active element (corresponding to the Xrcc4/Tmem167 gene promoter) are shown in green and yellow shadows, respectively. ChIP-seq of H3K27ac, H3K4me3, H3K4me1, RNA-seq, and TAD boundaries in NPCs are also shown. Schematic description of each cell line is shown at the bottom. b, Boxplots of Vcan expression levels for each cell line indicated in (a) after differentiation (NPC). RT-qPCR assay was performed 5 times for each cell line. Central bar, median; lower and upper box limits, 25th and 75th percentiles, respectively; whiskers, minimum and maximum value within the rage of (1st quartile-1.5*(3rd quartile- 1st quartile)) to (3rd quartile+1.5*(3rd quartile- 1st quartile)). ** p value < 0.01 and *** p value < 0.001, two-tailed t-test. c, The effects of artificial tethering of dCas9-CTCF (top and bottom strand) on promoter-anchored contacts at Vcan are compared to dCas9 alone control (red vs gray line). Normalized contact counts of H3K4me3 PLAC-seq (lines in 10-kb resolution) originating from the Vcan promoter (shadowed in green) are shown. Yellow shadow: promoter-promoter contacts. Red shadow: contacts with regions inside TAD. Blue shadow: contacts with regions outside TAD. Wild type cells, Vcan promoter-proximal CBS deleted cells, and auxin treated/untreated cells are shown for comparison. Data merged from two independent experiments are shown in the figure. d, Ratio of total Vcan promoter-anchored contact counts throughout intra-TAD (shadowed in red in (c)) to other total contact counts outside the TAD (shadowed in blue in (c)). (TAD/non-TAD ratio) were computed in each sample. The ratio calculated by expected contact counts in wild type NPCs is shown at the bottom. *** p value < 0.001, ** p value < 0.01, * p value < 0.05, Pearson’s Chi-squared test for the comparison of the total contact counts inside the TAD or outside the TAD between the compared two replicates samples. e, Changes of chromatin contacts upon artificial tethering of CTCF at the promoter on top and bottom strand are shown. The colors of arcs represent degrees of interaction change from control NPCs (dCas9 alone) to dCas9-CTCF tethered NPCs (blue to red, −/+log10(p-value)) (Fisher’s exact test, two independent experiments). f, Schematic representation of observations of the rescue experiments.
Fig. 4 |
Fig. 4 |. General features of CTCF-dependent/-independent genes.
a, Enrichment analysis of CTCF-independent genes categorized based on the distance to the nearest interacting enhancer (vertical columns) and the number of enhancers around TSS (< 200 kb) (horizontal columns) in ESCs (left) and NPCs (right). Enrichment values are shown by odds ratio (scores in boxes) and p-values (color). The distance to the nearest interacting enhancer is represented by the shortest genomic distance of significant PLAC-seq peaks on enhancers and promoters (p-value < 0.01) For details on the odds ratio calculation and statistical analysis, see Methods. b, Enrichment analysis of CTCF-dependent down-regulated genes (left) and up-regulated genes (right) categorized based on the distance to the nearest interacting enhancer (vertical columns) and the number of enhancers around TSS (< 200 kb) (horizontal columns) in NPCs. Enrichment values are shown by odds ratio (scores in boxes) and p-values (color). The distance to the nearest interacting enhancer is represented by the shortest genomic distance of significant PLAC-seq peaks on enhancers and promoters (p-value < 0.01) For details on the odds ratio calculation and statistical analysis, see Methods. Extended Data Fig. 9e shows the same analysis in ESCs. c, Schematic representation of two types of genes with CTCF binding peaks on their TSSs (< 1 kb). For Gene A, the shortest E-P contact (PLAC-seq peak signal p-value < 0.01) is shorter than 50 kb genomic distance and there are 7 enhancers or more around the TSS (< 200 kb). For Gene B, the shortest E-P contact is longer than 50 kb and there are 2 enhancers or less around TSS. Boxplots of gene expression changes upon CTCF loss in Gene A and Gene B classes in ESCs (left) and NPCs (right). Central bar, median; lower and upper box limits, 25th and 75th percentiles, respectively; whiskers, minimum and maximum value within the rage of (1st quartile-1.5*(3rd quartile- 1st quartile)) to (3rd quartile+1.5*(3rd quartile- 1st quartile)). * p value < 0.05 and *** p value < 0.001, two-tailed t-test.
Fig. 5 |
Fig. 5 |. Promoter-proximal CTCF binding correlates with transcription at thousands of mouse genes.
a, Frequency of genomic regions and their density of CTCF motifs bound by CTCF in at least one adult mouse tissue. The genomic regions were classified into promoters, enhancers (identified in ESCs and NPCs), gene bodies, and random regions. b, Schematics of steps to compute the correlation between CTCF occupancy around TSS and transcripts levels across multiple mouse tissues (top, for details see Methods). Frequencies of genes are plotted based on the Pearson Correlation Coefficient between the CTCF ChIP-seq signals around TSS (< 10 kb) and transcripts levels across multiple mouse tissues (red line). The same plots analyzed using randomly shuffled CTCF ChIP-seq datasets are shown in gray as control. *** p value < 0.001, Pearson’s Chi-squared test for the comparison of fraction of genes with positive correlation coefficient (r ≥ 0.6) or others (r < 0.6) between the two groups. c, Heatmaps of lineage-specificity of CTCF ChIP-seq signals around promoters and gene expression levels. Genes with high correlation coefficients (> 0.6) in panel (b) are shown (2,332 genes). Lineage-specificity was calculated as log2(value / average value of all tissues). The violin plots also show the lineage-specificity of transcription measured by Shannon entropy in each gene group. The width is proportional to the sample size. Top enriched GO terms of each group genes are shown with fold enrichment, p-value (Fisher’s exact test), and their representative genes.

References

    1. Heintzman ND et al. Histone modifications at human enhancers reflect global cell-type-specific gene expression. Nature 459, 108–12 (2009). - PMC - PubMed
    1. Long HK, Prescott SL & Wysocka J. Ever-Changing Landscapes: Transcriptional Enhancers in Development and Evolution. Cell 167, 1170–1187 (2016). - PMC - PubMed
    1. Shen Y. et al. A map of the cis-regulatory sequences in the mouse genome. Nature 488, 116–20 (2012). - PMC - PubMed
    1. Andersson R. et al. An atlas of active enhancers across human cell types and tissues. Nature 507, 455–461 (2014). - PMC - PubMed
    1. Consortium EP An integrated encyclopedia of DNA elements in the human genome. Nature 489, 57–74 (2012). - PMC - PubMed

Publication types