. 2021 Feb;22(2):193-204.
doi: 10.1038/s41590-020-00829-6. Epub 2021 Jan 4.

NF-κB-inducing kinase maintains T cell metabolic fitness in antitumor immunity

Affiliations

NF-κB-inducing kinase maintains T cell metabolic fitness in antitumor immunity

Meidi Gu et al. Nat Immunol. 2021 Feb.

Erratum in

Abstract

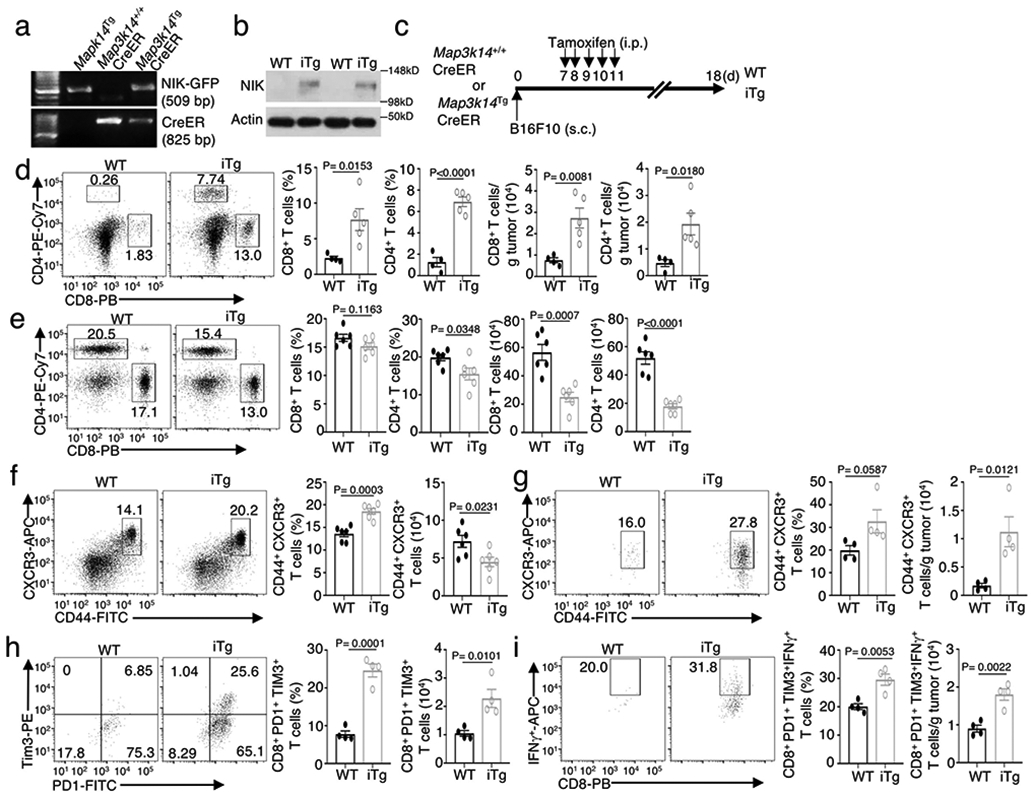
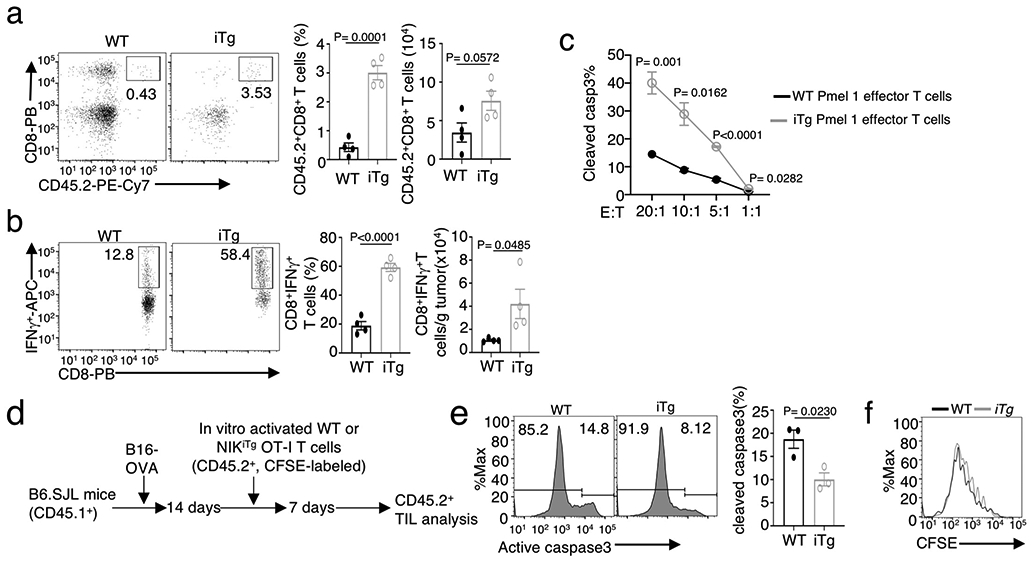
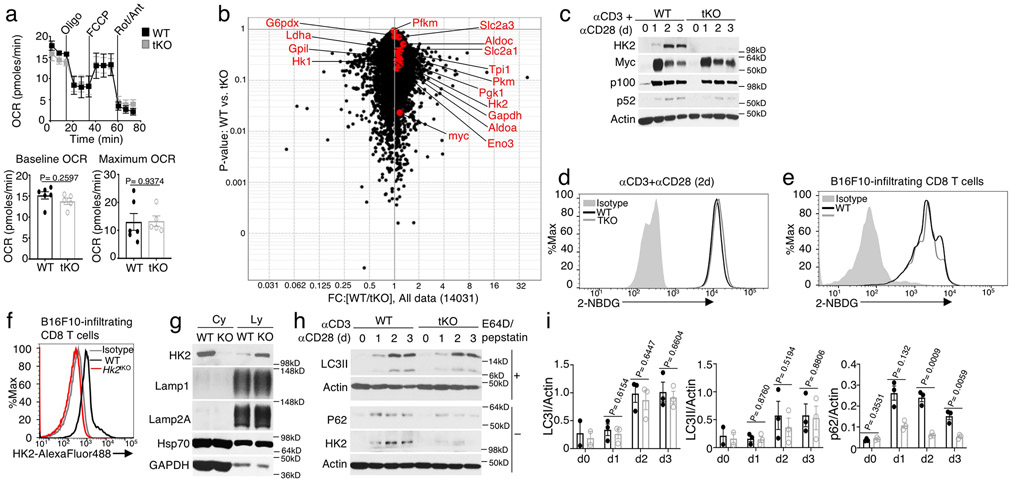
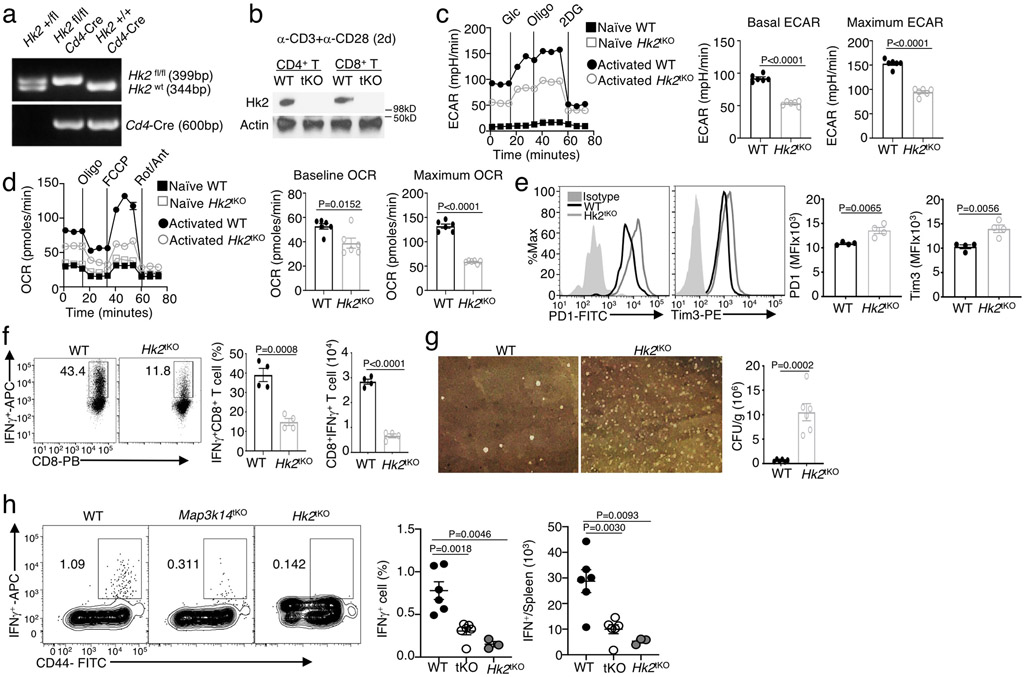
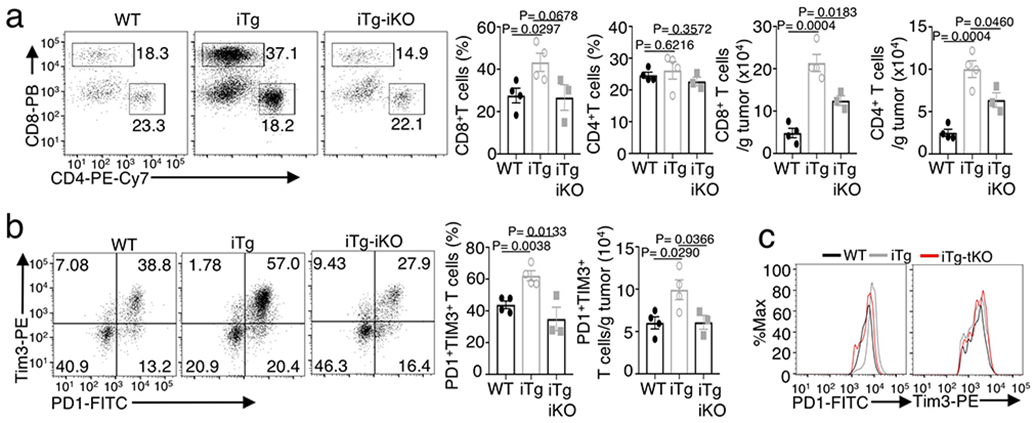
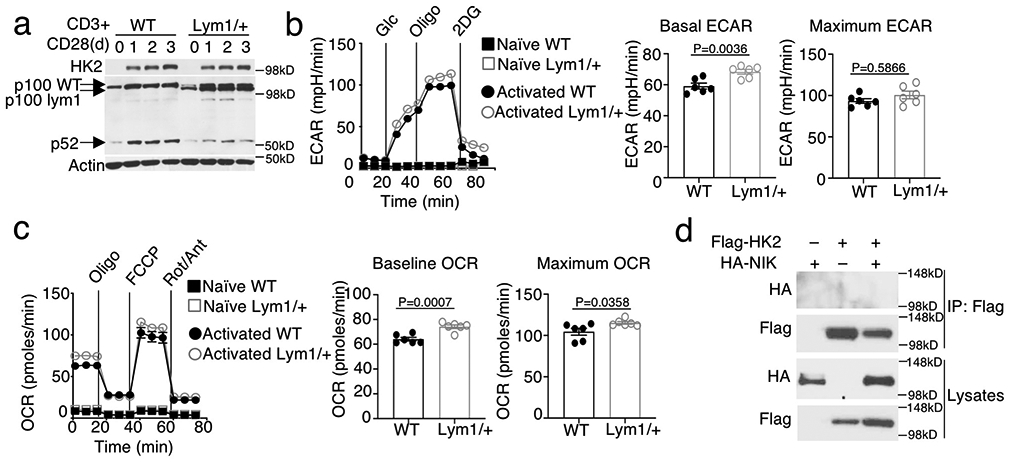
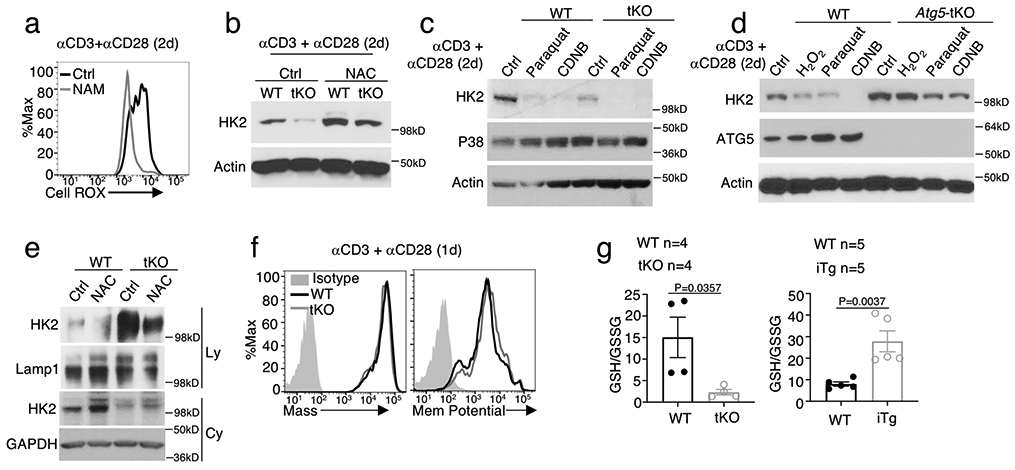
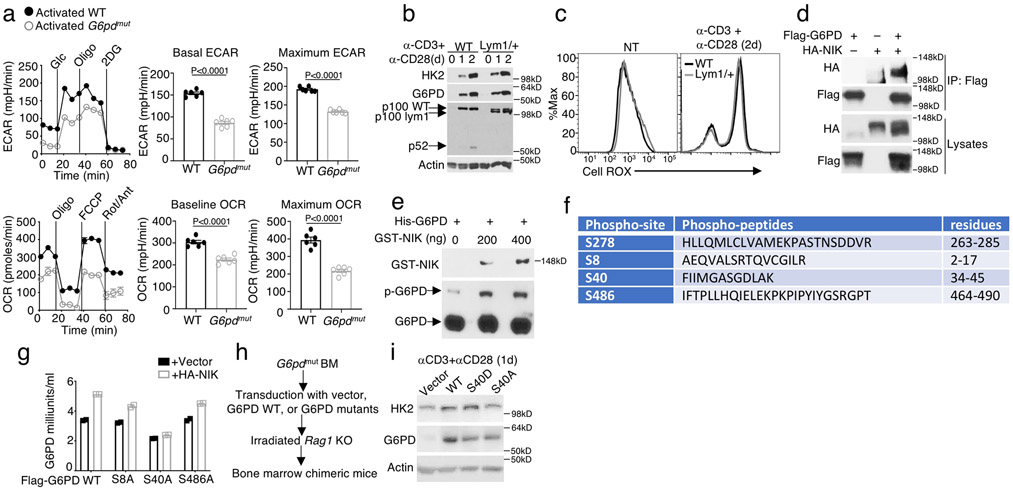
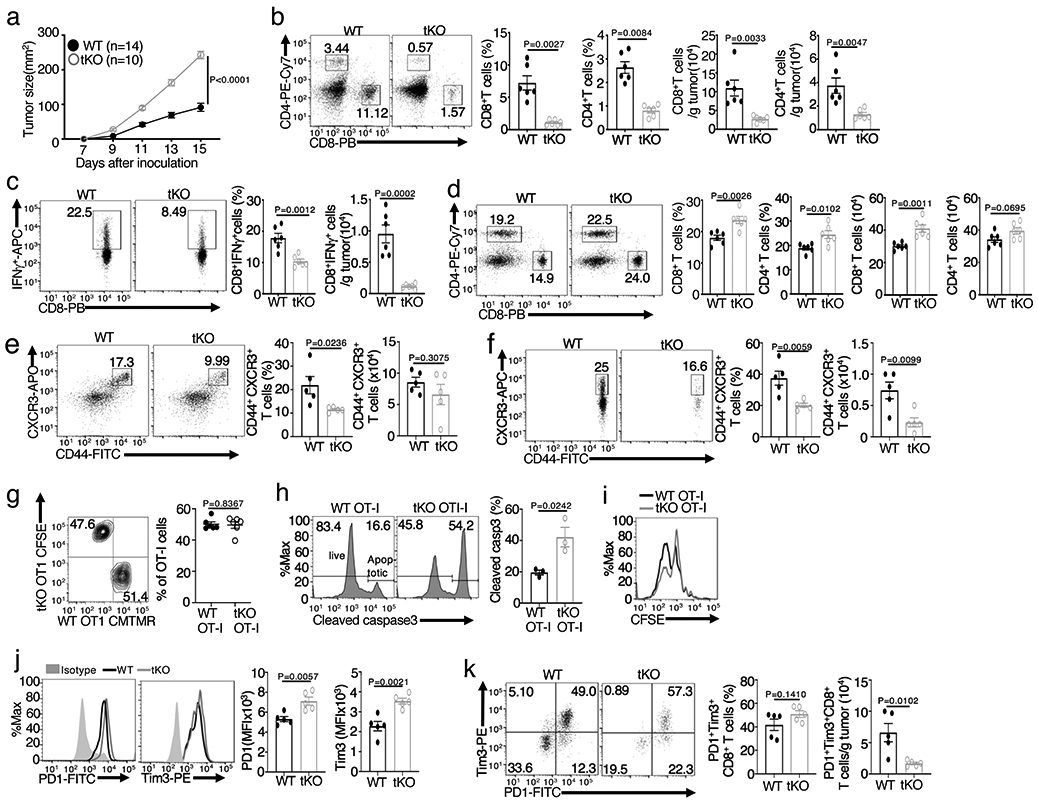
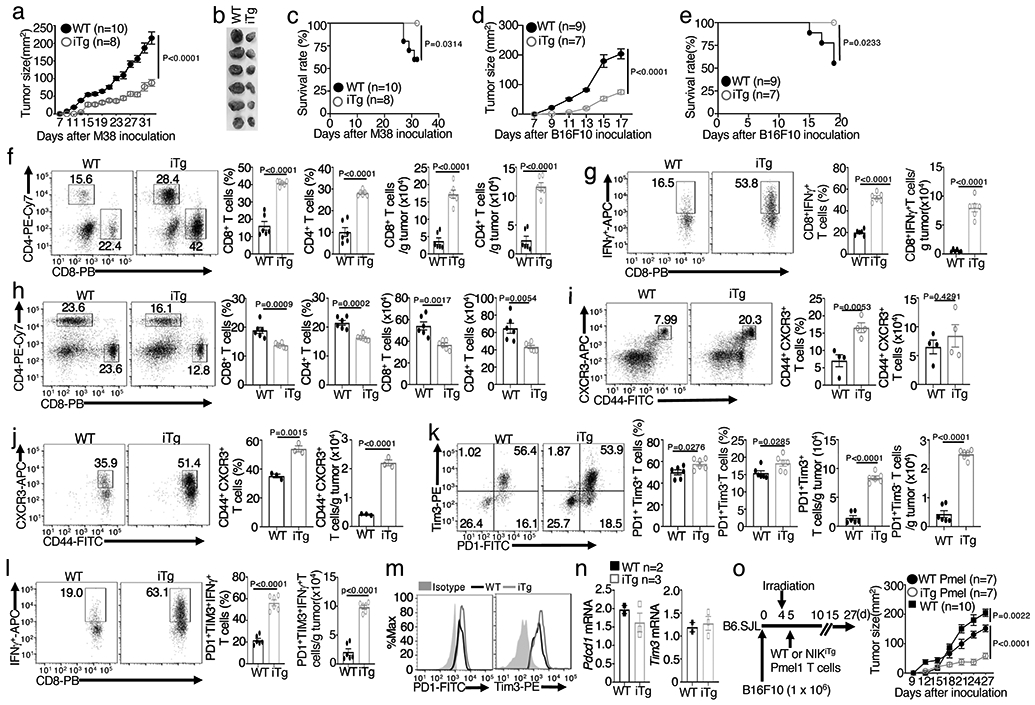
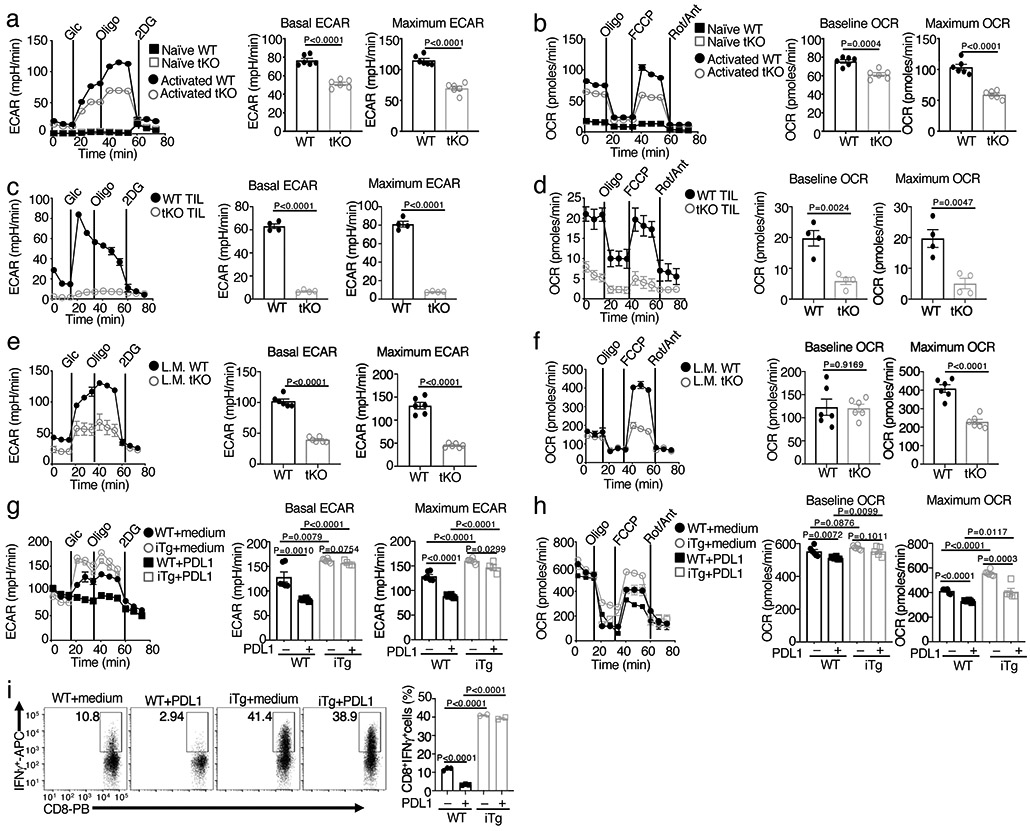
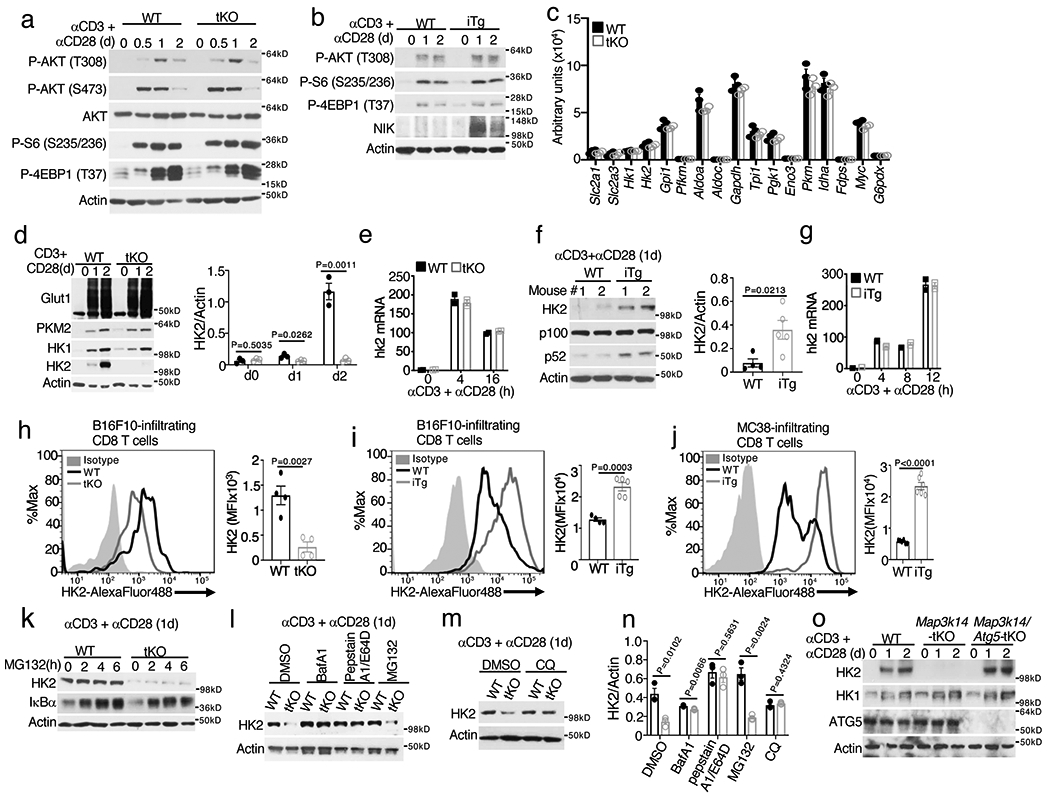
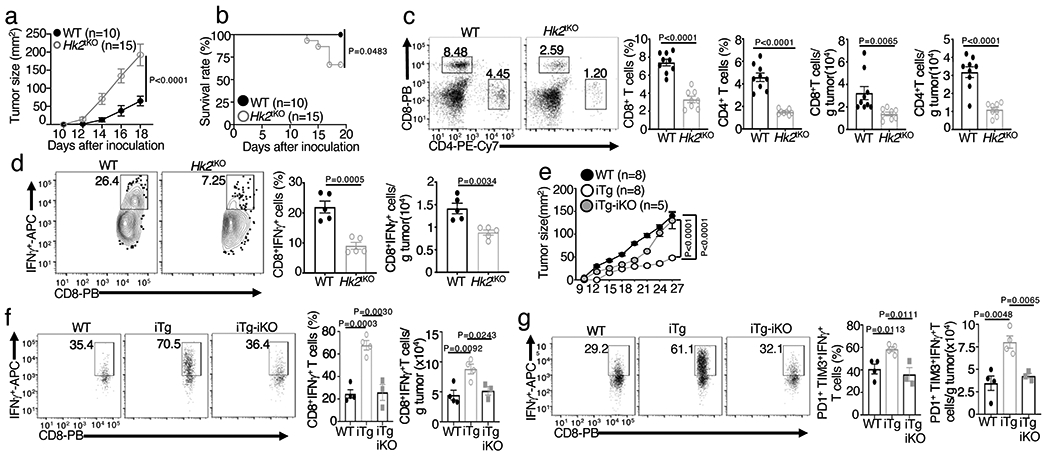
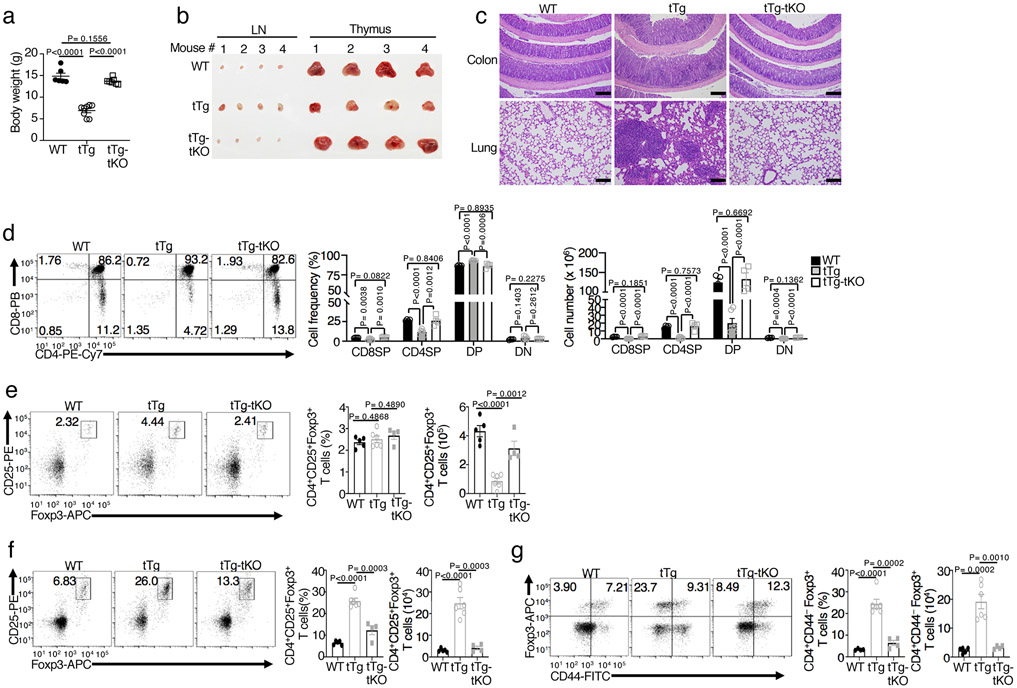
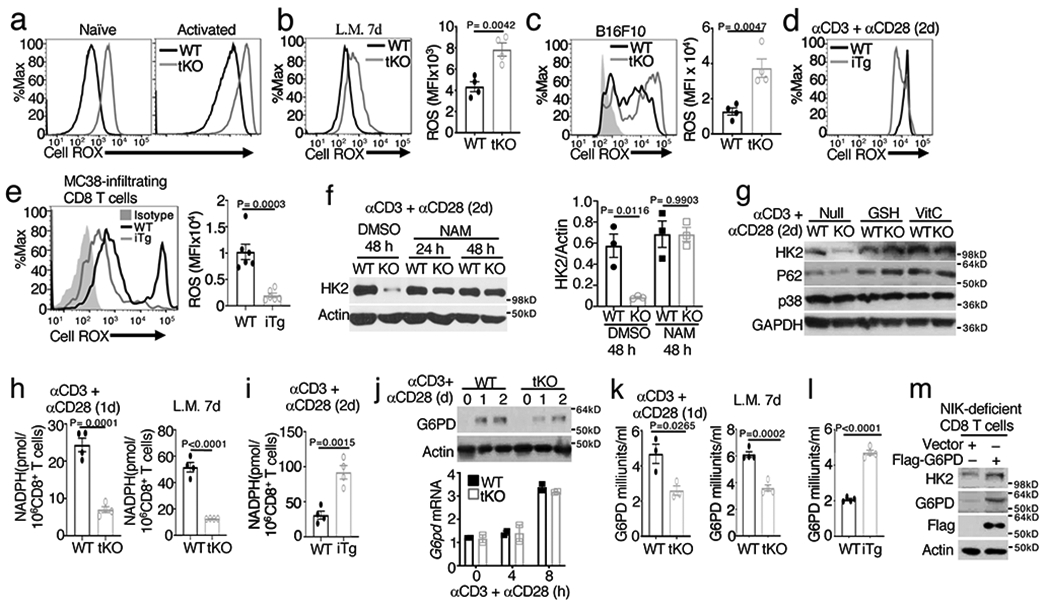
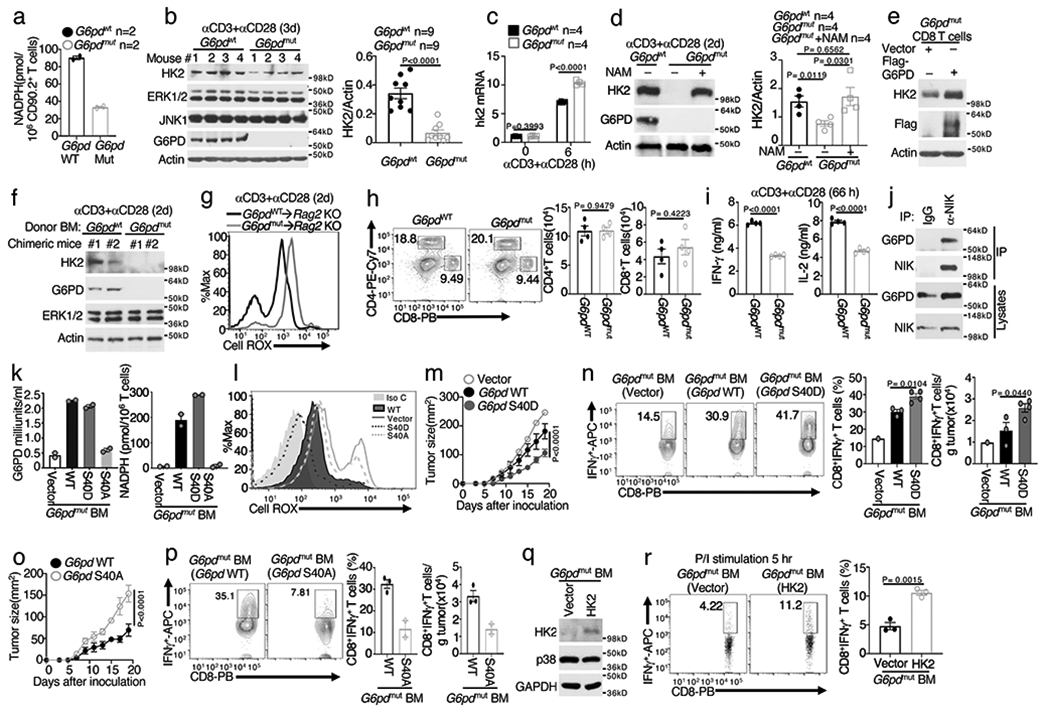
Metabolic reprograming toward aerobic glycolysis is a pivotal mechanism shaping immune responses. Here we show that deficiency in NF-κB-inducing kinase (NIK) impairs glycolysis induction, rendering CD8+ effector T cells hypofunctional in the tumor microenvironment. Conversely, ectopic expression of NIK promotes CD8+ T cell metabolism and effector function, thereby profoundly enhancing antitumor immunity and improving the efficacy of T cell adoptive therapy. NIK regulates T cell metabolism via a NF-κB-independent mechanism that involves stabilization of hexokinase 2 (HK2), a rate-limiting enzyme of the glycolytic pathway. NIK prevents autophagic degradation of HK2 through controlling cellular reactive oxygen species levels, which in turn involves modulation of glucose-6-phosphate dehydrogenase (G6PD), an enzyme that mediates production of the antioxidant NADPH. We show that the G6PD-NADPH redox system is important for HK2 stability and metabolism in activated T cells. These findings establish NIK as a pivotal regulator of T cell metabolism and highlight a post-translational mechanism of metabolic regulation.


Figures

Extended Data Fig. 1
Extended Data Fig. 1. NIK regulates T cell exhaustion and antitumor immunity
a, genotyping PCR of R26StopFLMap3k14 (Map3k14Tg), Map3k14+/+CreER, and R26StopFLMap3k14-CreER (Map3k14TgCreER) mice, showing the PCR products of NIK-GFP in Map3k14Tg allele and CreER. b, Immunoblot analysis of NIK expression in tamoxifen-treated Map3k14+/+CreER (WT) and Map3k14TgCreER (iTg) mice. c, Schematic of experimental design for producing B16F10 tumor-bearing NIKiTg and WT control mice. Each mouse was injected s.c. with 5 x 10⁵ B16F10 cells (WT=9, iTg=7). d,e, Flow cytometric analysis of the frequency and absolute cell number of CD4 and CD8 T cells in the tumor (d) or draining lymph node (e) of day 18 B16F10 tumor-implanted NIK-iTg and WT mice (d, WT: n=4; iTg: n=5; e, n=6 per genotype). f,g, Flow cytometric analysis of the frequency and absolute number of CD44+CXCR3+ CD8 effector T cells in the draining lymph node (f) or tumor (g) of day 18 B16F10 tumor-implanted NIK-iTg and wildtype mice (f, n=6 per genotype; g, n=4 per genotype). h,i, Flow cytometric analysis of the frequency and absolute number of PD1+Tim3+ CD8+ T cells (h) or IFNγ-producing PD1+Tim3+ CD8 T cells (i) in the tumor of day 18 B16F10-implanted NIKiTg and wildtype control mice (h,i, n=4 per genotype). Data are representative of three independent experiments. Summary data are shown as mean ± s.e.m. with P values determined by two-tailed Student’s t test.
Extended Data Fig. 2
Extended Data Fig. 2. Ectopic expression of NIK improves CD8 T cell function in adoptive T cell therapy
a,b, Flow cytometric analysis of the frequency of total donor CD8 T cells (a and IFNγ-producing donor CD8 T cells (b) in the tumor of B16F10 melanoma-bearing B6.SJL recipient mice adoptively transferred with wildtype or NIKiTg Pmel1 CD8 T cells as described in Fig. 2o (n=4 per genotype). c, In vitro cytotoxicity assay of wildtype (WT) and NIKiTg Pmel1 CD8 effector T cells towards B16F10 tumor cells at the indicated effector to tumor (E:T) ratios. d-f, Schematic of experimental design (d) and flow cytometric analysis of apoptosis based on caspase 3 cleavage (e) or proliferation based on CFSE dilution (f) of tumor-infiltrating wildtype (WT) and NIKiTg OT-I CD8 T cells in B16-OVA-tumor bearing B6.SJL mice adoptively transferred with in vitro activated and CFSE-labeled WT or NIKiTg CD8 T cells for 7 days (e, n=3 per genotype). Data are representative of two independent experiments. Summary data are shown as mean ± s.e.m. with P values determined by two-tailed Student’s t test.
Extended Data Fig. 3
Extended Data Fig. 3. NIK deficiency has no effect on mRNA expression of glycolysis-regulatory genes and glucose uptake but promotes
a, Seahorse analysis of OCR under baseline (no treatment) and maximum or stressed (injection of FCCP) conditions in untreated Map3k14tKO (tKO) or wildtype (WT) naïve CD8 T cells. Data are shown as a representative plot (upper) and summary graphs (lower, each circle represents a well). b, Volcano plot of RNA sequencing analysis of differentially expressed genes in Map3k14tKO OT-I CD8 T cells relative to WT OT-I CD8 T cells, activated with anti-CD3 plus anti-CD28 for 24 hr. c, Immunoblot analysis of the indicated proteins in WT or Map3k14tKO OT-I CD8 T cells stimulated with anti-CD3 plus anti-CD28 for the indicated time periods. d,e, Flow cytometric analysis of glucose uptake using in vitro activated (d) or B16F10 tumor-infiltrating (e) CD8 T cells. f, Flow cytometry analysis of HK2 expression in tumor-infiltrating CD8 T cells of B16F10-bearing wildtype (WT) or Hk2tKO mice, showing the specificity of the HK2 staining. g, Immunoblot analysis of HK2 and the indicated control proteins in the cytoplasmic (Cy) and lysosomal (Ly) fractions of wildtype (WT) and Map3k14tKO CD8 T cells. h, Immunoblot analysis of the indicated proteins in whole cell lysates of wildtype or Map3k14tKO CD8 T cells treated for the indicated time points in the presence (+) or absence (−) of lysosomal inhibitors, E64D plus pepstatin A. i, Summary of h based on densitometric quantification of three independent experiments. Data are representative of two (b,f) or three(a,c-e,g-h) independent experiments. Summary data are shown as mean ± s.e.m. with P values determined by two-tailed Student’s t test.
Extended Data Fig. 4
Extended Data Fig. 4. T cell-specific deletion of HK2 impairs T cell metabolism and immune responses against tumorigenesis and bacterial infection
a,b, Genotyping PCR (a) and immunoblot (b) analysis of the Hk2tKO (tKO) and wildtype (WT) control mice. c,d, Seahorse analysis of basal ECAR (measured after glucose injection, Glc) and maximum ECAR (measured after oligomycin injection, Oligo) (c) and Seahorse analysis of baseline OCR (no treatment) and maximum OCR (FCCP injection) (d) in Hk2tKO or wildtype OT-I CD8 T cells either naïve or activated with anti-CD3 and anti-CD28 for 24 h. e, Flow cytometric analysis of the expression level of PD1 and Tim3 in CD8 T cells isolated from day-20 tumor of the B16F10-implanted Hk2tKO and wildtype control mice (n=4 per genotype). f,g, Flow cytometric analysis of the frequency and absolute number of IFNγ-producing CD8 effector T cells in splenocytes (f) and bacterial burden in the spleen (g, presented as a representative image and a summary graph based on multiple mice) of Hk2tKO or wildtype mice infected i.v. with L. monocytogenes (1 x 10⁵ CFU/mouse) for 7 (f) or 4 (g) days (f, n=4 per genotype; g, n=6 per genotype). h, Flow cytometric analysis of IFNγ-producing CD8 T cells in the spleen of the indicated mouse strains infected for 84 days with LCMV clone 13(4x10⁶ PFU/mouse), restimulated in vitro with 3 μg/ml LCMV gp33-41 peptide for 14 h with monensin added during the last hour; WT(n=6), Map3k14tKO(n=6) and Hk2tKO(n=3). Data are representative of two (f-h) or three (a-e) independent experiments. Summary data are shown as mean ± s.e.m. with P values determined by two-tailed Student’s t test.
Extended Data Fig. 5
Extended Data Fig. 5. NIK-mediated stimulation of antitumor T cell responses requires HK2
Flow cytometric analysis of the frequency and absolute cell number of CD4 and CD8 T cells (a), PD1+Tim3+ CD8 T cells (b) and flow cytometric analysis of the expression level (MFI) of PD1 and Tim3 in CD8 T cells (c) in day-27 tumor of wildtype (WT), NIKiTg (iTg), NIKiTgHk2iKO (iTg-iKO) mice injected s.c. with 5 x 10⁵/mouse MC38 colon cancer cells (a,b, WT: n=4; iTg: n=4; iTg-iKO: n=3). Data are representative of two independent experiments. Summary data are shown as mean ± s.e.m. with P values were determined by two-tailed Student’s t test.
Extended Data Fig. 6
Extended Data Fig. 6. Noncanonical NF-κB activation is not required for HK2 stabilization or T cell metabolism
a, Immunoblot analysis of HK2 expression and p100 processing (as a measure of noncanonical NF-kB activation) in WT or Nfkb2Lym1/+ (Lym1/+) OT-I CD8 T cells stimulated with anti-CD3 plus anti-CD28 for the indicated time periods. b,c, Seahorse analysis of basal ECAR (after glucose injection) and maximum ECAR (after oligomycin injection) (b) and Seahorse analysis of baseline OCR (no treatment) and maximum OCR (FCCP injection) (c) of WT or Nfkb2Lym1/+ (Lym1/+) OT-I CD8 T cells, either naïve or activated with anti-CD3 and anti-CD28 for 24 h, under baseline and stressed conditions. d, Coimmunoprecipitation analysis of NIK-HK2 interaction using whole-cell lysates of 293 cells transfected with (+) or without (−) the indicated expression vectors. Data are representative of three independent experiments. Summary data are shown as mean ± s.e.m. based on multiple wells (each circle represents a well) with P values determined by two-tailed Student’s t test.
Extended Data Fig. 7
Extended Data Fig. 7. ROS is involved in HK2 degradation in NIK-deficient CD8 T cells
a, Flow cytometric analysis of ROS levels in Map3k14tKO OT-I CD8 T cells activated with anti-CD3 plus anti-CD28 for 48h in the presence of NAM or solvent control DMSO. b,c, Immunoblot analysis of HK2 expression in Map3k14tKO (tKO) or wildtype (WT) OT-I CD8 T cells activated with anti-CD3 plus anti-CD28 for 48h in the presence of the antioxidant N-acetylcysteine (NAC) or medium control (b) or the indicated ROS inducers and DMSO control (c). d, Immunoblot analysis of HK2 in wildtype (WT) or Atg5-tKO CD8 T cells activated with anti-CD3 plus anti-CD28 for 48h in the presence of the indicated ROS inducers or medium control. e, Immunoblot analysis of HK2 and the indicated loading controls in lysosomal (Ly) and cytoplasmic (Cy) fractions of wildtype (WT) and Map3k14tKO CD8 T cells activated with anti-CD3 plus anti-CD28 for 48 h in the presence of NAC or medium control. f, Flow cytometry analysis of the mass and membrane potential of mitochondria in wildtype (WT) and Map3k14tKO (tKO) CD8 T cells stimulated with anti-CD3 plus anti-CD28 for 24 h. g, Ratio of reduced (GSH) and oxidized (GSSG) forms of glutathione in Map3k14tKO (upper), NIKiTg (lower), or wildtype (WT) control OT-I CD8 T cells activated in vitro with anti-CD3 plus anti-CD28 for 48 h. Data are representative of three independent experiments. Summary data are shown as mean ± s.e.m. with P values determined by two-tailed Student’s t test.
Extended Data Fig. 8
Extended Data Fig. 8. G6PD phosphorylation by NIK and role in regulating HK2 expression and T cell metabolism
a, Seahorse analysis of basal ECAR (measured after glucose injection, Glc) and maximum ECAR (measured after oligomycin injection, Oligo) and Seahorse analysis of baseline OCR (no treatment) and maximum OCR (FCCP injection) in G6PDmut or wildtype (WT) control T cells activated by anti-CD3 plus anti-CD28 for 48 h. b,c, Immunoblot analysis of the indicated proteins (b) and ROS detection (c) in wildtype or Nfkb2lym1/+ (Lym1/+) CD8 T cells, which were either not treated (NT) or stimulated with anti-CD3 plus anti-CD28 for the indicated time periods. d, CoIP analysis of NIK-G6PD interaction (upper) and immunoblot analysis of HA-NIK and Flag-G6PD expression in whole-cell lysates (WCL) of 293 cells transfected with (+) or without (−) Flag-G6PD and HA-NIK. e, Phos-tag SDS PAGE and Immunoblot analysis of phosphorylated (p-) and total G6PD as well as GST-NIK in an in vitro kinase assay mix containing 500 ng recombinant His-G6PD and the indicated amounts of recombinant GST-NIK. f, NIK-induced G6PD phosphorylation sites identified by mass spectrometry analysis of G6PD phosphorylated in vitro by NIK. g, G6PD activity in 293T cells transiently transfected with Flag-tagged wildtype G6PD or the indicated G6PD mutants along with either an empty vector or HA-NIK. h,i, Schematic of experimental design (h) and immunoblot analysis of G6PD expression in T cells isolated from bone marrow chimeric mice constructed using G6PDmut bone marrow cells reconstituted with either an empty vector (Vector) or the indicated G6PD expression vectors (i). For a and g, data are shown as representative plots, each circle represents a well. Data are representative of one (f) or three (a-e,g-i) independent experiments. Summary data are shown as mean ± s.e.m. with P values determined by two-tailed Student’s t test.
Figure 1.
Figure 1.. T cell-specific deletion of NIK impairs antitumor immunity.
a, Tumor growth curve of Map3k14tKO (tKO) and wildtype (WT) control mice injected s.c. with 2 x 10⁵ B16F10 melanoma cells. b,c, Flow cytometric analysis of the frequency and absolute cell number of CD4+ and CD8+ T cells (b) and IFN-γ-producing CD8+ effector T cells (c) in the tumor of day16 B16F10-implanted Map3k14tKO and wildtype mice (b,c, n=6 per genotype). d-f, Flow cytometric analysis of the frequency and absolute number of CD4+ and CD8+ T cells in the draining lymph node (d), CD44+CXCR3+ CD8+ effector T cells in the draining lymph node (e), and CD44+CXCR3+ CD8+ effector T cells in the tumor (f) of day16 B16F10-implanted Map3k14tKO and wildtype control mice (d, n=6 per genotype; e,f, n=5 per genotype). g, Flow cytometrc analysis of tumor-infiltrating wildtype and Map3k14tKO OT-I CD8+ T cells in B16-OVA-tumor bearing B6 mice adoptively transferred (on day 17) with a mixture (1:1 ratio) of in vitro activated wildtype (CMTMR labeled) and Map3k14tKO (CFSE labeled) OT-I CD8+ T cells (n=6 per group). h,i, Flow cytometric analysis of apoptosis based on caspase 3 cleavage (h) and proliferation based on CFSE dilution (i) of tumor-infiltrating wildtype and Map3k14tKO OT-I CD8+ T cells in B16-OVA-tumor bearing B6.SJL mice adoptively transferred on day 14 with in vitro activated and CFSE-labeled wildtype and Map3k14tKO CD8+ T cells for 7 days; n=3 per genotype. j,k, Flow cytometric analysis of the expression level (MFI) of PD1 and Tim3 in CD8+ T cells (j) or the frequency and absolute number of PD1+Tim3+ CD8+ T cells (k) in the tumor of day16 B16F10-implanted Map3k14tKO and wildtype mice (j,k, n=5 per genotype). Data are representative of two (g-i) or three (a-f, j,k) independent experiments. Summary data are shown as mean ± s.e.m. with P values determined by two-way analysis of variance (ANOVA) with Bonferroni correction (a), two-tailed Student’s t test (b-h, j, k).
Figure 2.
Figure 2.. Ectopic expression of NIK prevents T cell exhaustion and promotes antitumor immunity.
a-c, Tumor growth curve (a), image of day 32 tumors (b), and survival curve (c) of the MC38-bearing NIKiTg and wildtype control mice. d,e, Tumor growth (d) and survival (e) curves of NIKiTg and wildtype control mice injected s.c. with 5 x 10⁵ B16F10 melanoma cells. f,g, Flow cytometric analysis of the frequency and absolute cell number of CD4+ and CD8+ T cells (f) and IFN-γ-producing CD8+ effector T cells (g) in day-32 tumor of MC38-bearing NIKiTg and wildtype control mice (f,g, n=6 per genotype). h-j, Flow cytometric analysis of the frequency and absolute cell number of CD4+ and CD8+ T cells in the draining lymph node (h) and CD44+CXCR3+ CD8+ effector T cells in the draining lymph node (i) or tumor (j) of day-32 MC38-implanted NIKiTg and wildtype control mice (h, n=6 per group; i, n=4 per group; j, n=3 per group). k,l, Flow cytometric analysis of the frequency and absolute cell number of PD1+Tim3+ and PD1+Tim3 CD8+ T cells (k) and IFN-γ-producing gated PD1+Tim3+ CD8+ T cells (l) in day-32 tumor of the MC38-bearing wildtype or iTg mice (k,l, n=6 per genotype). m,n, Flow cytometry (m) and qRT-PCR (n) analyses of PD1 and Tim3 expression level in tumor-infiltrating PD1+Tim3+ CD8+ T cells of MC38-bearing (day 32) wildtype or iTg mice (n, WT: n=2; NIKiTg: n=3) . o, Schematic of experimental design (left) and tumor growth curve (right) of B16F10-impanted B6 mice adoptively transferred with in vitro generated (treated with 4OH-tamoxifen) NIKiTg Pmel1 or WT Pmel1 CD8+ T cells, activated with anti-CD3 plus anti-CD28 for 5 days. Control mice were inoculated with B16F10 cells without irradiation and Pmel1 T cell injection. Data are representative of three independent experiments. Summary data are shown as mean ± s.e.m. with P values determined by two-way analysis of ANOVA with Bonferroni correction (a,d,o), two sided log-rank test (c,e), or two-tailed Student’s t test (f-l).
Figure 3.
Figure 3.. NIK regulates metabolic reprogramming along with T cell activation both in vivo and in vitro.
a,b, Seahorse analysis of basal ECAR (measured after glucose injection, Glc) and maximum ECAR (measured after oligomycin injection, Oligo) conditions (a) and Seahorse analysis of baseline OCR (no treatment) and maximum OCR (FCCP injection) (b) in Map3k14tKO (tKO) or wildtype (WT) control OT-I CD8+ T cells, either naive or activated by anti-CD3 plus anti-CD28 for 24 h. c,d, Seahorse analysis of ECAR (c) and OCR (d), as described in a and b, using total T cells isolated from day 16 tumor of B16F10-implanted wildtype (WT) or Map3k14tKO (n=5) and activated with anti-CD3 and anti-CD28 for 24 h. e,f, Seahorse analysis of ECAR (e) and OCR (f) using OT-I CD8+ T cells freshly isolated from the spleen of day 7 L. monocytogenes (L.M.)-infected wildtype (WT) or Map3k14tKO mice without in vitro activation (n=3). g,h, Seahorse analysis of ECAR (g) and OCR (h) using wildtype (WT) or NIKiTg CD8+ T cells activated for 72 h with anti-CD3 plus anti-CD28 in the presence of 4OH-tamoxifen (0.2 μg/ml, to induce CreER-mediated NIK expression), followed by treatment with PDL1 (0.5 μg/ml) or medium for 24 h. i, Flow cytometric analysis of intracellular IFN-γ in wildtype (WT) or NIKiTg CD8+ T cells activated for 72 h with anti-CD3 plus anti-CD28 in the presence of the CreER inducer 4OH-tamoxifen as in (f), followed by treatment with soluble PDL1 or medium for 24 h. Data are representative of three independent experiments. Summary data are shown as mean ± s.e.m. based on multiple wells (a-h, each circle represents a well) or mice (i, each circle represents a mouse), with P values determined by two-tailed Student’s t test.
Figure 4.
Figure 4.. NIK deficiency causes autophagic degradation of HK2.
a,b, Immunoblot analysis of the indicated phosphorylated (p-) and total proteins in wildtype (WT) and Map3k14tKO (tKO) OT-I CD8+ T cells (a) or WT and NIKiTg (iTg) CD8+ T cells (generated in vitro by treating Map3k14+/+CreER and Map3k14TgCreER CD8+ T cells with 4OH-tamoxifen) (b), stimulated with anti-CD3 plus anti-CD28 for the indicated time periods. c, Summary of RNA sequencing data on the expression of glycolysis-regulatory genes in Map3k14tKO and WT OT-I CD8+ T cells, activated with anti-CD3 plus anti-CD28 for 24 hr (n=3 per genotype). d-g, Immunoblot analysis of the indicated proteins (d,f) and qRT-PCR analysis of Hk2 mRNA (e,g) in Map3k14tKO and wildtype control T cells (d,e) or NIKiTg (iTg) and wildtype control (WT) T cells (f,g), activated with anti-CD3 plus anti-CD28 for the indicated time points. Summary graphes of d and f are based on densitometric quantification of two (f) or three (d) independent experiments. h-j, Flow cytometric analysis of intracellular HK2 in tumor infiltrating CD8+ T cells from day16 B16F10-implanted Map3k14tKO and wildtype control mice (h), day18 B16F10-implanted NIKiTg and wildtype control mice (i), or day 32 MC38-implanted NIKiTg and wildtype control mice (j) (h, n=4 per genotype; i, WT: n=4; NIK-iTg: n=5; j, n=6 per genotype). k-m, Immunoblot analysis of the indicated proteins in wildtype and Map3k14tKO OT-I CD8+ T cells stimulated for 24 h with anti-CD3 plus anti-CD28 followed by incubation with MG132 for the indicated time (k), with the indicated agents or solvent control DMSO for 6 h (l), or with chloroquine (CQ) for 12 h (m). n, Summary of k to m based on densitometric quantification of three independent experiments. o, Immunoblot analysis of the indicated proteins in total T cells isolated from the spleen of wildtype, Map3k14tKO, and Map3k14/Atg5tKO mice and activated with anti-CD3 and anti-CD28 for the indicated time points. Data are representative of two (c,f) or three (a,b,d,e,g-o) independent experiments. Summary data are shown as mean ± s.e.m. with P values determined by two-tailed Student’s t test.
Figure 5.
Figure 5.. HK2 is required for antitumor immunity.
a,b, Tumor growth (a) and survival (b) curves of Hk2tKO or wildtype (WT) control mice injected s.c. with 105 B16F10 melanoma cells for the indicated time periods. c,d, Flow cytometric analysis of the frequency and absolute number of CD4+ and CD8+ T cells (c) and IFN-γ-producing CD8+ effector T cells (d) in day 20 tumor of the B16F10-implanted Hk2tKO and wildtype control mice (c,WT: n=9; Hk2tKO: n=8; d, n=5 per genotype). e, Tumor growth curve of MC38 tumor-bearing wildtype, NIKiTg (iTg), and NIKiTgHk2iKO (iTg-iKO) mice. f,g, Flow cytometric analysis of the frequency and absolute cell number of IFN-γ-producing CD8+ T cells (f) and gated PD1+Tim3+ CD8+ T cells (g) in day-27 tumor of the MC38 tumor-bearing mice (f,g, WT: n=4, iTg: n=4, iTg-iKO: n=3) . Data are representative of two (e-g) or three (a-d) independent experiments. Flow cytometry data are presented as representative plots (left) and summary graphs (mean ± s.e.m.) based on multiple mice (right, each circle represents an individual mouse). P values were determined by two-way analysis of ANOVA with Bonferroni correction (a,e), two-tailed Student’s t test (c,d,f,g) or two sided log- rank test (b).
Figure 6.
Figure 6.. HK2 deletion blocks the autoimmune phenotype of NIKtTg mice.
a, Body weight of 36-day old wildtype (WT), NIKtTg (tTg), and NIKtTgHktKO (tTg-tKO) littermate mice (WT: n=5, tTg: n=8, tTg-tKO: n=7) .b, Image of inguinal lymph nodes and thymi of four pairs of mice with the indicated genotypes. c, H&E staining of colon and lung sections from moribund NIKtTg, NIKtTgHktKO and age-matched littermate wildtype control mice were assessed for leukocyte infiltrates by hematoxylin-eosin stain. Scale bars: 100 μm.(n=3 in each group). d-g, Flow cytometric analysis of the frequency and absolute cell number of double-negative (DN), double-positive (DP), CD8+ single-positive (SP), and CD4+ SP thymocytes (d), thymic CD25+foxp3+ Treg cells (e), lymph node CD25+foxp3+ Treg cells (f), and lymph node CD44foxp3+ Treg cells (g) in NIKtTg, NIKtTgHktKO or wildtype mice (e-f, NIKiTg: n=6, NIKtTgHktKO: n=4, wildtype: n=5). Data are representative of two (a-c,e-g) or three (d) independent experiments. Summary data are shown as mean ± s.e.m. with P values determined by two-tailed Student’s t test (a,d-g) .
Figure 7.
Figure 7.. NIK protects HK2 degradation through regulation of G6PD-NADPH redox system and ROS level.
a-c, Flow cytometric analysis of cellular ROS levels (Cell ROX) in naive or in vitro activated (anti-CD3 plus anti-CD28 24 h) OT-I CD8+ T cells from wildtype (WT) and Map3k14tKO (tKO) mice (a) or in OT-I CD8+ T cells freshly isolated from the spleen of day 7 L. monocytogenes (L.M.)-infected (b) or in tumor infiltrating CD8+ T cells from day 16 tumor of B16F10-implanted (c) wildtype and Map3k14tKO mice (b,c, n=4 per genotype). d,e, Flow cytometric analysis of cellular ROS levels in activated (anti-CD3 plus anti-CD28 48h) total T cells from wildtype and NIKiTg mice (d) or in tumor infiltrating CD8+ T cells from day-32 MC38-implanted wildtype and NIKiTg mice (e) (e, n=6 per genotype). f,g, Immunoblot analysis of HK2 expression in wildtype or Map3k14tKO (KO) OT-I CD8+ T cells activated with anti-CD3 plus anti-CD28 for the indicated time periods in the presence of the ROS inhibitor NAM (f), GSH and Vit C (g) or solvent control DMSO. The right panel of f is a summary graph of densitometric quantification data based on three independent experiments. h, Whole-cell NADPH concentration measured in 1 x 10⁶ in vitro activated (anti-CD3 plus anti-CD28 24 h) wildtype or Map3k14tKO OT-I CD8+ T cells (left), or OT-I CD8+ T cells isolated from the spleen of day 7 L. monocytogenes (L.M.)-infected wildtype and Map3k14tKO mice (right) (n=4 per genotype). i, Whole-cell NADPH concentration measured with in vitro activated (anti-CD3 plus anti-CD28 48h) CD8+ T cells prepared from wildtype or NIKiTg mice (n=4 per getotype). j, Immunoblot (upper) and qRT-PCR (lower) analysis of G6PD expression in wildtype or Map3k14tKO OT-I CD8+ T cells activated with anti-CD3 plus anti-CD28 for the indicated time points. k, G6PD activity in wildtype and Map3k14tKO OT-I CD8+ T cells activated in vitro for 24 h with anti-CD3 plus anti-CD28 (left, n=3 per genotype) or isolated from L. monocytogenes (L.M.)-infected mice (right, n=4 per genotype). l, G6PD activity in total T cells isolated from wildtype or NIKiTg mice injected with tamoxifen for 5 days and activated in vitro with anti-CD3 plus anti-CD28 for 24 h (n=4 per genotype). m, Immunoblot analysis of HK2 and G6PD (using both G6PD and Flag antibodies) in NIK-deficient CD8+ T cells transduced with (+) either an empty vector or Flag-tagged G6PD vector. Data are representative of three independent experiments. Summary data are shown as mean ± s.e.m. with P values determined by two-tailed Student’s t test.
Figure 8.
Figure 8.. G6PD is required for HK2 stable expression and T cell functions.
a-c, Whole-cell NADPH concentration (a), immunoblot (b), right panel in b is a summary graph of densitometric quantification of three independent experiments, and qRT-PCR (c) assays using total T cells isolated from wildtype (G6pdWT) or G6PDmut mice, in vitro activated with anti-CD3 plus anti-CD28 for 72 h (a,b) or as indicated (c) (a, n=2 per genotype; c, n=4 per genotype). d, Immunoblot analysis using lysates of G6PDWT or G6PDmut T cells, stimulated with anti-CD3 plus anti-CD28 for 48 h in the presence (+) or absence (−) of NAM. Right panel is a summary graph of densitometric quantification of two independent experiments (n=4 per genotype). e, Immunoblot analysis using lysates of G6PDmut CD8+ T cells transduced with either a control vector or Flag-G6PD. f,g, Immunoblot (f) and flow cytometric analysis of ROS level (g) using total T cells isolated from chimeric mice transferred with G6PDWT or G6PDmut bone marrows, in vitro activated with anti-CD3 plus anti-CD28 for 48 h. h, Flow cytometric analysis of CD4+ and CD8+ T cells in the spleen of G6PDWT and G6PDmut mice. i, ELISA of IFN-γ and IL-2 in the supernatant of G6PDWT and G6PDmut CD8+ T cell cultures stimulated with anti-CD3 plus anti-CD28 for 66 h. j, CoIP analysis of endogenous NIK-G6PD interaction using whole-cell lysates of CD8+ T cells isolated from NIKiTg mice and activated for 48 h with anti-CD3 plus anti-CD28 in the presence of 4OH-tamoxifen. MG132 and BV6 were added during the last 4 h to block NIK degradation. An immunoprecipitation with IgG was included as a negative control. k,l, Summary graph of G6PD activity and NADPH concentration (k) and flow cytometric analysis of ROS level (l) in splenic CD8+ T cells of chimeric mice adoptively transferred with G6PDmut bone marrow cells transduced with an empty vector (vector) or expression vectors encoding G6PD wildtype (WT) or mutants. m-p, Tumor growth curves (m,o) and flow cytometric analysis of tumor-infiltrating CD8+ T cells producing IFN-γ (n,p) in chimeric mice adoptively transferred with G6PDmut bone marrow cells transduced with the indicated expression vectors (m,n, vector: n=7, 1 survived; WT: n=4, 3 survived; S40D: n=5, 5 survived); o,p, WT: n=4, 3 survived; S40A: n=5, 2 survived). q, Immunoblot using T cells of chimeric mice adoptively transferred with G6PDmut bone marrow cells that had been transduced with an empty vector or HK2. r, Flow cytometric analysis of IFN-γ-producing CD8+ T cells derived from chimeric mice of vector- or HK2-transduced G6PDmut bone marrow cells (described in q), in vitro stimulated for 5 h with PMA plus Ionomycin in the presence of monensin (n=3 per genotype). Data are representative of one (k-r), two (a,d,e-i), or three (b,c,,j) independent experiments. Summary data are shown as mean ± s.e.m. with P values determined by two-tailed Student’s t test.

References

    1. Durgeau A, Virk Y, Corgnac S & Mami-Chouaib F Recent Advances in Targeting CD8 T-Cell Immunity for More Effective Cancer Immunotherapy. Frontiers in immunology 9, 14 (2018). - PMC - PubMed
    1. Geltink RIK, Kyle RL & Pearce EL Unraveling the Complex Interplay Between T Cell Metabolism and Function. Annu Rev Immunol 36, 461–488 (2018). - PMC - PubMed
    1. Lim AR, Rathmell WK & Rathmell JC The tumor microenvironment as a metabolic barrier to effector T cells and immunotherapy. eLife 9 (2020). - PMC - PubMed
    1. Almeida L, Lochner M, Berod L & Sparwasser T Metabolic pathways in T cell activation and lineage differentiation. Semin Immunol 28, 514–524 (2016). - PubMed
    1. Chang CH et al. Posttranscriptional control of T cell effector function by aerobic glycolysis. Cell 153, 1239–1251 (2013). - PMC - PubMed

Publication types

MeSH terms